Microprofile is a embeddable profiler in a few files, written in C++
Microprofile is hosted on
#include "microprofile.h"
{
	MICROPROFILE_SCOPEI("group","timername", MP_YELLOW);
	... code to be timed
}
And once each frame you should call
MicroProfileFlip(nullptr);
The implementation of microprofile is in microprofile.cpp, which you must include in your project.
The nullpointer is the void* device context passed for gpu timers.
MicroProfile can be used without calling MicroProfileFlip, in which case you should call MicroProfileDumpFileImmediately, to save the profile data as .html/.csv file on disk.
Gpu timers work like normal timers, except they are all put in a shared group, "GPU". To use them insert MICROPROFILE_SCOPEGPUI().
Gpu timers also supports multithreaded renderers - Please refer to demo_nouid3d12 for an example of how to use this.
Gpu timers are available for the following apis:
MicroProfile has support for tracking various counters, that will then be shown in the live & capture views.
	MICROPROFILE_COUNTER_ADD("memory/main", 1000);
	MICROPROFILE_COUNTER_SET("fisk/geder/", 42);
The Timeline view in a capture is intended to mark longer, unique timers. It can be used to show stuff like a level loading, with the levels name included.
There are two ways to use it. The first one uses unformatted static string literals:
	MICROPROFILE_TIMELINE_ENTER_STATIC(MP_DARKGOLDENROD, "one");
	MICROPROFILE_TIMELINE_LEAVE_STATIC("one");
The second option allows for arbitrary strings, but requires a token is stored, for the profiler to identify when leaving the marker:
	MICROPROFILE_TIMELINE_TOKEN(token);
	MICROPROFILE_TIMELINE_ENTERF(token, MP_YELLOW, "custom %d %6.2f", 10, 42.0f);
	MICROPROFILE_TIMELINE_LEAVE(token);
To start microprofile in live mode, simply point chrome to host:1338/ The live view can be used to enable different microprofile groups, using the Control menu. If no groups are enabled, no code is timed. Press the capture button to generate a capture. By default the last 30 frames are capture. The capture itself is a fully contained webpage, that can be saved and shared for further reference.
There are a few ways the webserver can be invoked
Presets can be loaded and saved directly from the webbrowser. They are saved by the application in a file named mppresets.cfg. builtin presets are presets, that are loaded from mppresets.builtin.cfg. They work like presets, except they only be loaded. This is intended to be used to do predefined, non-overwriteable configurations.
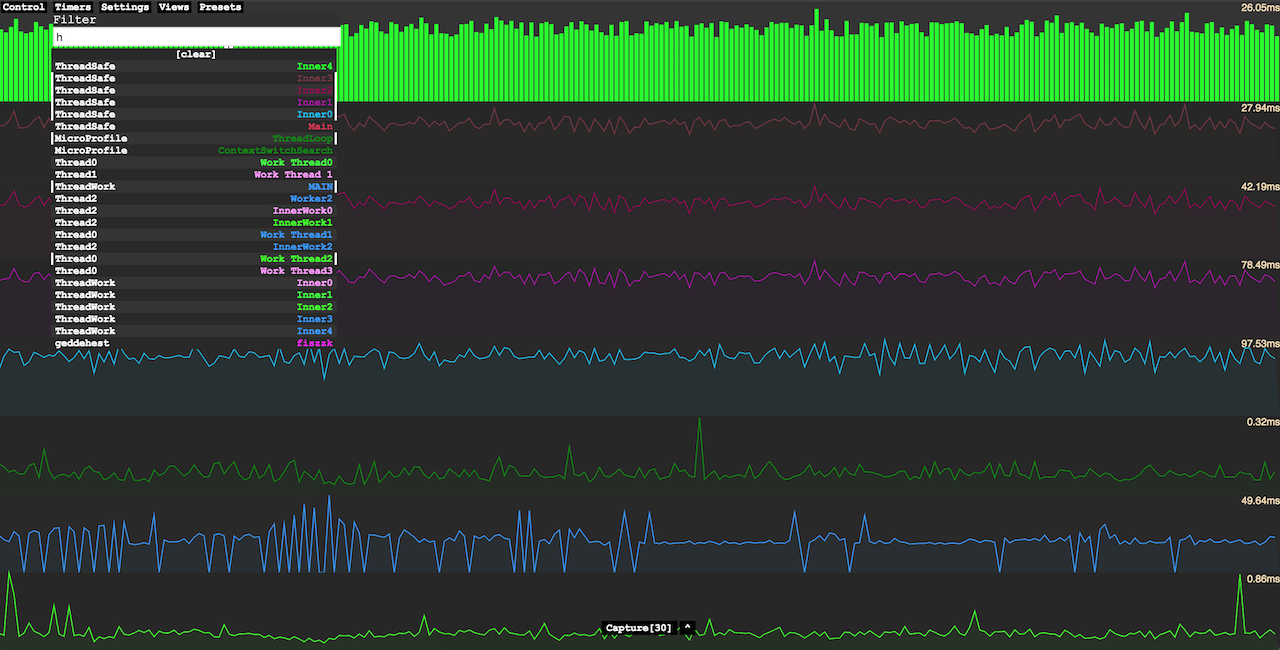
Capturing in live view provides a complete view of what is recorded in the ring buffers over a set amount of frames. Please be aware if you capture to far behind, the markers you're are looking for might be overwritten, in which case there will be no markers. As the buffers are reused per thread, this is something that will happen on a per thread basis.
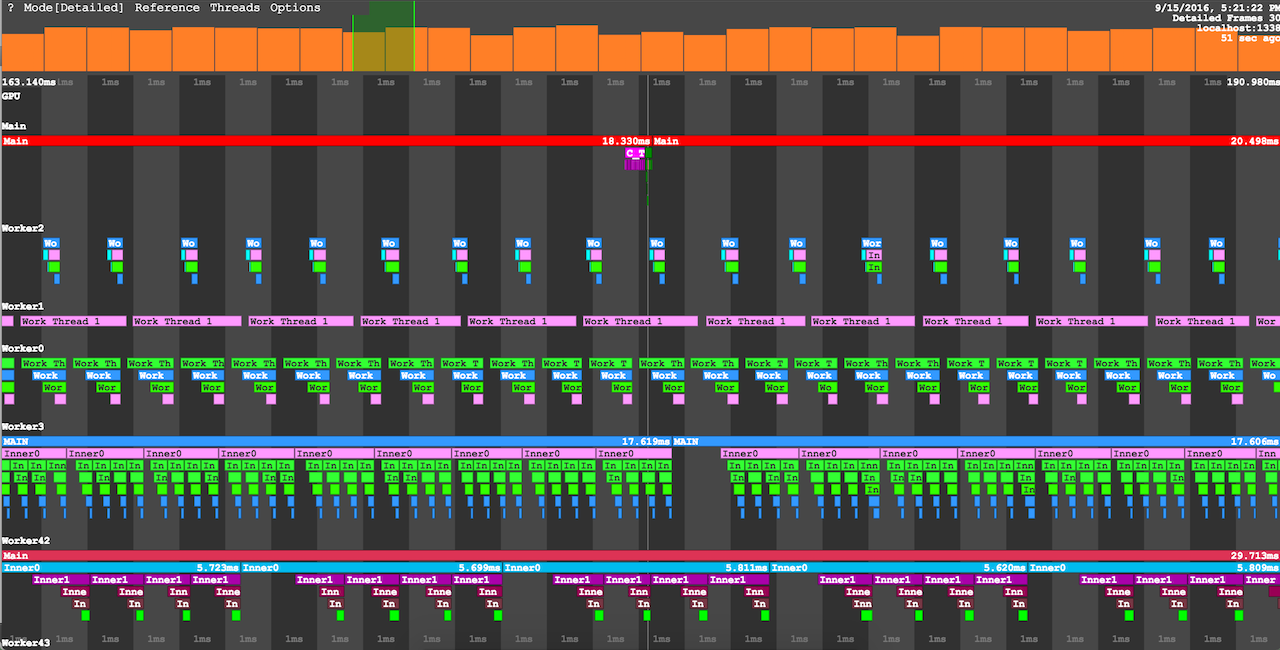
Microprofile supports comparing two different captures. Save the first capture to disk, open the second capture and click compare and browse to the first file. Please be aware that:
On Intel x86-64 Microprofile supports dynamically injecting markers into running code. This is supported on windows, osx and linux(tested on ubuntu) To use this feature
dynamic_instrument for an examplealt to pan the secondary capture without moving the first capturePlease be aware that this is still a bit experimental, and be aware of these limitations:
dladdr
If compiled and linked with Dynamic Instrumentation, two new menus appear, "modules" and "functions".
The "modules" menu allows you to load debug information from your loaded modules. Select one or more modules to load from. Once its loaded the bar behind the module name is filled, and the debug information is ready.
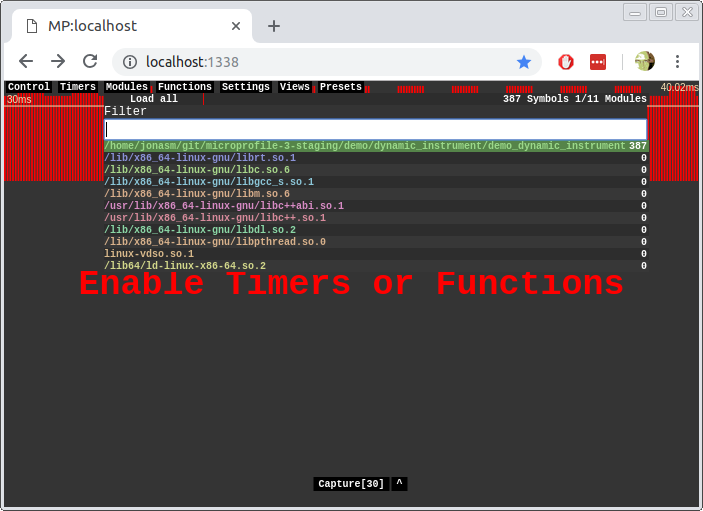
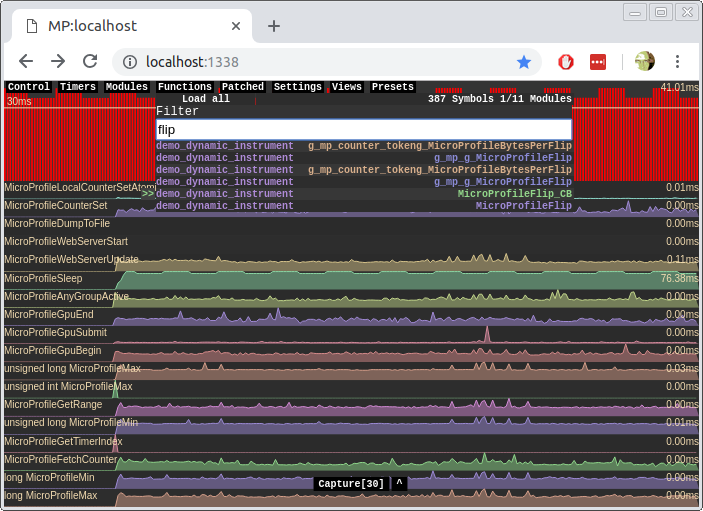
Once the debug symbols are loaded - Indicated by the number in the top of the functions menu - You can start typing to search for functions to instrument.
MicroProfile uses a few large allocations.
To change how microprofile allocates memory, define these macros when compiling microprofile implementation
Microprofile has lots of predefined macros that can be changed. To modify this, make sure MICROPROFILE_USE_CONFIG is defined, and put the changed defines in microprofile.config.h.
There are a few minor known issues & Limitations:
MicroProfileOnThreadExit when threads exit, to reuse the thread log objectsMicroprofile supports the two major consoles - Search for 'microprofile' in the closed platform forums.
Licensed using UNLICENSE
462 followers · starred Jan 2019
130 followers · starred Apr 2020
367 followers · starred Dec 2019
106 followers · starred Oct 2016
Microprofile is a embeddable profiler in a few files, written in C++
Microprofile is hosted on
#include "microprofile.h"
{
	MICROPROFILE_SCOPEI("group","timername", MP_YELLOW);
	... code to be timed
}
And once each frame you should call
MicroProfileFlip(nullptr);
The implementation of microprofile is in microprofile.cpp, which you must include in your project.
The nullpointer is the void* device context passed for gpu timers.
MicroProfile can be used without calling MicroProfileFlip, in which case you should call MicroProfileDumpFileImmediately, to save the profile data as .html/.csv file on disk.
Gpu timers work like normal timers, except they are all put in a shared group, "GPU". To use them insert MICROPROFILE_SCOPEGPUI().
Gpu timers also supports multithreaded renderers - Please refer to demo_nouid3d12 for an example of how to use this.
Gpu timers are available for the following apis:
MicroProfile has support for tracking various counters, that will then be shown in the live & capture views.
	MICROPROFILE_COUNTER_ADD("memory/main", 1000);
	MICROPROFILE_COUNTER_SET("fisk/geder/", 42);
The Timeline view in a capture is intended to mark longer, unique timers. It can be used to show stuff like a level loading, with the levels name included.
There are two ways to use it. The first one uses unformatted static string literals:
	MICROPROFILE_TIMELINE_ENTER_STATIC(MP_DARKGOLDENROD, "one");
	MICROPROFILE_TIMELINE_LEAVE_STATIC("one");
The second option allows for arbitrary strings, but requires a token is stored, for the profiler to identify when leaving the marker:
	MICROPROFILE_TIMELINE_TOKEN(token);
	MICROPROFILE_TIMELINE_ENTERF(token, MP_YELLOW, "custom %d %6.2f", 10, 42.0f);
	MICROPROFILE_TIMELINE_LEAVE(token);
To start microprofile in live mode, simply point chrome to host:1338/ The live view can be used to enable different microprofile groups, using the Control menu. If no groups are enabled, no code is timed. Press the capture button to generate a capture. By default the last 30 frames are capture. The capture itself is a fully contained webpage, that can be saved and shared for further reference.
There are a few ways the webserver can be invoked
Presets can be loaded and saved directly from the webbrowser. They are saved by the application in a file named mppresets.cfg. builtin presets are presets, that are loaded from mppresets.builtin.cfg. They work like presets, except they only be loaded. This is intended to be used to do predefined, non-overwriteable configurations.
Capturing in live view provides a complete view of what is recorded in the ring buffers over a set amount of frames. Please be aware if you capture to far behind, the markers you're are looking for might be overwritten, in which case there will be no markers. As the buffers are reused per thread, this is something that will happen on a per thread basis.
Microprofile supports comparing two different captures. Save the first capture to disk, open the second capture and click compare and browse to the first file. Please be aware that:
On Intel x86-64 Microprofile supports dynamically injecting markers into running code. This is supported on windows, osx and linux(tested on ubuntu) To use this feature
dynamic_instrument for an examplealt to pan the secondary capture without moving the first capturePlease be aware that this is still a bit experimental, and be aware of these limitations:
dladdr
If compiled and linked with Dynamic Instrumentation, two new menus appear, "modules" and "functions".
The "modules" menu allows you to load debug information from your loaded modules. Select one or more modules to load from. Once its loaded the bar behind the module name is filled, and the debug information is ready.
Once the debug symbols are loaded - Indicated by the number in the top of the functions menu - You can start typing to search for functions to instrument.
MicroProfile uses a few large allocations.
To change how microprofile allocates memory, define these macros when compiling microprofile implementation
Microprofile has lots of predefined macros that can be changed. To modify this, make sure MICROPROFILE_USE_CONFIG is defined, and put the changed defines in microprofile.config.h.
There are a few minor known issues & Limitations:
MicroProfileOnThreadExit when threads exit, to reuse the thread log objectsMicroprofile supports the two major consoles - Search for 'microprofile' in the closed platform forums.
Licensed using UNLICENSE
462 followers · starred Jan 2019
130 followers · starred Apr 2020
367 followers · starred Dec 2019
106 followers · starred Oct 2016