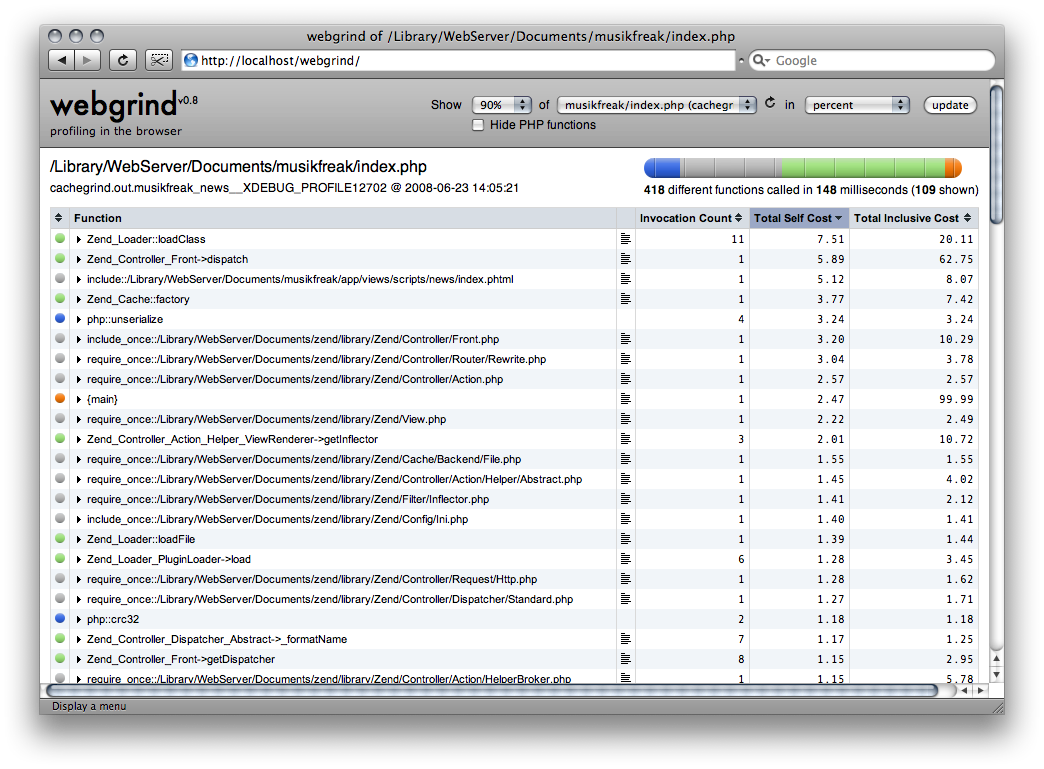
Webgrind is an Xdebug profiling web frontend in PHP. It implements a subset of the features of kcachegrind and installs in seconds and works on all platforms. For quick'n'dirty optimizations it does the job. Here's a screenshot showing the output from profiling:
Suggestions for improvements and new features are more than welcome - this is just a start.
Alternatively, on PHP 5.4+ run the application using the PHP built-in server
with the command composer serve or php -S 0.0.0.0:8080 index.php if you
are not using Composer.
For faster preprocessing, give write access to the bin subdirectory, or compile manually:
make in the unzipped folder (requires GCC or Clang.)nmake -f NMakeFile in the unzipped folder (requires Visual Studio 2015 or higher.)See the Installation Wiki page for more.
Instead of uploading webgrind to a web server or starting a local one, you can use the official Docker image to
quickly inspect existing xDebug profiling files. To use the Docker image, run the following command with
/path/to/xdebug/files replaced by the actual path of your profiling files.
docker run --rm -v /path/to/xdebug/files:/tmp -p 80:80 jokkedk/webgrind:latest
Now open http://localhost in your browser. After using webgrind you can stop the Docker container by pressing
CTRL / Strg + C.
To use the built-in file viewer, mount the appropriate files under /host in the container.
Webgrind is written by Joakim Nygård and Jacob Oettinger. It would not have been possible without the great tool that Xdebug is thanks to Derick Rethans.
Current maintainer is Micah Ng.
2,307 followers · starred Jan 2011
119 followers · starred Mar 2017
686 followers · starred Apr 2023
34 followers · starred Feb 2017
Webgrind is an Xdebug profiling web frontend in PHP. It implements a subset of the features of kcachegrind and installs in seconds and works on all platforms. For quick'n'dirty optimizations it does the job. Here's a screenshot showing the output from profiling:
Suggestions for improvements and new features are more than welcome - this is just a start.
Alternatively, on PHP 5.4+ run the application using the PHP built-in server
with the command composer serve or php -S 0.0.0.0:8080 index.php if you
are not using Composer.
For faster preprocessing, give write access to the bin subdirectory, or compile manually:
make in the unzipped folder (requires GCC or Clang.)nmake -f NMakeFile in the unzipped folder (requires Visual Studio 2015 or higher.)See the Installation Wiki page for more.
Instead of uploading webgrind to a web server or starting a local one, you can use the official Docker image to
quickly inspect existing xDebug profiling files. To use the Docker image, run the following command with
/path/to/xdebug/files replaced by the actual path of your profiling files.
docker run --rm -v /path/to/xdebug/files:/tmp -p 80:80 jokkedk/webgrind:latest
Now open http://localhost in your browser. After using webgrind you can stop the Docker container by pressing
CTRL / Strg + C.
To use the built-in file viewer, mount the appropriate files under /host in the container.
Webgrind is written by Joakim Nygård and Jacob Oettinger. It would not have been possible without the great tool that Xdebug is thanks to Derick Rethans.
Current maintainer is Micah Ng.
2,307 followers · starred Jan 2011
119 followers · starred Mar 2017
686 followers · starred Apr 2023
34 followers · starred Feb 2017



