
README
ChartX & ChartVLM

所提出的ChartX有两个主要贡献:
- (1) 为了全面评价目前多模态大模型在图表领域的能力,ChartX包含了多模态(图片,代码,CSV统计数据,文本描述),多任务(感知,图表信息提取,图表问答,图表描述,图表总结,图表重新渲染等),多学科(包含22个大类学科)的42K个高质量数据,并且我们验证了目前很多多模态大模型在ChartX评测集上的全面性能(包括,图表结构化信息提取,图表类别识别,图表转CSV Table,图表问答,图表洞察,图表重新渲染等任务)。
- (2) ChartVLM作为在图表领域定制化开发的大模型,其利用结构化提取后的图表数据信息来辅助复杂推理任务,极大增加了大模型在图表问答等复杂推理任务上的可解释性,利用Instruction Adapter来根据用户指令动态选择需要执行的任务以及对应的模型模块。
ChartX presents two primary contributions.
- (1) To comprehensively and rigorously benchmark the ability of the off-the-shelf MLLMs in chart domain, we construct an evaluation set covering multi-modal (image, code, csv, text description), multi-task, multi-disciplinary, high-quality chart data, and evaluate the performance of mainstream MLLMs.
- (2) We develop ChartVLM, offering a new perspective on handling the multi-modal tasks that strongly depend on interpretable patterns such as reasoning tasks in the field of chart or geometric images. To augment the model’s interpretability in cognition tasks in chart domain, ChartVLM incorporates the intermediate chart representations such as CSV data, chart title, chart type, etc.

评估集介绍(Overall of Evaluation Set)
我们构建了包含4.8万条高质量、多模态、22学科、18类别、7任务的图表数据。每个图表数据都包含4种模态:图像,CSV数据,绘图python代码,任务和图表问答描述
We collected 48K multi-modal chart data covering 22 topics, 18 chart types, and 7 tasks. Each chart data within this dataset includes four modalities: image, CSV, python code, and text description.
ChartX下载(ChartX Download)
Data Download
Please download the official ChartX Evaluation Set dataset and organize the downloaded files as follows:
ChartX
├── 3D-Bar
│   ├── code
|   ├── csv
|   ├── png
|   ├── txt
├── area_chart
│   ├── code
|   ├── csv
|   ├── png
|   ├── txt
....
....
├── rose
│   ├── code
|   ├── csv
|   ├── png
|   ├── txt
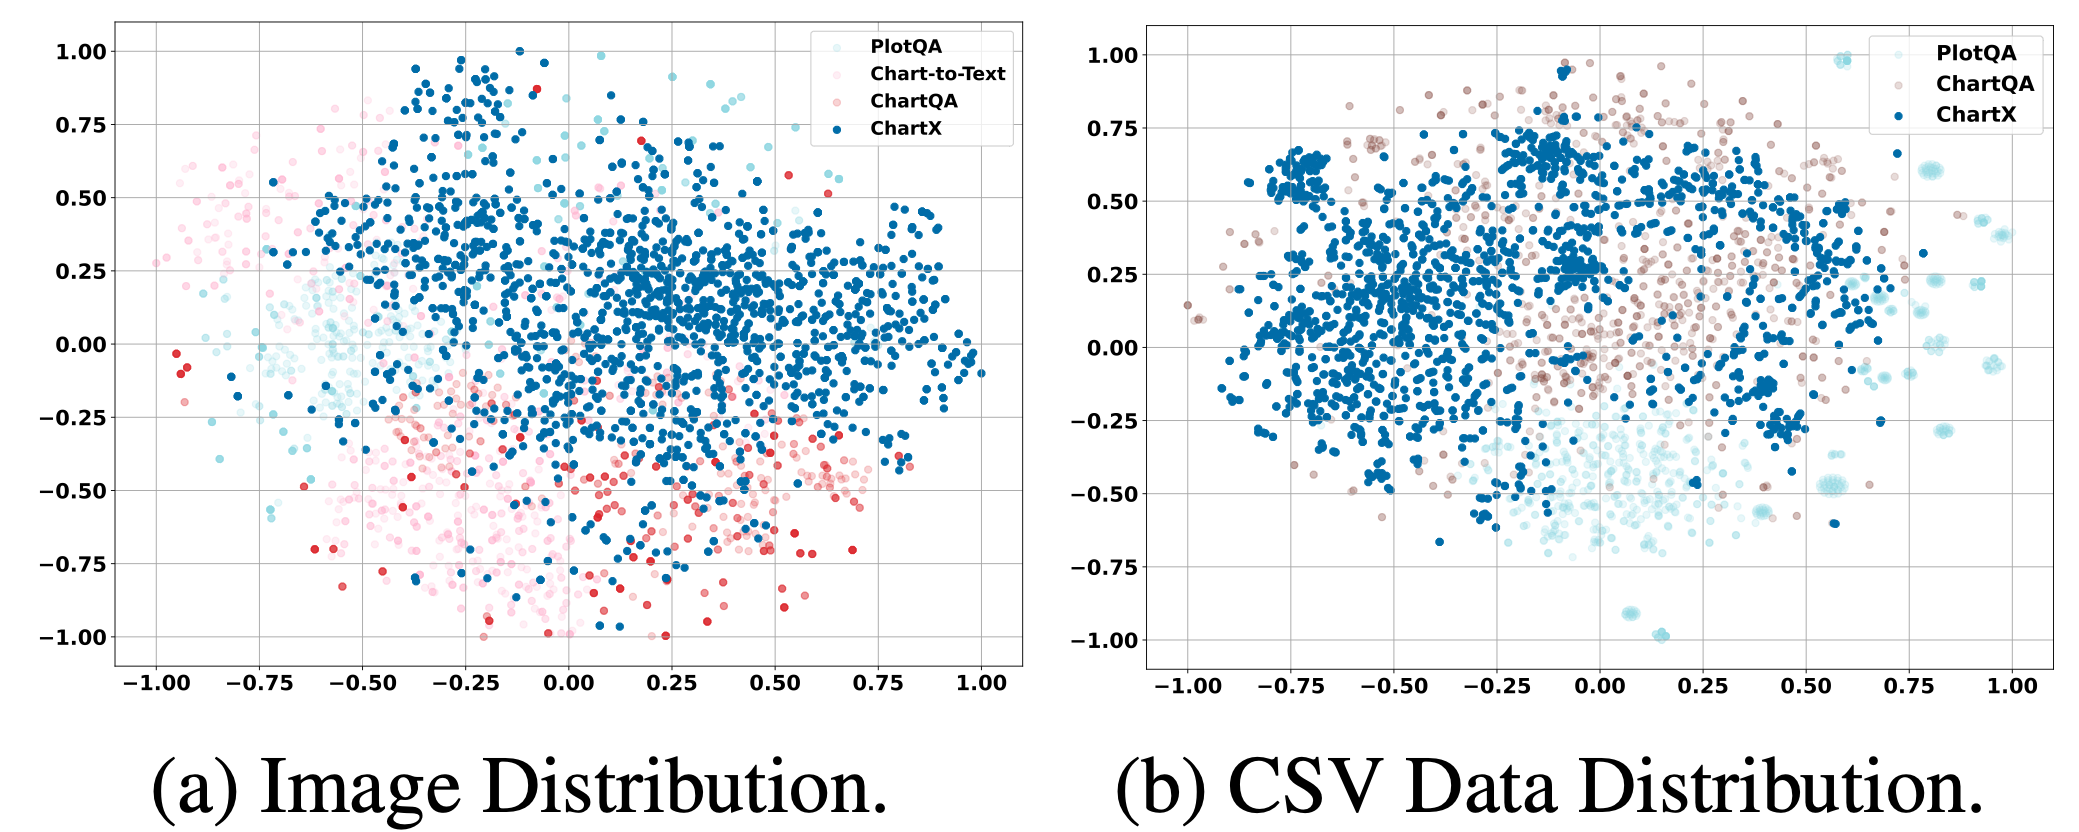
Visualization of Data Distribution
ChartVLM
ChartVLM介绍(ChartVLM Overall):
-
(1) 为了提升图表模型在认知复杂推理任何上的可解释性,ChartVLM首先需要执行图表感知任务(目的是将一个图表形式的图表数据映射到结构化文本描述空间),然后基于提取到的结构化文本描述来进行下游的复杂推理和认知任务。
-
(2) 为了在上述pipeline系统中实现用户可交互性,ChartVLM提出了指令适配器,其可以根据用户指令来让ChartVLM知道用户目前的任务倾向是基础感知任务还是下游认知推理任务,基于此来动态地进行网络路由。
-
(1) To enhance the interpretability of the chart model in cognition tasks (e.g. answer questions based on chart image), ChartVLM first performs the base perception task (e.g. structural extraction from the given chart image to a predicted CSV data), and then, finishes other cognition tasks (e.g. chart redrawing, description, summary, and QA) based on the extracted structural data.
-
(2) To choose the task that users expect to perform according to the prompts they used, the instruction adapter is designed, which can cover a variety of user instructions as illustrated in this figure

快速开始(Qiuckstart)
依赖项安装(Dependencies)
pip install torch==2.1.0 transformers==4.31.0 accelerate==0.24.1 sentencepiece==0.1.99 einops==0.6.1 triton==2.0.0
代码示例(example)
from tools.ChartVLM import infer_ChartVLM

if __name__ == '__main__':
    model = '${PATH_TO_PRETRAINED_MODEL}/ChartVLM/base/'  #${PATH_TO_PRETRAINED_MODEL}
    image = './base_decoder/train/data/test.png'
    text = 'who has the largest value?'

    output = infer_ChartVLM(image, text, model)

    print(output)


Similar repos





README
ChartX & ChartVLM
所提出的ChartX有两个主要贡献:
- (1) 为了全面评价目前多模态大模型在图表领域的能力,ChartX包含了多模态(图片,代码,CSV统计数据,文本描述),多任务(感知,图表信息提取,图表问答,图表描述,图表总结,图表重新渲染等),多学科(包含22个大类学科)的42K个高质量数据,并且我们验证了目前很多多模态大模型在ChartX评测集上的全面性能(包括,图表结构化信息提取,图表类别识别,图表转CSV Table,图表问答,图表洞察,图表重新渲染等任务)。
- (2) ChartVLM作为在图表领域定制化开发的大模型,其利用结构化提取后的图表数据信息来辅助复杂推理任务,极大增加了大模型在图表问答等复杂推理任务上的可解释性,利用Instruction Adapter来根据用户指令动态选择需要执行的任务以及对应的模型模块。
ChartX presents two primary contributions.
- (1) To comprehensively and rigorously benchmark the ability of the off-the-shelf MLLMs in chart domain, we construct an evaluation set covering multi-modal (image, code, csv, text description), multi-task, multi-disciplinary, high-quality chart data, and evaluate the performance of mainstream MLLMs.
- (2) We develop ChartVLM, offering a new perspective on handling the multi-modal tasks that strongly depend on interpretable patterns such as reasoning tasks in the field of chart or geometric images. To augment the model’s interpretability in cognition tasks in chart domain, ChartVLM incorporates the intermediate chart representations such as CSV data, chart title, chart type, etc.
评估集介绍(Overall of Evaluation Set)
我们构建了包含4.8万条高质量、多模态、22学科、18类别、7任务的图表数据。每个图表数据都包含4种模态:图像,CSV数据,绘图python代码,任务和图表问答描述
We collected 48K multi-modal chart data covering 22 topics, 18 chart types, and 7 tasks. Each chart data within this dataset includes four modalities: image, CSV, python code, and text description.
ChartX下载(ChartX Download)
Data Download
Please download the official ChartX Evaluation Set dataset and organize the downloaded files as follows:
ChartX
├── 3D-Bar
│   ├── code
|   ├── csv
|   ├── png
|   ├── txt
├── area_chart
│   ├── code
|   ├── csv
|   ├── png
|   ├── txt
....
....
├── rose
│   ├── code
|   ├── csv
|   ├── png
|   ├── txt
Visualization of Data Distribution
ChartVLM
ChartVLM介绍(ChartVLM Overall):
-
(1) 为了提升图表模型在认知复杂推理任何上的可解释性,ChartVLM首先需要执行图表感知任务(目的是将一个图表形式的图表数据映射到结构化文本描述空间),然后基于提取到的结构化文本描述来进行下游的复杂推理和认知任务。
-
(2) 为了在上述pipeline系统中实现用户可交互性,ChartVLM提出了指令适配器,其可以根据用户指令来让ChartVLM知道用户目前的任务倾向是基础感知任务还是下游认知推理任务,基于此来动态地进行网络路由。
-
(1) To enhance the interpretability of the chart model in cognition tasks (e.g. answer questions based on chart image), ChartVLM first performs the base perception task (e.g. structural extraction from the given chart image to a predicted CSV data), and then, finishes other cognition tasks (e.g. chart redrawing, description, summary, and QA) based on the extracted structural data.
-
(2) To choose the task that users expect to perform according to the prompts they used, the instruction adapter is designed, which can cover a variety of user instructions as illustrated in this figure
快速开始(Qiuckstart)
依赖项安装(Dependencies)
pip install torch==2.1.0 transformers==4.31.0 accelerate==0.24.1 sentencepiece==0.1.99 einops==0.6.1 triton==2.0.0
代码示例(example)
from tools.ChartVLM import infer_ChartVLM

if __name__ == '__main__':
    model = '${PATH_TO_PRETRAINED_MODEL}/ChartVLM/base/'  #${PATH_TO_PRETRAINED_MODEL}
    image = './base_decoder/train/data/test.png'
    text = 'who has the largest value?'

    output = infer_ChartVLM(image, text, model)

    print(output)