plotting in the terminal
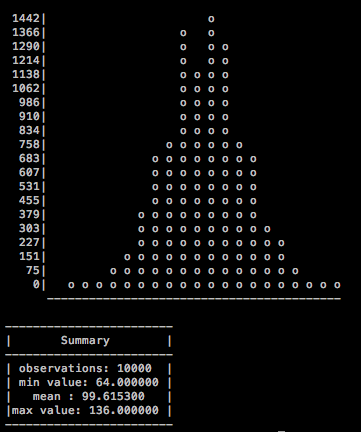
bashplotlib is a python package and command line tool for making basic plots in the terminal. It's a quick way to visualize data when you don't have a GUI. It's written in pure python and can quickly be installed anywhere using pip.
$ pip install bashplotlib
$ git clone git@github.com:glamp/bashplotlib.git
$ cd bashplotlib
$ python setup.py install
Either method will install the bashplotlib python package and will also add hist and scatter
to your python scripts folder. This folder should be on your path (add it if it's not).
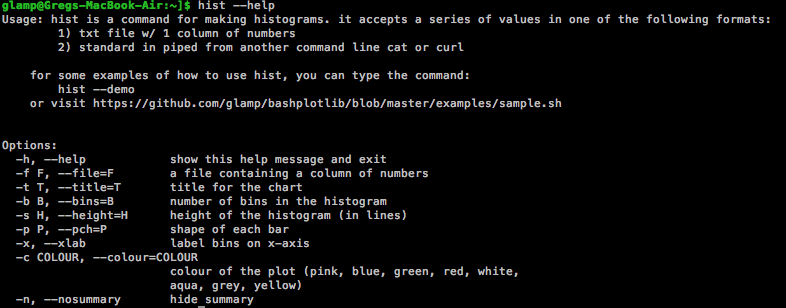
hist takes input from either stdin or specified using the -f parameter. Input should be a single column of numbers.
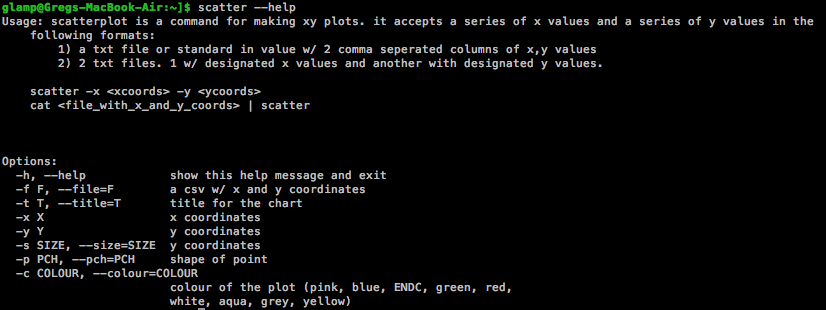
scatter takes x and y coordinates as input form either a comma delimited file using -f or from 2 different files using -x and -y.
If you want to use bashplotlib from python, just import histogram and scatterplot.
from bashplotlib.scatterplot import plot_scatter
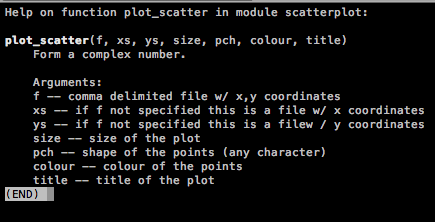
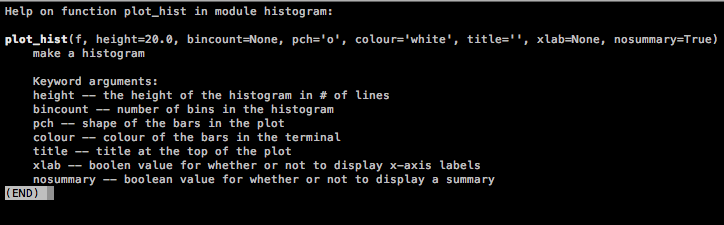
from bashplotlib.histogram import plot_hist
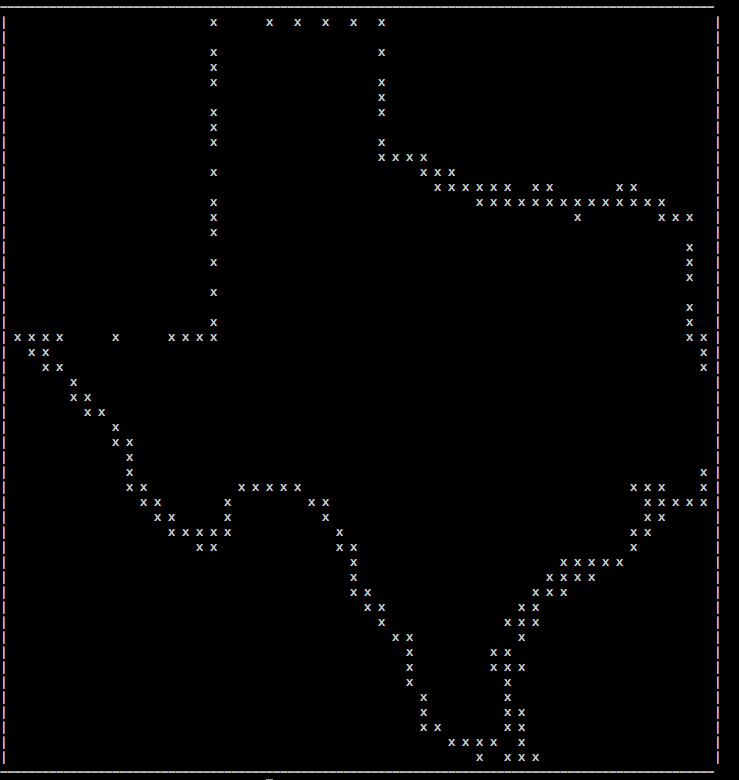
$ scatter --file data/texas.txt --pch .
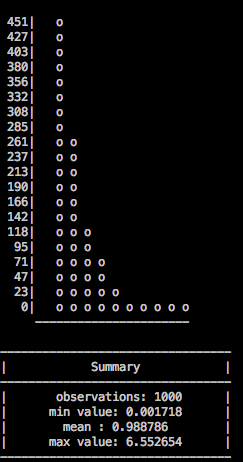
$ hist --file data/exp.txt
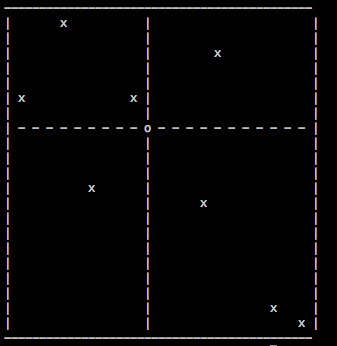
$ scatter -x data/x_test.txt -y data/y_test.txt
Overall
Maintained
Code review
PyPI
Latest release
Releases this year
4,064 followers · starred Apr 2024
1,228 followers · starred Oct 2016
2,964 followers · starred Mar 2020
59 followers · starred Nov 2017
plotting in the terminal
bashplotlib is a python package and command line tool for making basic plots in the terminal. It's a quick way to visualize data when you don't have a GUI. It's written in pure python and can quickly be installed anywhere using pip.
$ pip install bashplotlib
$ git clone git@github.com:glamp/bashplotlib.git
$ cd bashplotlib
$ python setup.py install
Either method will install the bashplotlib python package and will also add hist and scatter
to your python scripts folder. This folder should be on your path (add it if it's not).
hist takes input from either stdin or specified using the -f parameter. Input should be a single column of numbers.
scatter takes x and y coordinates as input form either a comma delimited file using -f or from 2 different files using -x and -y.
If you want to use bashplotlib from python, just import histogram and scatterplot.
from bashplotlib.scatterplot import plot_scatter
from bashplotlib.histogram import plot_hist
$ scatter --file data/texas.txt --pch .
$ hist --file data/exp.txt
$ scatter -x data/x_test.txt -y data/y_test.txt
Overall
Maintained
Code review
PyPI
Latest release
Releases this year
4,064 followers · starred Apr 2024
1,228 followers · starred Oct 2016
2,964 followers · starred Mar 2020
59 followers · starred Nov 2017



