
SVG flight instruments for React
See the codeSee what people are saying
README
flight-indicators

Live demo: every instrument running on simulated flight data, with sliders to drive them by hand.
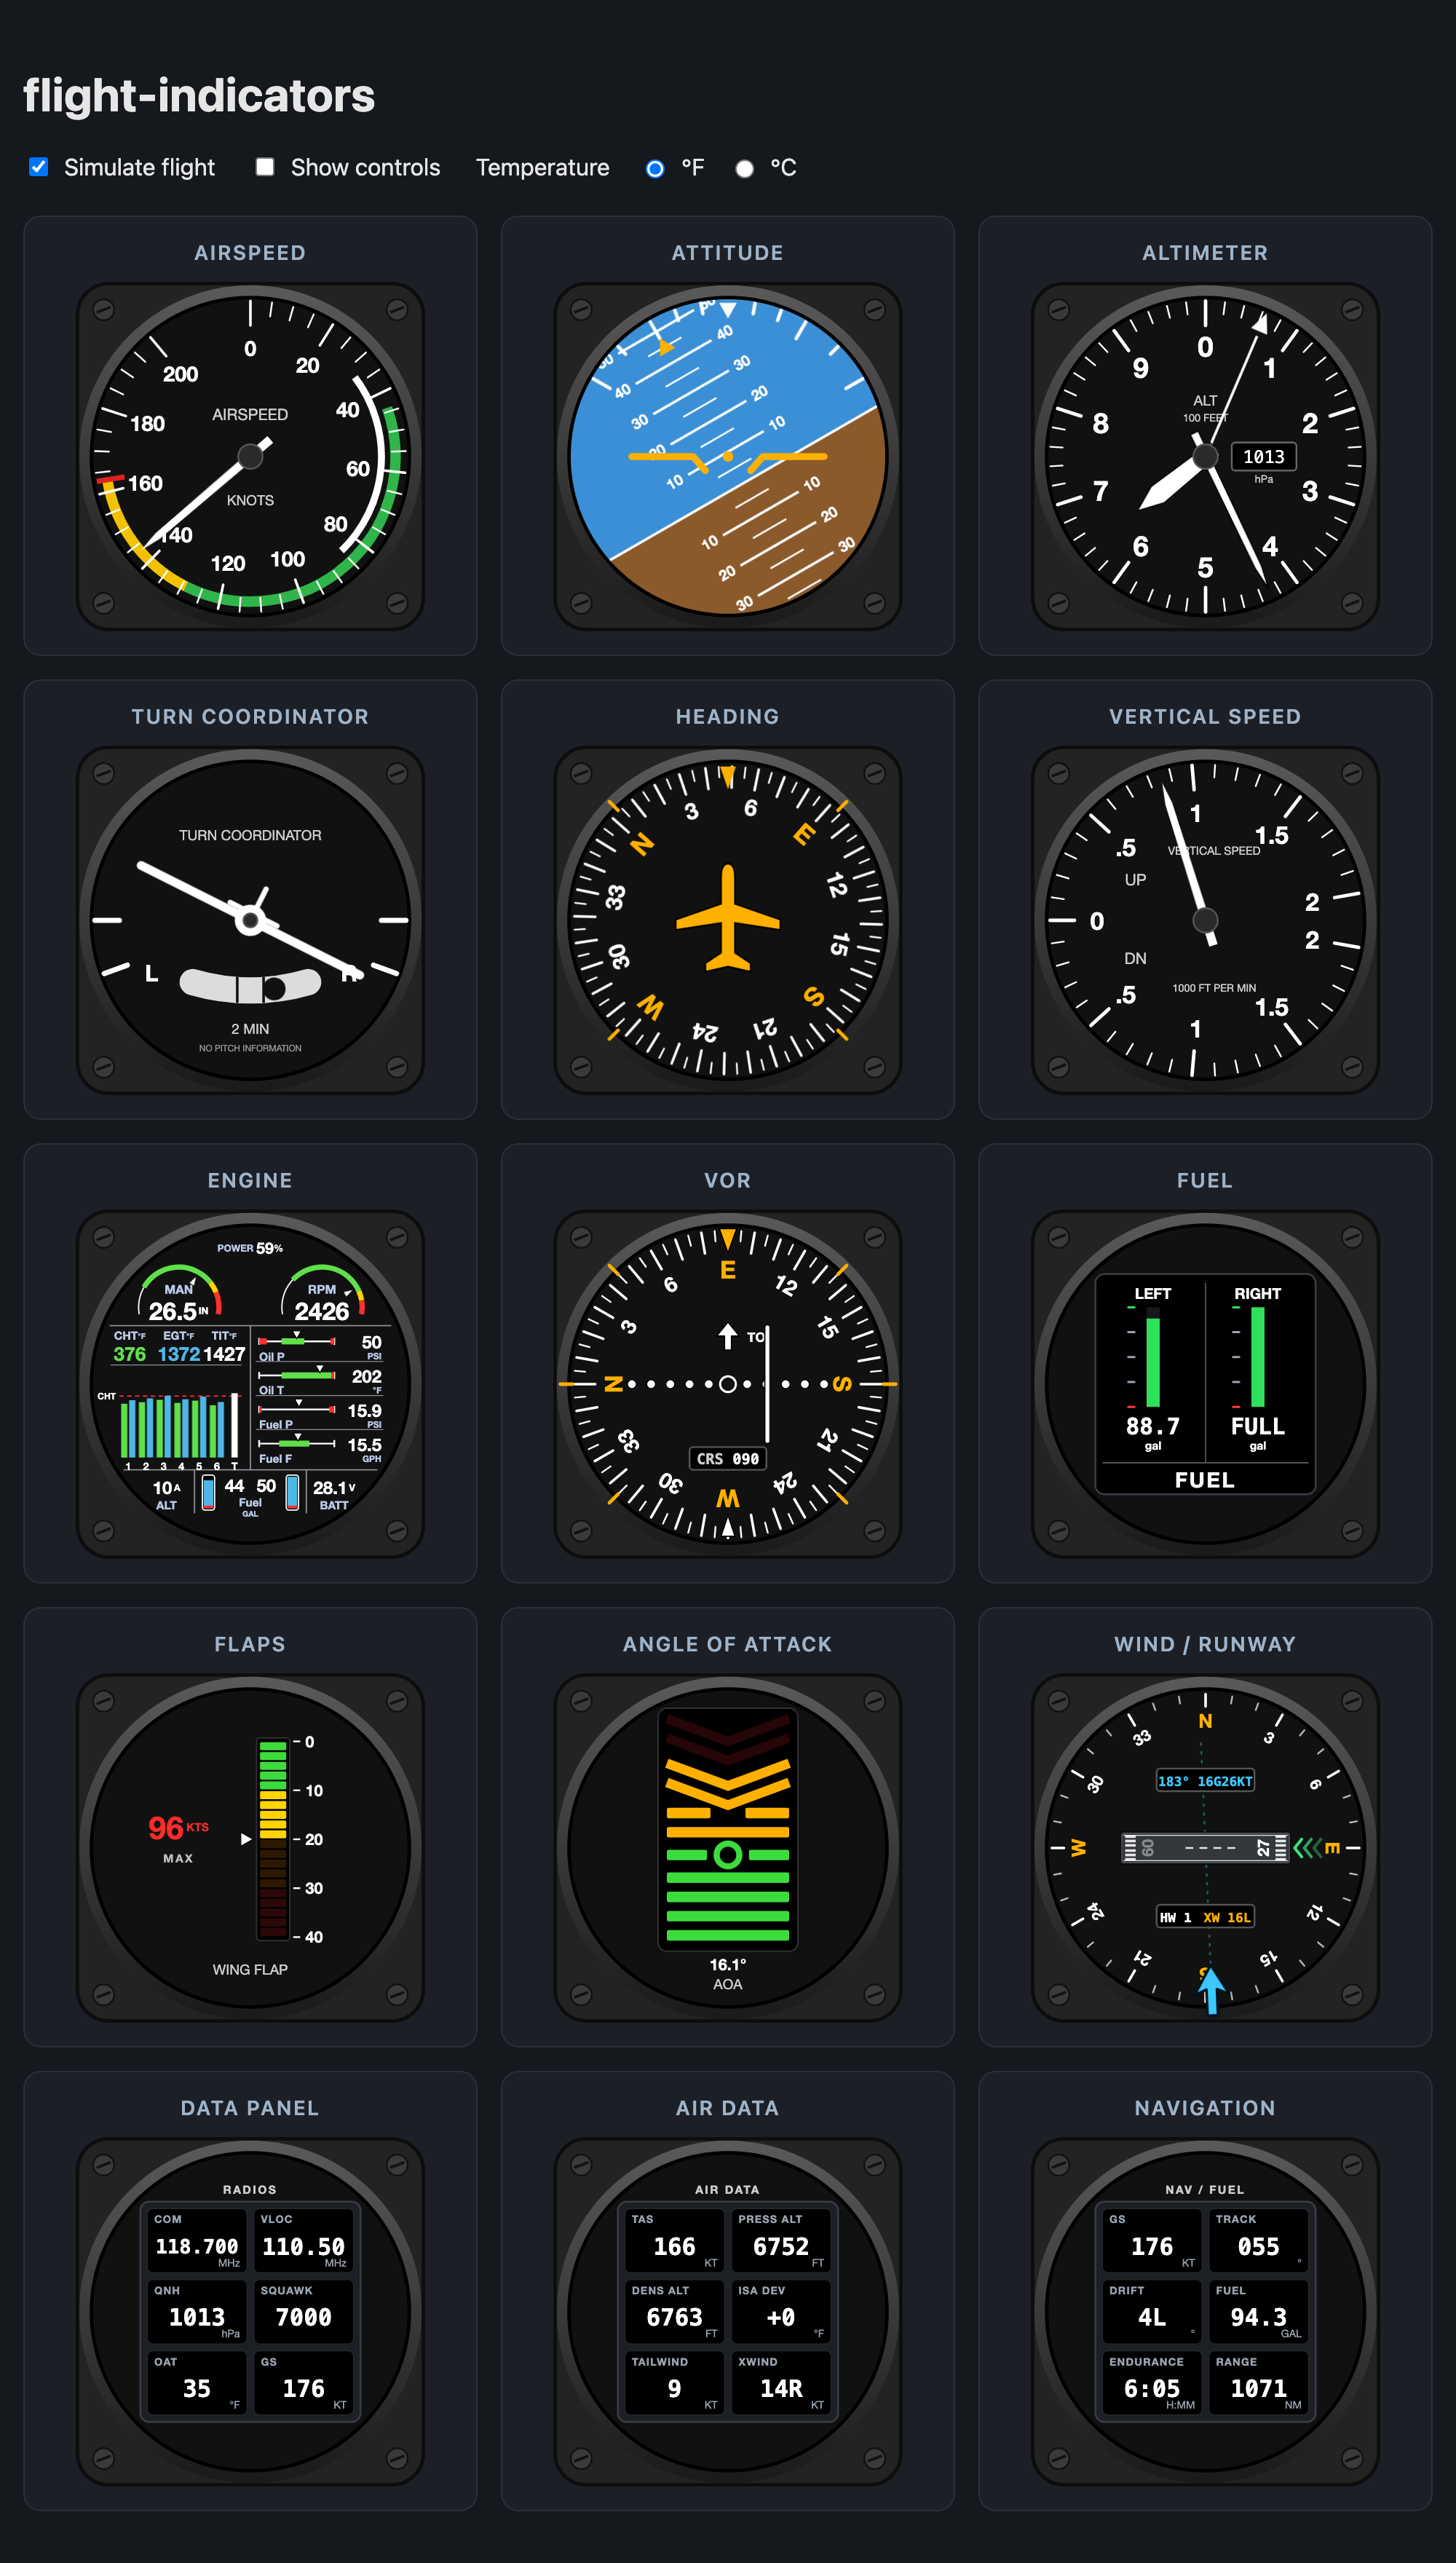
Modern SVG flight instruments for React, with no runtime dependencies.
- Thirteen instruments: Attitude, Heading, Airspeed, Altimeter, Vertical speed, Turn coordinator, VOR / CDI, Wind / runway, Fuel, Flaps, Angle of attack, Engine monitor and a custom Data panel for any readouts you like
- Pure SVG with no image files, so instruments stay sharp at any size and work with any bundler
- Written in TypeScript and ships its type declarations
- Ships ESM and CommonJS builds, works with server-side rendering, and is marked
"use client"for the Next.js App Router - Smooth CSS animation; the heading and roll take the shortest way round (359° → 1° moves 2°, not 358°)
- Bad input (
NaN,undefined, out of range) is clamped instead of breaking the drawing - Accessible: each instrument is an
role="img"with a live text label (e.g. "Altimeter: 12340 feet, 29.92 inHg")
Install
npm i flight-indicators
Requires React 18 or newer.
Usage
import {
  AttitudeIndicator,
  HeadingIndicator,
  Airspeed,
  Altimeter,
  VerticalSpeed,
  TurnCoordinator,
  VorIndicator,
  WindIndicator,
  FuelIndicator,
  FlapIndicator,
  AoaIndicator,
  EngineIndicator,
  DataPanel,
} from 'flight-indicators';

export function Panel({ data }) {
  return (
    <div style={{ display: 'flex', flexWrap: 'wrap', gap: 12 }}>
      <Airspeed speed={data.ias} />
      <AttitudeIndicator roll={data.roll} pitch={data.pitch} />
      <Altimeter altitude={data.altitude} pressure={1013} />
      <TurnCoordinator turnRate={data.turnRate} slip={data.slip} />
      <HeadingIndicator heading={data.heading} />
      <VerticalSpeed verticalSpeed={data.vs} />
      <WindIndicator runway={90} windDirection={data.windDir} windSpeed={data.windSpeed} />
      <VorIndicator course={data.obs} radial={data.navRadial} />
      <FuelIndicator capacity={26} tanks={[{ name: 'Left', quantity: data.fuelL }, { name: 'Right', quantity: data.fuelR }]} />
      <FlapIndicator flaps={data.flaps} airspeed={data.ias} speedLimits={[{ flaps: 0, speed: 160 }, { flaps: 10, speed: 110 }]} />
      <EngineIndicator manifold={{ value: data.map }} rpm={{ value: data.rpm }} cht={data.cht} egt={data.egt} fuelLeft={data.fuelL} fuelRight={data.fuelR} />
      <DataPanel
        heading="Radios"
        fields={[
          { name: 'OAT', value: data.oat, unit: '°C' },
          { name: 'VLOC', value: data.nav1, unit: 'MHz', decimals: 2 },
          { name: 'COM', value: data.com1, unit: 'MHz', decimals: 3 },
          { name: 'Squawk', value: data.squawk },
        ]}
      />
    </div>
  );
}
Common props
Every instrument accepts these props:
| Prop | Type | Default | Description |
|---|---|---|---|
size | number | string | 200 | Width and height. A number means pixels; a string can be any CSS length, e.g. "100%". |
showBox | boolean | true | Draw the square mounting plate with screws. |
animationDuration | number | 300 | Animation time in ms. 0 turns animation off. |
className | string | Class for the root <svg>. | |
style | CSSProperties | Inline style for the root <svg>. | |
title | string | Overrides the automatic accessible label. |
Instruments
<AttitudeIndicator />
| Prop | Type | Default | Description |
|---|---|---|---|
roll | number | 0 | Bank angle in degrees. Positive means right wing down. |
pitch | number | 0 | Pitch angle in degrees. Positive means nose up. |
pitchLimit | number | 40 | Largest pitch the display shows, in degrees. |
<HeadingIndicator />
| Prop | Type | Default | Description |
|---|---|---|---|
heading | number | 0 | Heading in degrees. Any value is accepted and wrapped to 0–359. |
<Airspeed />
| Prop | Type | Default | Description |
|---|---|---|---|
speed | number | 0 | Indicated airspeed. Clamped to 0…max. |
max | number | 200 | Top of the scale. |
arcs | AirspeedArcs | similar to a Cessna 172 | { white?: [min, max], green?: [min, max], yellow?: [min, max], red?: vne }. Pass {} to hide all arcs. |
unit | string | "KNOTS" | Unit text printed on the dial. |
<Altimeter />
| Prop | Type | Default | Description |
|---|---|---|---|
altitude | number | 0 | Altitude in feet. Negative values work. |
pressure | number | 1013 / 29.92 | Altimeter setting shown in the pressure (Kollsman) window. |
pressureUnit | "hPa" | "inHg" | "hPa" | Unit of pressure. |
<VerticalSpeed />
| Prop | Type | Default | Description |
|---|---|---|---|
verticalSpeed | number | 0 | Vertical speed in ft/min. Positive means climbing. |
max | number | 2000 | Full-scale value in ft/min. |
<TurnCoordinator />
| Prop | Type | Default | Description |
|---|---|---|---|
turnRate | number | 0 | Rate of turn in °/s. Positive means a right turn. At 3 °/s (a standard-rate turn) the wings line up with the L/R marks. |
slip | number | 0 | Position of the slip ball, from -1 (full left) to 1 (full right). |
<WindIndicator />
A north-up compass rose with the runway drawn to scale on its heading and the wind arrow on the rim. The runway end facing into the wind is the one in use: its number is lit and green chevrons mark the approach. Two windows show the wind (134° 12G20KT, or CALM) and the headwind and crosswind for the runway in use (HW 8 XW 9R).
| Prop | Type | Default | Description |
|---|---|---|---|
runway | number | 0 | Runway heading in degrees, either end (90 means runway 09/27). |
runwaySide | "L" | "C" | "R" | Parallel-runway letter for the runway end. The other end gets the mirrored letter. | |
windDirection | number | 0 | Direction the wind blows from, in degrees. |
windSpeed | number | 0 | Wind speed in knots. Under 1 kt shows as calm. |
windGust | number | Gust speed in knots. Shown when higher than windSpeed. | |
crosswindLimit | number | 15 | Crosswind in knots (gusts included) above which the crosswind turns amber. |
<VorIndicator />
A VOR / course deviation indicator with an OBS card. The card turns so the selected course sits under the top index, the needle shows how far the course line is to the left or right (5 dots each side, 2° per dot, ±10° full scale) and a triangle points TO or FROM the station. Give it the selected course and the radial the aircraft is on, and it works out the deflection and the TO/FROM flag. Alternatively pass deviation and toFrom straight from your avionics data.
| Prop | Type | Default | Description |
|---|---|---|---|
course | number | 0 | Selected course (OBS) in degrees. |
radial | number | Radial from the station the aircraft is on, in degrees. Drives the needle and the TO/FROM flag. | |
deviation | number | Course deviation in degrees, positive when the course is to the right. Clamped to ±10. Overrides radial. | |
toFrom | "TO" | "FROM" | "OFF" | TO/FROM flag. Overrides radial. "OFF" hides both triangles. | |
signal | boolean | true | false shows the red NAV flag, centres the needle and hides TO/FROM. |
vorDeviation(course, radial) is exported too and returns { deviation, toFrom } if you want the same maths without the drawing.
<FuelIndicator />
A digital fuel quantity gauge: one vertical bar graph per tank with a numeric readout underneath, FULL when a tank is at capacity, and red when it drops to the low threshold.
| Prop | Type | Default | Description |
|---|---|---|---|
tanks | FuelTank[] | Left and Right, empty | Tanks shown left to right, each { name, quantity, capacity? }. Up to four. |
capacity | number | 50 | Full-tank quantity for tanks that don't set their own. |
unit | string | "gal" | Unit printed under each readout. |
low | number | 10% of capacity | Quantity at or below which a tank turns red. |
decimals | number | 1 | Decimal places in the readouts. |
label | string | "FUEL" | Caption along the bottom of the display. |
<FlapIndicator />
A wing flap position indicator: a vertical LED bar graph that fills from the top as the flaps extend, green at the top through yellow and orange to red at full deflection, with a degree scale beside it and a pointer at the exact position. Optionally shows the maximum flap extension speed for the current setting, which turns red when airspeed exceeds it.
| Prop | Type | Default | Description |
|---|---|---|---|
flaps | number | 0 | Flap position in degrees. Clamped to 0…max. |
max | number | 40 | Full flap deflection in degrees. |
detents | number[] | every 10° | Scale labels in degrees. |
segments | number | 20 | Number of LED segments in the bar. |
speedLimits | FlapSpeedLimit[] | { flaps, speed } pairs in knots: the max speed once flaps are at or beyond flaps. The highest reached entry is shown. Omit to hide the readout. | |
airspeed | number | Current airspeed in knots, used to flag an overspeed. | |
showMph | boolean | true | Also print the limit in mph. |
label | string | "WING FLAP" | Caption at the bottom of the dial. |
<AoaIndicator />
An angle of attack indicator modelled on panel-mount LED AoA displays. Eleven rows light from the bottom up as the AoA rises: four green bars, a green donut at the optimum AoA, an amber bar, an amber split bar, two amber chevrons and two red chevrons pointing down ("lower the nose"). Rows below the donut are spaced evenly from min to optimum, rows above it from optimum to max. At max every row is lit and the chevrons flash.
| Prop | Type | Default | Description |
|---|---|---|---|
aoa | number | 0 | Current angle of attack in degrees. |
min | number | 0 | AoA at which the bottom bar lights. |
optimum | number | halfway to max | AoA at which the green donut lights (approach / L/Dmax). |
max | number | 20 | Critical AoA: all rows lit and the chevrons flash. |
showValue | boolean | false | Print the AoA in degrees under the display. |
label | string | "AOA" | Caption at the bottom of the dial. |
<EngineIndicator />
An all-in-one engine monitor in the style of a JPI EDM. The top holds a percent-power readout and two arc gauges for manifold pressure and RPM. The left half shows the hottest CHT, EGT and TIT with a per-cylinder bar graph (green CHT, blue EGT, white TIT) and a dashed red CHT limit line. The right half has up to four horizontal bar gauges, and the bottom row shows alternator amps, the two fuel tanks and bus volts. Sections you pass no data for are left blank.
Scaled gauges share one shape, EngineGauge: { value, min, max, green?, yellow?, low?, high?, unit?, decimals? }. green and yellow are [from, to] bands; low and high are red limits. A readout turns yellow inside the yellow band and red at or beyond a red limit.
| Prop | Type | Default | Description |
|---|---|---|---|
power | number | Percent power printed at the top. | |
manifold | EngineGauge | 10–35 inHg | Manifold pressure arc. Only value is needed to use the default scale. |
rpm | EngineGauge | 0–3000 | Engine speed arc. |
cht | number[] | [] | CHT per cylinder, up to six. |
egt | number[] | [] | EGT per cylinder, up to six. |
tit | number | Turbine inlet temperature, drawn as the T column. | |
chtLimit | number | 400 | CHT at which the dashed red line is drawn. |
chtScale | number | 500 | CHT that fills a bar to the top. |
egtScale | number | 1700 | EGT or TIT that fills a bar to the top. |
temperatureUnit | string | "°F" | Printed after the CHT/EGT/TIT headings. |
gauges | EngineBarGauge[] | oil P, oil T, fuel P, fuel F | Horizontal bar gauges, each an EngineGauge plus a label. Up to four. |
amps | number | Alternator current. | |
volts | number | Bus voltage, shown with one decimal. | |
fuelLeft | number | Left tank quantity. | |
fuelRight | number | Right tank quantity. | |
fuelCapacity | number | 30 | Full quantity of each tank, used to fill the tank icons. |
fuelUnit | string | "GAL" | Printed under the fuel quantities. |
<DataPanel />
A general-purpose instrument for readouts that have no dedicated gauge: temperatures, radio frequencies, transponder code, fuel, timers, anything. It draws a square panel inside the usual round bezel and fills it with a grid of up to six cells. Each cell shows a name, a value and an optional unit. One or two fields stack vertically; three or more use two columns. Long values shrink to fit.
| Prop | Type | Default | Description |
|---|---|---|---|
fields | DataField[] | [] | Readouts to show. Only the first six are drawn. |
heading | string | Caption printed above the panel, also used in the accessible label. |
Each DataField:
| Field | Type | Default | Description |
|---|---|---|---|
name | string | Caption above the value, e.g. "COM1". | |
value | string | number | Strings are printed as given. Numbers are formatted with decimals; NaN shows as ---. | |
unit | string | Printed in the corner of the cell, e.g. "MHz". | |
decimals | number | 0 | Decimal places for numeric values. |
color | string | white | Colour of the value text, e.g. amber for a caution. |
Development
npm install
npm run dev         # interactive playground (Vite) at http://localhost:5173
npm run build:demo  # static build of the playground in demo-dist/
npm run deploy:demo # build and deploy the playground to harvis.dev (the live demo)
npm test            # unit tests (Vitest)
npm run typecheck
npm run build       # outputs dist/ (ESM + CJS + .d.ts)
Releasing
Releases run from GitHub Actions:
- CI (
ci.yml) runs on every push and pull request. It typechecks, tests and builds on Node 22 and 24, then installs the packed tarball on Node 18, 20 and 22 and checks that every component renders. - Release (
release.yml) is started by hand from the Actions tab, where you choosepatch,minorormajor. It bumps the version, commits, tags, creates a GitHub release and then triggers Publish. - Publish (
publish.yml) publishes to npm with provenance using trusted publishing, so no npm token is stored. It skips versions that are already on npm, so it is safe to re-run.
One-time setup:
- Publish the first version by hand (
npm login && npm publish), because npm can only set a trusted publisher on a package that already exists. - On npmjs.com, open the package's Settings, then Trusted publishing, and add GitHub Actions with this repository and the workflow file
publish.yml.
License
MIT
Similar repos


SVG flight instruments for React
See the codeSee what people are saying
README
flight-indicators
Live demo: every instrument running on simulated flight data, with sliders to drive them by hand.
Modern SVG flight instruments for React, with no runtime dependencies.
- Thirteen instruments: Attitude, Heading, Airspeed, Altimeter, Vertical speed, Turn coordinator, VOR / CDI, Wind / runway, Fuel, Flaps, Angle of attack, Engine monitor and a custom Data panel for any readouts you like
- Pure SVG with no image files, so instruments stay sharp at any size and work with any bundler
- Written in TypeScript and ships its type declarations
- Ships ESM and CommonJS builds, works with server-side rendering, and is marked
"use client"for the Next.js App Router - Smooth CSS animation; the heading and roll take the shortest way round (359° → 1° moves 2°, not 358°)
- Bad input (
NaN,undefined, out of range) is clamped instead of breaking the drawing - Accessible: each instrument is an
role="img"with a live text label (e.g. "Altimeter: 12340 feet, 29.92 inHg")
Install
npm i flight-indicators
Requires React 18 or newer.
Usage
import {
  AttitudeIndicator,
  HeadingIndicator,
  Airspeed,
  Altimeter,
  VerticalSpeed,
  TurnCoordinator,
  VorIndicator,
  WindIndicator,
  FuelIndicator,
  FlapIndicator,
  AoaIndicator,
  EngineIndicator,
  DataPanel,
} from 'flight-indicators';

export function Panel({ data }) {
  return (
    <div style={{ display: 'flex', flexWrap: 'wrap', gap: 12 }}>
      <Airspeed speed={data.ias} />
      <AttitudeIndicator roll={data.roll} pitch={data.pitch} />
      <Altimeter altitude={data.altitude} pressure={1013} />
      <TurnCoordinator turnRate={data.turnRate} slip={data.slip} />
      <HeadingIndicator heading={data.heading} />
      <VerticalSpeed verticalSpeed={data.vs} />
      <WindIndicator runway={90} windDirection={data.windDir} windSpeed={data.windSpeed} />
      <VorIndicator course={data.obs} radial={data.navRadial} />
      <FuelIndicator capacity={26} tanks={[{ name: 'Left', quantity: data.fuelL }, { name: 'Right', quantity: data.fuelR }]} />
      <FlapIndicator flaps={data.flaps} airspeed={data.ias} speedLimits={[{ flaps: 0, speed: 160 }, { flaps: 10, speed: 110 }]} />
      <EngineIndicator manifold={{ value: data.map }} rpm={{ value: data.rpm }} cht={data.cht} egt={data.egt} fuelLeft={data.fuelL} fuelRight={data.fuelR} />
      <DataPanel
        heading="Radios"
        fields={[
          { name: 'OAT', value: data.oat, unit: '°C' },
          { name: 'VLOC', value: data.nav1, unit: 'MHz', decimals: 2 },
          { name: 'COM', value: data.com1, unit: 'MHz', decimals: 3 },
          { name: 'Squawk', value: data.squawk },
        ]}
      />
    </div>
  );
}
Common props
Every instrument accepts these props:
| Prop | Type | Default | Description |
|---|---|---|---|
size | number | string | 200 | Width and height. A number means pixels; a string can be any CSS length, e.g. "100%". |
showBox | boolean | true | Draw the square mounting plate with screws. |
animationDuration | number | 300 | Animation time in ms. 0 turns animation off. |
className | string | Class for the root <svg>. | |
style | CSSProperties | Inline style for the root <svg>. | |
title | string | Overrides the automatic accessible label. |
Instruments
<AttitudeIndicator />
| Prop | Type | Default | Description |
|---|---|---|---|
roll | number | 0 | Bank angle in degrees. Positive means right wing down. |
pitch | number | 0 | Pitch angle in degrees. Positive means nose up. |
pitchLimit | number | 40 | Largest pitch the display shows, in degrees. |
<HeadingIndicator />
| Prop | Type | Default | Description |
|---|---|---|---|
heading | number | 0 | Heading in degrees. Any value is accepted and wrapped to 0–359. |
<Airspeed />
| Prop | Type | Default | Description |
|---|---|---|---|
speed | number | 0 | Indicated airspeed. Clamped to 0…max. |
max | number | 200 | Top of the scale. |
arcs | AirspeedArcs | similar to a Cessna 172 | { white?: [min, max], green?: [min, max], yellow?: [min, max], red?: vne }. Pass {} to hide all arcs. |
unit | string | "KNOTS" | Unit text printed on the dial. |
<Altimeter />
| Prop | Type | Default | Description |
|---|---|---|---|
altitude | number | 0 | Altitude in feet. Negative values work. |
pressure | number | 1013 / 29.92 | Altimeter setting shown in the pressure (Kollsman) window. |
pressureUnit | "hPa" | "inHg" | "hPa" | Unit of pressure. |
<VerticalSpeed />
| Prop | Type | Default | Description |
|---|---|---|---|
verticalSpeed | number | 0 | Vertical speed in ft/min. Positive means climbing. |
max | number | 2000 | Full-scale value in ft/min. |
<TurnCoordinator />
| Prop | Type | Default | Description |
|---|---|---|---|
turnRate | number | 0 | Rate of turn in °/s. Positive means a right turn. At 3 °/s (a standard-rate turn) the wings line up with the L/R marks. |
slip | number | 0 | Position of the slip ball, from -1 (full left) to 1 (full right). |
<WindIndicator />
A north-up compass rose with the runway drawn to scale on its heading and the wind arrow on the rim. The runway end facing into the wind is the one in use: its number is lit and green chevrons mark the approach. Two windows show the wind (134° 12G20KT, or CALM) and the headwind and crosswind for the runway in use (HW 8 XW 9R).
| Prop | Type | Default | Description |
|---|---|---|---|
runway | number | 0 | Runway heading in degrees, either end (90 means runway 09/27). |
runwaySide | "L" | "C" | "R" | Parallel-runway letter for the runway end. The other end gets the mirrored letter. | |
windDirection | number | 0 | Direction the wind blows from, in degrees. |
windSpeed | number | 0 | Wind speed in knots. Under 1 kt shows as calm. |
windGust | number | Gust speed in knots. Shown when higher than windSpeed. | |
crosswindLimit | number | 15 | Crosswind in knots (gusts included) above which the crosswind turns amber. |
<VorIndicator />
A VOR / course deviation indicator with an OBS card. The card turns so the selected course sits under the top index, the needle shows how far the course line is to the left or right (5 dots each side, 2° per dot, ±10° full scale) and a triangle points TO or FROM the station. Give it the selected course and the radial the aircraft is on, and it works out the deflection and the TO/FROM flag. Alternatively pass deviation and toFrom straight from your avionics data.
| Prop | Type | Default | Description |
|---|---|---|---|
course | number | 0 | Selected course (OBS) in degrees. |
radial | number | Radial from the station the aircraft is on, in degrees. Drives the needle and the TO/FROM flag. | |
deviation | number | Course deviation in degrees, positive when the course is to the right. Clamped to ±10. Overrides radial. | |
toFrom | "TO" | "FROM" | "OFF" | TO/FROM flag. Overrides radial. "OFF" hides both triangles. | |
signal | boolean | true | false shows the red NAV flag, centres the needle and hides TO/FROM. |
vorDeviation(course, radial) is exported too and returns { deviation, toFrom } if you want the same maths without the drawing.
<FuelIndicator />
A digital fuel quantity gauge: one vertical bar graph per tank with a numeric readout underneath, FULL when a tank is at capacity, and red when it drops to the low threshold.
| Prop | Type | Default | Description |
|---|---|---|---|
tanks | FuelTank[] | Left and Right, empty | Tanks shown left to right, each { name, quantity, capacity? }. Up to four. |
capacity | number | 50 | Full-tank quantity for tanks that don't set their own. |
unit | string | "gal" | Unit printed under each readout. |
low | number | 10% of capacity | Quantity at or below which a tank turns red. |
decimals | number | 1 | Decimal places in the readouts. |
label | string | "FUEL" | Caption along the bottom of the display. |
<FlapIndicator />
A wing flap position indicator: a vertical LED bar graph that fills from the top as the flaps extend, green at the top through yellow and orange to red at full deflection, with a degree scale beside it and a pointer at the exact position. Optionally shows the maximum flap extension speed for the current setting, which turns red when airspeed exceeds it.
| Prop | Type | Default | Description |
|---|---|---|---|
flaps | number | 0 | Flap position in degrees. Clamped to 0…max. |
max | number | 40 | Full flap deflection in degrees. |
detents | number[] | every 10° | Scale labels in degrees. |
segments | number | 20 | Number of LED segments in the bar. |
speedLimits | FlapSpeedLimit[] | { flaps, speed } pairs in knots: the max speed once flaps are at or beyond flaps. The highest reached entry is shown. Omit to hide the readout. | |
airspeed | number | Current airspeed in knots, used to flag an overspeed. | |
showMph | boolean | true | Also print the limit in mph. |
label | string | "WING FLAP" | Caption at the bottom of the dial. |
<AoaIndicator />
An angle of attack indicator modelled on panel-mount LED AoA displays. Eleven rows light from the bottom up as the AoA rises: four green bars, a green donut at the optimum AoA, an amber bar, an amber split bar, two amber chevrons and two red chevrons pointing down ("lower the nose"). Rows below the donut are spaced evenly from min to optimum, rows above it from optimum to max. At max every row is lit and the chevrons flash.
| Prop | Type | Default | Description |
|---|---|---|---|
aoa | number | 0 | Current angle of attack in degrees. |
min | number | 0 | AoA at which the bottom bar lights. |
optimum | number | halfway to max | AoA at which the green donut lights (approach / L/Dmax). |
max | number | 20 | Critical AoA: all rows lit and the chevrons flash. |
showValue | boolean | false | Print the AoA in degrees under the display. |
label | string | "AOA" | Caption at the bottom of the dial. |
<EngineIndicator />
An all-in-one engine monitor in the style of a JPI EDM. The top holds a percent-power readout and two arc gauges for manifold pressure and RPM. The left half shows the hottest CHT, EGT and TIT with a per-cylinder bar graph (green CHT, blue EGT, white TIT) and a dashed red CHT limit line. The right half has up to four horizontal bar gauges, and the bottom row shows alternator amps, the two fuel tanks and bus volts. Sections you pass no data for are left blank.
Scaled gauges share one shape, EngineGauge: { value, min, max, green?, yellow?, low?, high?, unit?, decimals? }. green and yellow are [from, to] bands; low and high are red limits. A readout turns yellow inside the yellow band and red at or beyond a red limit.
| Prop | Type | Default | Description |
|---|---|---|---|
power | number | Percent power printed at the top. | |
manifold | EngineGauge | 10–35 inHg | Manifold pressure arc. Only value is needed to use the default scale. |
rpm | EngineGauge | 0–3000 | Engine speed arc. |
cht | number[] | [] | CHT per cylinder, up to six. |
egt | number[] | [] | EGT per cylinder, up to six. |
tit | number | Turbine inlet temperature, drawn as the T column. | |
chtLimit | number | 400 | CHT at which the dashed red line is drawn. |
chtScale | number | 500 | CHT that fills a bar to the top. |
egtScale | number | 1700 | EGT or TIT that fills a bar to the top. |
temperatureUnit | string | "°F" | Printed after the CHT/EGT/TIT headings. |
gauges | EngineBarGauge[] | oil P, oil T, fuel P, fuel F | Horizontal bar gauges, each an EngineGauge plus a label. Up to four. |
amps | number | Alternator current. | |
volts | number | Bus voltage, shown with one decimal. | |
fuelLeft | number | Left tank quantity. | |
fuelRight | number | Right tank quantity. | |
fuelCapacity | number | 30 | Full quantity of each tank, used to fill the tank icons. |
fuelUnit | string | "GAL" | Printed under the fuel quantities. |
<DataPanel />
A general-purpose instrument for readouts that have no dedicated gauge: temperatures, radio frequencies, transponder code, fuel, timers, anything. It draws a square panel inside the usual round bezel and fills it with a grid of up to six cells. Each cell shows a name, a value and an optional unit. One or two fields stack vertically; three or more use two columns. Long values shrink to fit.
| Prop | Type | Default | Description |
|---|---|---|---|
fields | DataField[] | [] | Readouts to show. Only the first six are drawn. |
heading | string | Caption printed above the panel, also used in the accessible label. |
Each DataField:
| Field | Type | Default | Description |
|---|---|---|---|
name | string | Caption above the value, e.g. "COM1". | |
value | string | number | Strings are printed as given. Numbers are formatted with decimals; NaN shows as ---. | |
unit | string | Printed in the corner of the cell, e.g. "MHz". | |
decimals | number | 0 | Decimal places for numeric values. |
color | string | white | Colour of the value text, e.g. amber for a caution. |
Development
npm install
npm run dev         # interactive playground (Vite) at http://localhost:5173
npm run build:demo  # static build of the playground in demo-dist/
npm run deploy:demo # build and deploy the playground to harvis.dev (the live demo)
npm test            # unit tests (Vitest)
npm run typecheck
npm run build       # outputs dist/ (ESM + CJS + .d.ts)
Releasing
Releases run from GitHub Actions:
- CI (
ci.yml) runs on every push and pull request. It typechecks, tests and builds on Node 22 and 24, then installs the packed tarball on Node 18, 20 and 22 and checks that every component renders. - Release (
release.yml) is started by hand from the Actions tab, where you choosepatch,minorormajor. It bumps the version, commits, tags, creates a GitHub release and then triggers Publish. - Publish (
publish.yml) publishes to npm with provenance using trusted publishing, so no npm token is stored. It skips versions that are already on npm, so it is safe to re-run.
One-time setup:
- Publish the first version by hand (
npm login && npm publish), because npm can only set a trusted publisher on a package that already exists. - On npmjs.com, open the package's Settings, then Trusted publishing, and add GitHub Actions with this repository and the workflow file
publish.yml.
License
MIT