
README
Tado° Prometheus Exporter

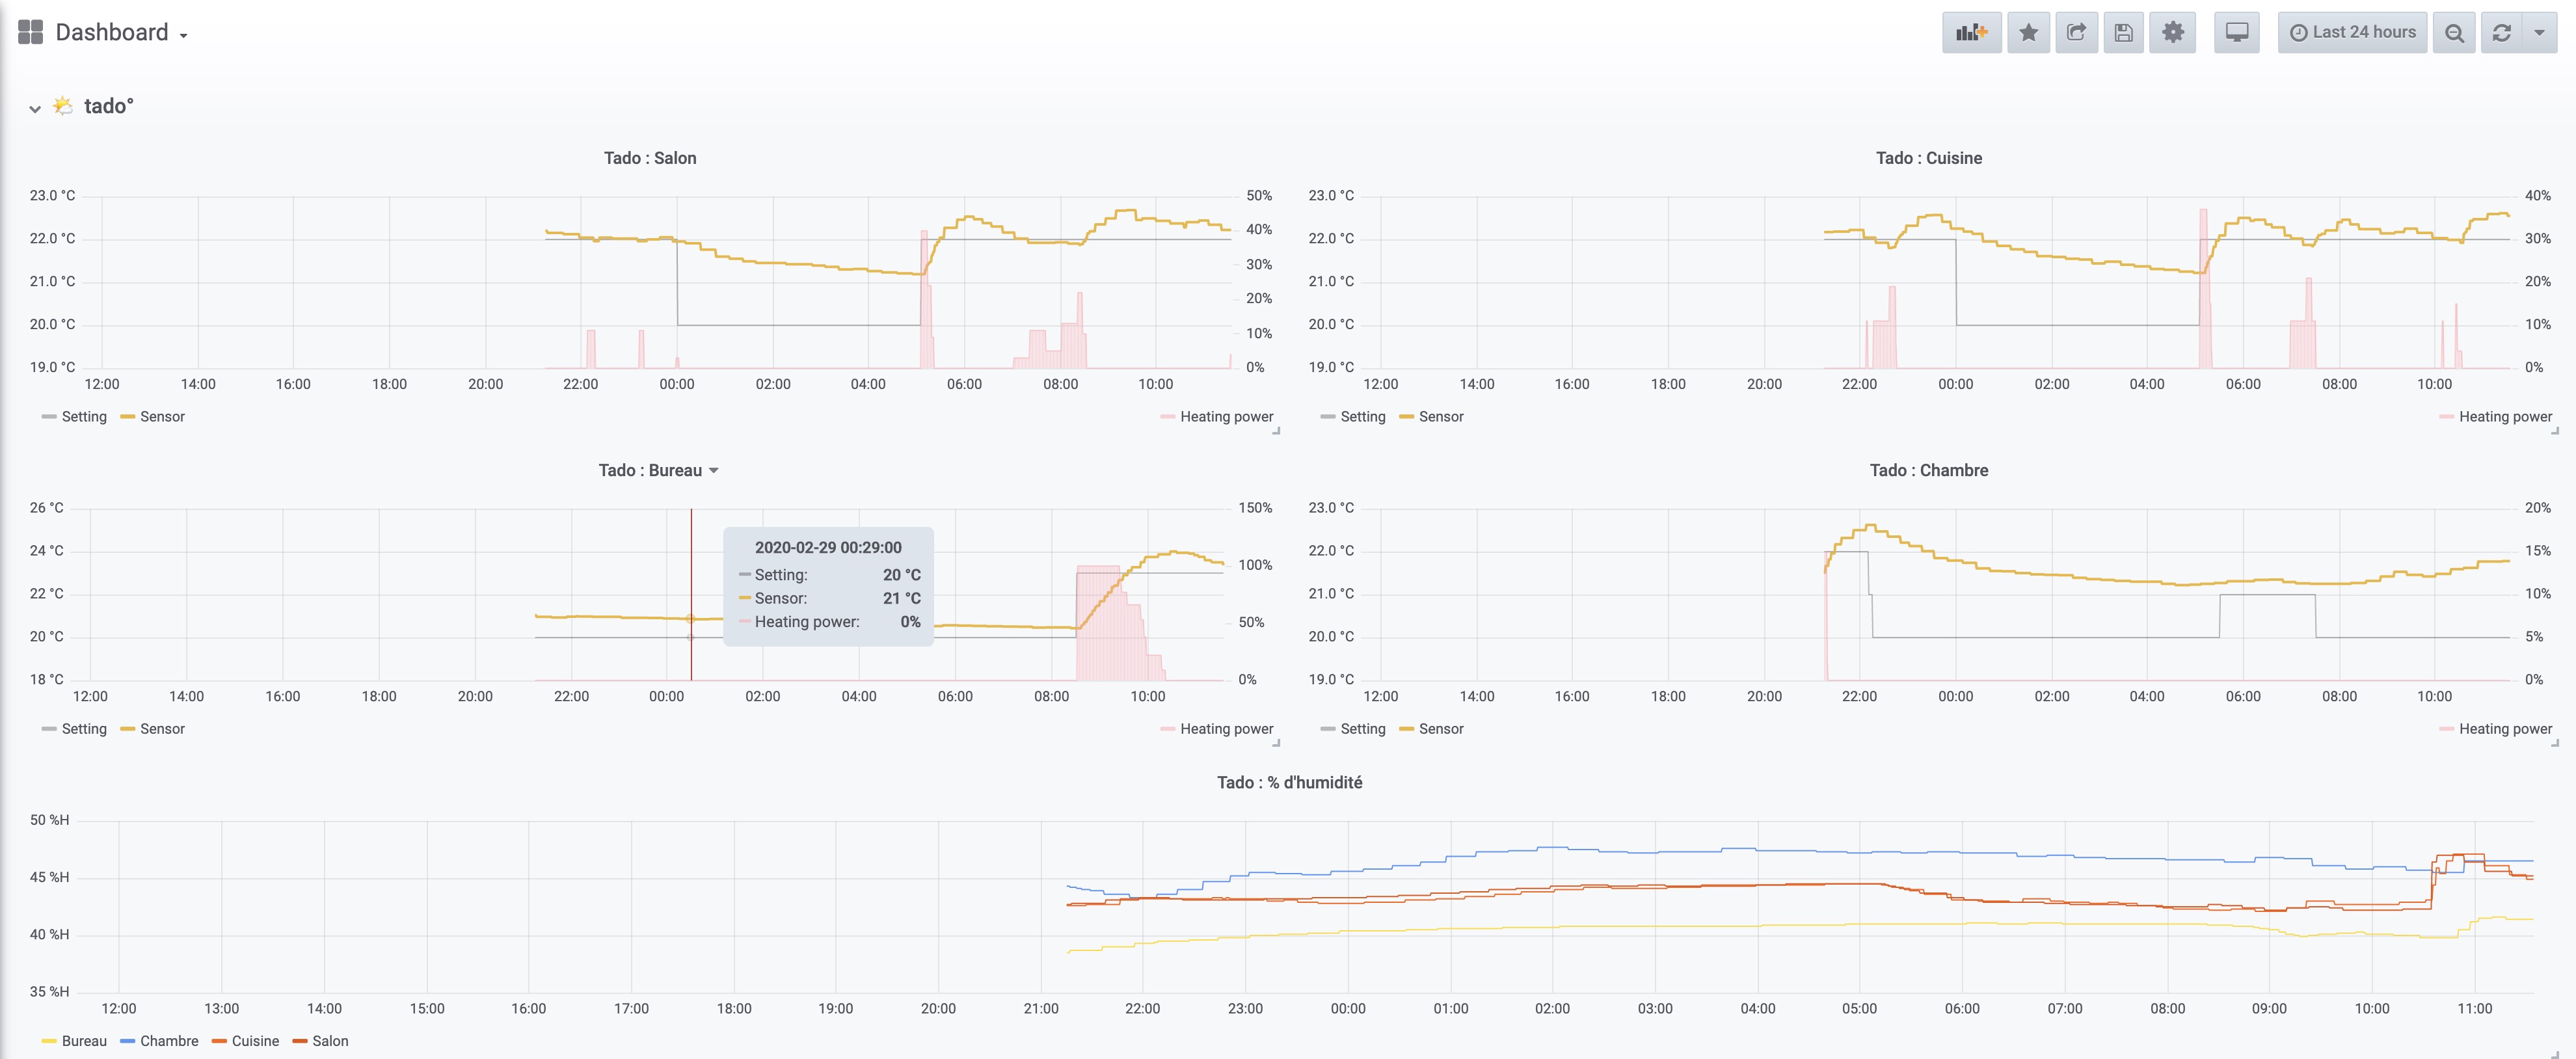
This is a Prometheus exporter for tado° thermostatic handles.
Prerequisites
In case you want to develop on this project, you will need:
If you just want to use it, you need nothing apart download and run the binary file in the next step.
Installation
Download binary
You can download the latest version of the binary built for your architecture here:
Using Docker
The exporter is also available as a Docker image. You can run it using the following example and pass configuration environment variables:
$ docker run \
  -e 'EXPORTER_USERNAME=your-username@acme.tld' \
  -e 'EXPORTER_PASSWORD=your-password' \
  -p '9898:9898' \
  ekofr/tado-exporter:latest
From sources
Optionally, you can download and build it from the sources. You have to retrieve the project sources by using one of the following way:
$ git clone https://github.com/eko/tado-exporter
Then, just build the binary:
$ cargo build --release
Usage
In order to run the exporter, type the following command (arguments are optional):
$ export EXPORTER_TICKER=10
$ export EXPORTER_USERNAME="my-username@acme.tld"
$ export EXPORTER_PASSWORD="your-password"
$ ./tado-exporter
--- tado° exporter configuration ---
Ticker seconds: 10
Username: my-username@acme.tld
Password: your-password
Client secret: wZaRN7rpjn3FoNyF5IFuxg9uMzYJcvOoQ8QWiIqS3hfk6gLhVlG57j5YNoZL2Rtc
------------------------------------
[2025-07-01T10:28:03Z INFO  tado_exporter] starting tado° exporter on address: 0.0.0.0:9898
[2025-07-01T10:28:03Z INFO  tado_exporter::tado::client] Started device authentication flow with URL https://login.tado.com/oauth2/device?user_code=PTZ9BQ
[2025-07-01T10:28:03Z INFO  tado_exporter::tado::client] Device authentication flow still pending, will retry
[2025-07-01T10:28:08Z INFO  tado_exporter::tado::client] Device authentication flow still pending, will retry
...
At this point you will need to visit the provided URL (in this case, https://login.tado.com/oauth2/device?user_code=PTZ9BQ) in your browser and login to authorise the exporter on your behalf.
Once that is done, then exporting should begin:
[2025-07-01T10:30:44Z INFO  tado_exporter::tado::client] Device authentication flow completed
[2025-07-01T10:30:44Z INFO  tado_exporter] waiting for the first tick in 10 seconds...
[2025-07-01T10:30:54Z INFO  tado_exporter::tado::client] retrieving zone details for Study...
[2025-07-01T10:30:54Z INFO  tado_exporter::tado::client] retrieving zone details for Entrance Hall...
[2025-07-01T10:30:54Z INFO  tado_exporter::tado::client] retrieving zone details for Master Bedroom...
[2025-07-01T10:30:54Z INFO  tado_exporter::tado::client] retrieving zone details for Living Room...
Once the exporter is running, you also have to update your prometheus.yml configuration to let it scrape the exporter:
scrape_configs:
  - job_name: 'tado'
    static_configs:
      - targets: ['localhost:9898']
Available environment variables
| Environment variable name | Description |
|---|---|
| EXPORTER_USERNAME | Required. This represent your tado° account username/email |
| EXPORTER_PASSWORD | Required. This represent your tado° account password |
| EXPORTER_CLIENT_SECRET | Optional. This represent your tado° account client secret, using default value seems to work |
| EXPORTER_TICKER | Optional (default: 10). This represent the number of seconds the exporter will look for new data |
| RUST_LOG | Optional (default: info). This describes the log level (see https://docs.rs/env_logger/) |
Available Prometheus metrics
| Metric name | Description |
|---|---|
| tado_activity_ac_power_value | This represent the value (1.0 = ON, 0.0 = OFF) of ac power for every zone |
| tado_activity_heating_power_percentage | This represent the % of heating power for every zone |
| tado_setting_temperature_value | This represent the current temperature you asked/programmed in a zone |
| tado_sensor_temperature_value | This represent the current temperature detected by sensor in a zone |
| tado_sensor_humidity_percentage | This represent the current humidity % detected by sensor in a zone |
Community welcome
Please feel free to contribute to this project in order to make it evolve. You're very welcome.
Contributors




Similar repos


Languages
Rust
94.5%
Dockerfile
5.5%
README
Tado° Prometheus Exporter
This is a Prometheus exporter for tado° thermostatic handles.
Prerequisites
In case you want to develop on this project, you will need:
If you just want to use it, you need nothing apart download and run the binary file in the next step.
Installation
Download binary
You can download the latest version of the binary built for your architecture here:
Using Docker
The exporter is also available as a Docker image. You can run it using the following example and pass configuration environment variables:
$ docker run \
  -e 'EXPORTER_USERNAME=your-username@acme.tld' \
  -e 'EXPORTER_PASSWORD=your-password' \
  -p '9898:9898' \
  ekofr/tado-exporter:latest
From sources
Optionally, you can download and build it from the sources. You have to retrieve the project sources by using one of the following way:
$ git clone https://github.com/eko/tado-exporter
Then, just build the binary:
$ cargo build --release
Usage
In order to run the exporter, type the following command (arguments are optional):
$ export EXPORTER_TICKER=10
$ export EXPORTER_USERNAME="my-username@acme.tld"
$ export EXPORTER_PASSWORD="your-password"
$ ./tado-exporter
--- tado° exporter configuration ---
Ticker seconds: 10
Username: my-username@acme.tld
Password: your-password
Client secret: wZaRN7rpjn3FoNyF5IFuxg9uMzYJcvOoQ8QWiIqS3hfk6gLhVlG57j5YNoZL2Rtc
------------------------------------
[2025-07-01T10:28:03Z INFO  tado_exporter] starting tado° exporter on address: 0.0.0.0:9898
[2025-07-01T10:28:03Z INFO  tado_exporter::tado::client] Started device authentication flow with URL https://login.tado.com/oauth2/device?user_code=PTZ9BQ
[2025-07-01T10:28:03Z INFO  tado_exporter::tado::client] Device authentication flow still pending, will retry
[2025-07-01T10:28:08Z INFO  tado_exporter::tado::client] Device authentication flow still pending, will retry
...
At this point you will need to visit the provided URL (in this case, https://login.tado.com/oauth2/device?user_code=PTZ9BQ) in your browser and login to authorise the exporter on your behalf.
Once that is done, then exporting should begin:
[2025-07-01T10:30:44Z INFO  tado_exporter::tado::client] Device authentication flow completed
[2025-07-01T10:30:44Z INFO  tado_exporter] waiting for the first tick in 10 seconds...
[2025-07-01T10:30:54Z INFO  tado_exporter::tado::client] retrieving zone details for Study...
[2025-07-01T10:30:54Z INFO  tado_exporter::tado::client] retrieving zone details for Entrance Hall...
[2025-07-01T10:30:54Z INFO  tado_exporter::tado::client] retrieving zone details for Master Bedroom...
[2025-07-01T10:30:54Z INFO  tado_exporter::tado::client] retrieving zone details for Living Room...
Once the exporter is running, you also have to update your prometheus.yml configuration to let it scrape the exporter:
scrape_configs:
  - job_name: 'tado'
    static_configs:
      - targets: ['localhost:9898']
Available environment variables
| Environment variable name | Description |
|---|---|
| EXPORTER_USERNAME | Required. This represent your tado° account username/email |
| EXPORTER_PASSWORD | Required. This represent your tado° account password |
| EXPORTER_CLIENT_SECRET | Optional. This represent your tado° account client secret, using default value seems to work |
| EXPORTER_TICKER | Optional (default: 10). This represent the number of seconds the exporter will look for new data |
| RUST_LOG | Optional (default: info). This describes the log level (see https://docs.rs/env_logger/) |
Available Prometheus metrics
| Metric name | Description |
|---|---|
| tado_activity_ac_power_value | This represent the value (1.0 = ON, 0.0 = OFF) of ac power for every zone |
| tado_activity_heating_power_percentage | This represent the % of heating power for every zone |
| tado_setting_temperature_value | This represent the current temperature you asked/programmed in a zone |
| tado_sensor_temperature_value | This represent the current temperature detected by sensor in a zone |
| tado_sensor_humidity_percentage | This represent the current humidity % detected by sensor in a zone |
Community welcome
Please feel free to contribute to this project in order to make it evolve. You're very welcome.
Similar repos
Contributors
Languages
Rust
94.5%
Dockerfile
5.5%