Kronos: Foundation Model for the Language of Financial Markets with Quant Studio UI and Multi-Market Datasets
Python
0
74 commits
updated Sep 29, 2026





Pre-trained on historical market data across 45+ global exchanges.
If you are familiar with Large Language Models like ChatGPT:
Traditional time-series models (ARIMA, LSTMs, simple Linear Networks, or generic Time-Series Transformers) usually struggle in finance because:
Kronos employs a two-stage foundation architecture:
┌─────────────────────────────────┐      ┌───────────────────────────────┐      ┌───────────────────────────────┐
│ Continuous Financial K-Lines    │      │ Kronos Hierarchical Tokenizer │      │ Autoregressive Transformer    │
│ [Open, High, Low, Close, Vol]   │ ───► │ Quantizes continuous prices   │ ───► │ Predicts probability over     │
│ (Raw noisy market data)         │      │ into discrete semantic tokens │      │ next candlestick tokens       │
└─────────────────────────────────┘      └───────────────────────────────┘      └───────────────────────────────┘
                                                                                        │
                                                                                        ▼
                                                                        ┌───────────────────────────────┐
                                                                        │ De-quantization & Trajectory  │
                                                                        │ Future OHLCV + Probability    │
                                                                        └───────────────────────────────┘
Kronos was pre-trained on a massive, heterogeneous corpus of financial candlestick data spanning:
Kronos provides complete future trajectories for all 6 core market fields:
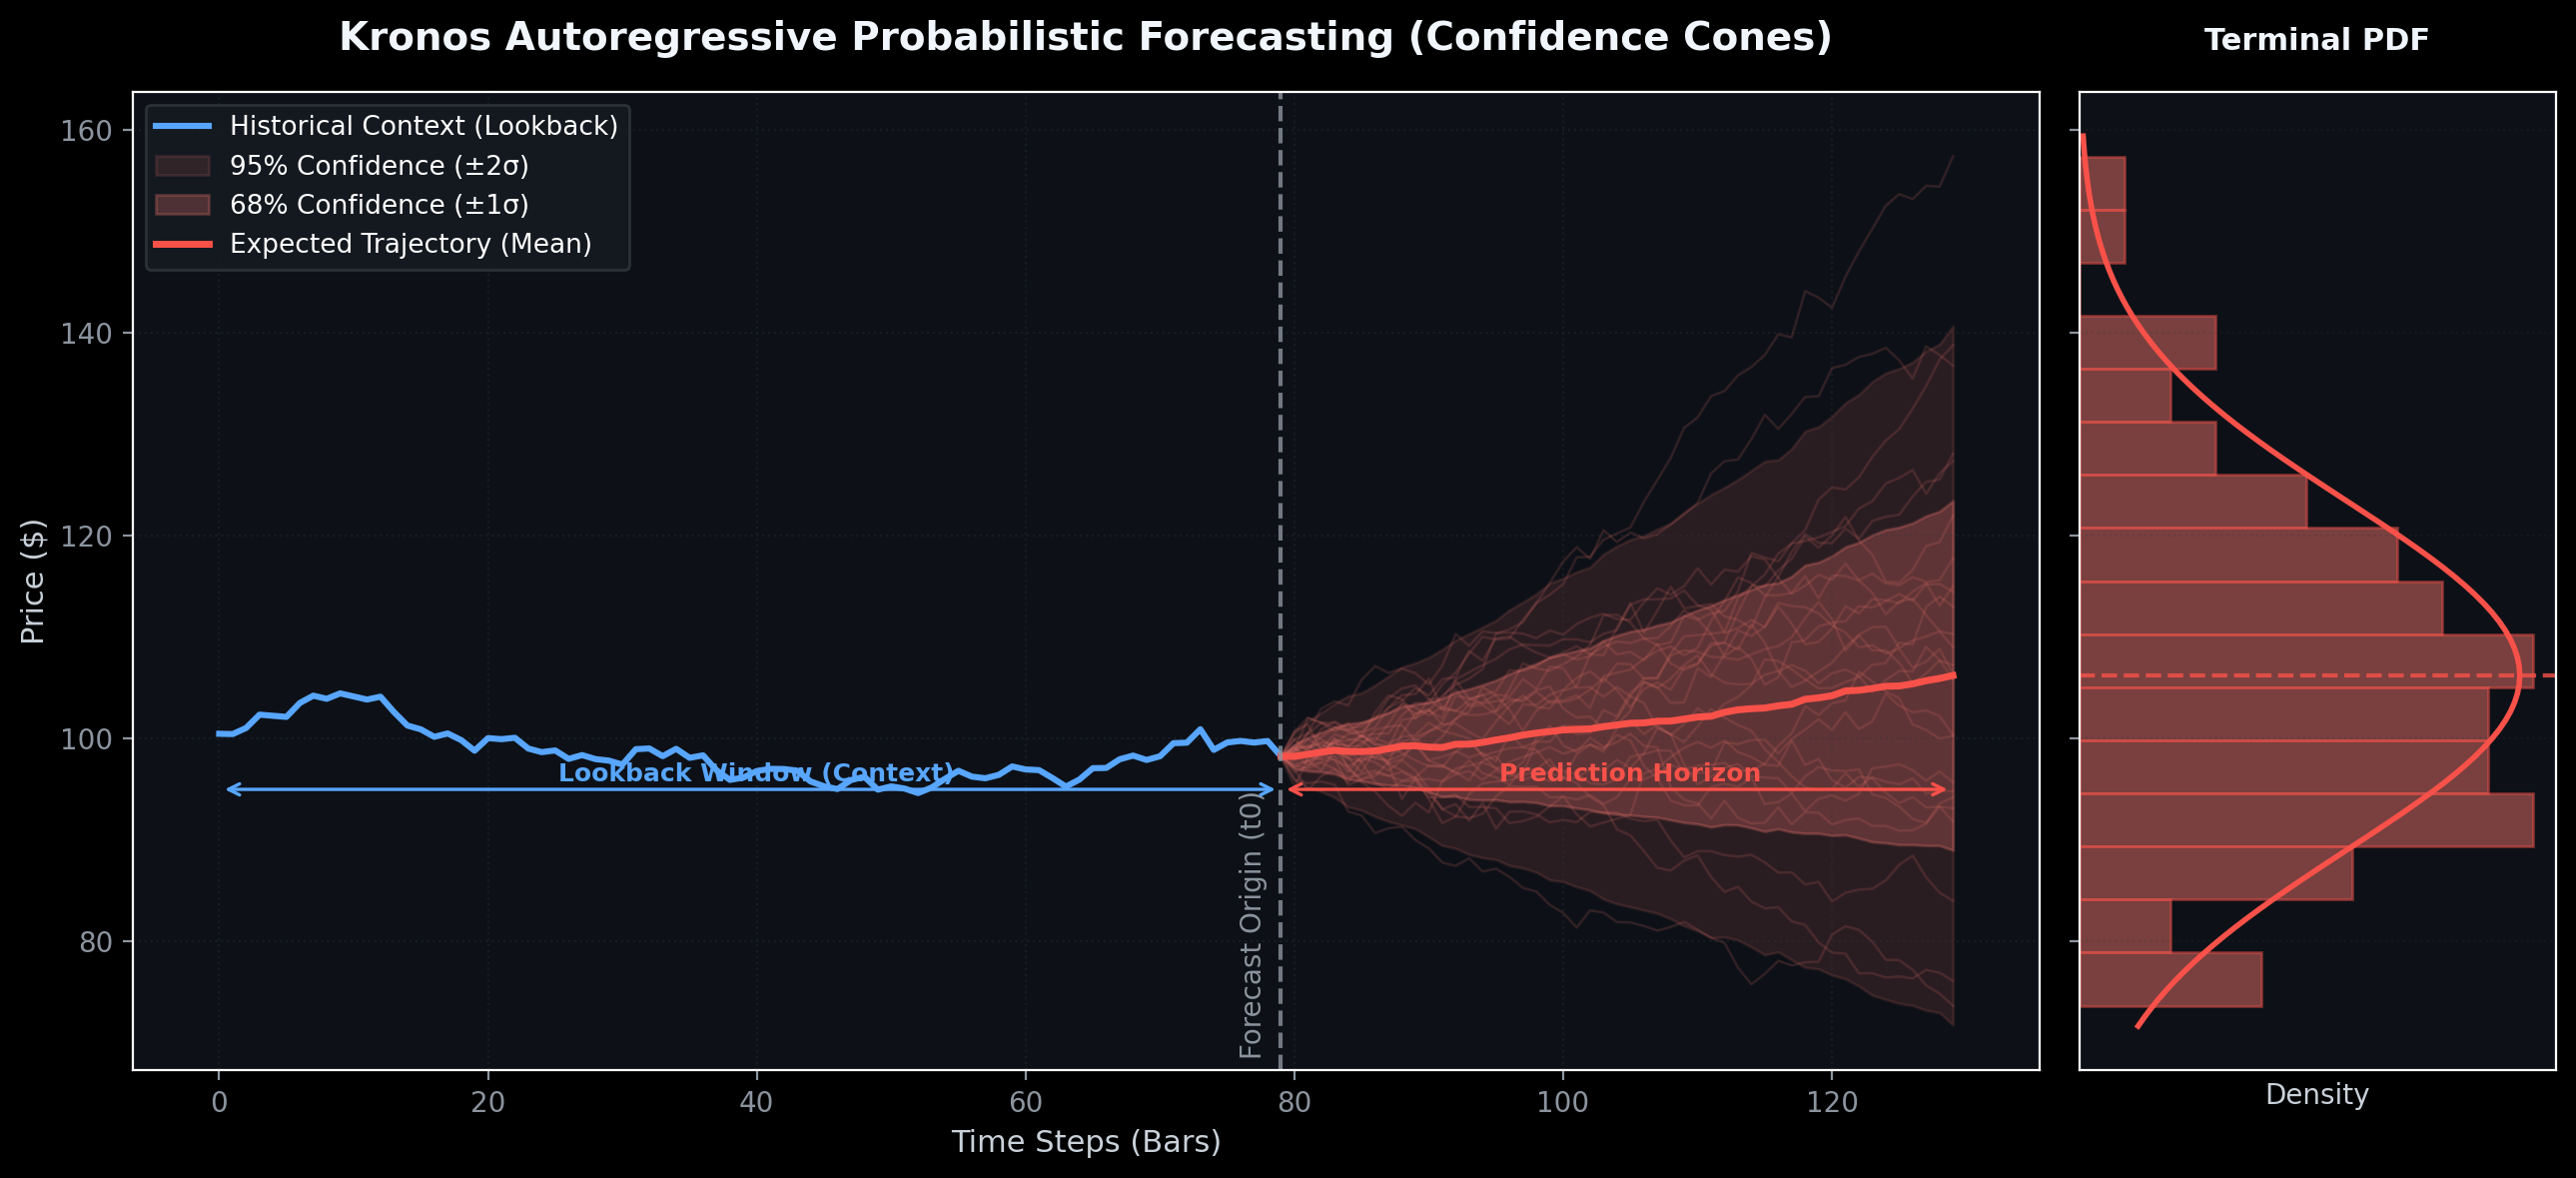
open: Projected opening price of each future bar.high: Expected maximum price reach (vital for setting stop-losses & take-profits).low: Expected minimum price dip.close: Projected settlement price.volume: Anticipated trading volume / liquidity.amount: Projected monetary turnover.Because Kronos outputs a probability distribution over discrete tokens at each step rather than a single deterministic number:
sample_count = 50 or 100).
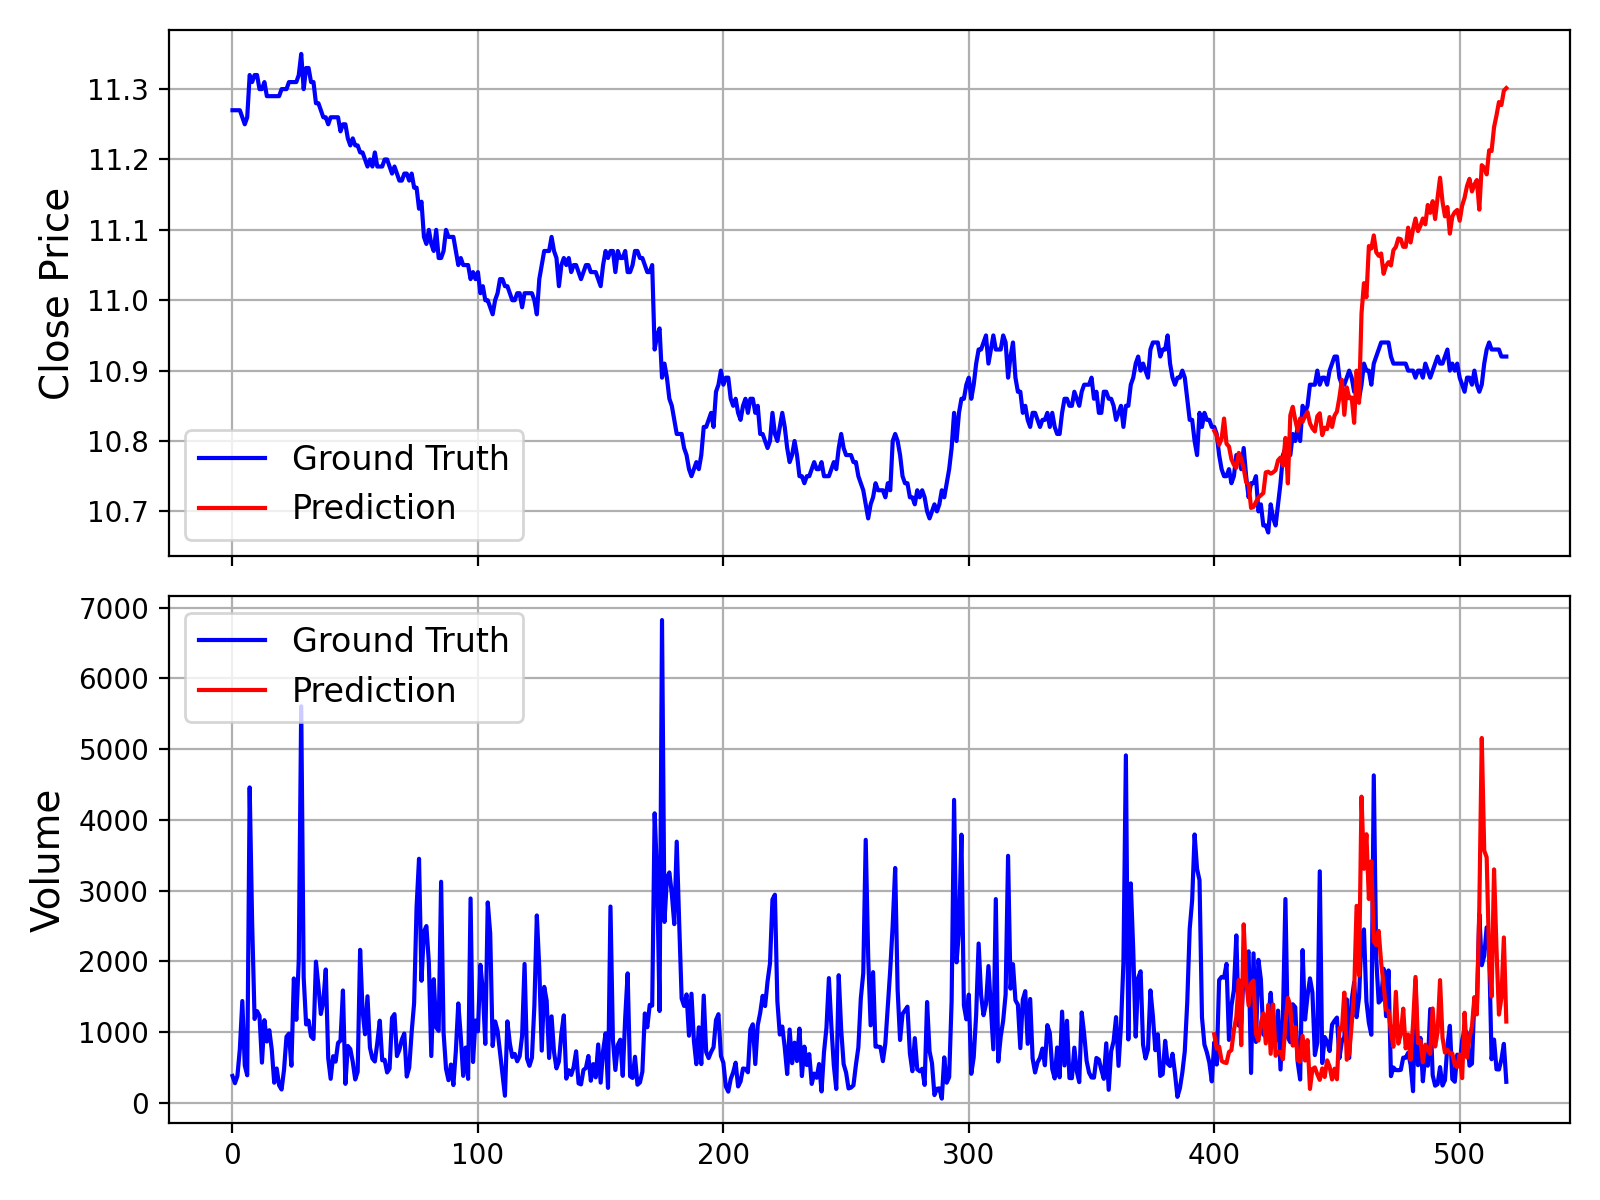
Markets are not just price—they are driven by order flow. Kronos predicts price and volume simultaneously. This reveals:
Financial data is notorious for heavy tails and non-Gaussian jumps. The Kronos tokenizer breaks down each candlestick into hierarchical codes:
| Use Case | Description |
|---|---|
| Algorithmic Trading Signals | Generate directional momentum, mean-reversion, and breakout signals for automated execution bots. |
| Risk Management & VaR | Simulate thousands of possible future price paths to calculate Value-at-Risk, Expected Shortfall, and max drawdown risks. |
| Option Pricing & Volatility | Derive implied forward volatility cones directly from probabilistic trajectory distributions. |
| Optimal Order Execution (VWAP/TWAP) | Use predicted volume curves to minimize market impact and slippage when executing large institutional orders. |
| Foundation Feature Extractor | Extract Kronos token embeddings as dense latent representations for downstream Reinforcement Learning or Machine Learning models. |
All pre-trained checkpoints are hosted on the Hugging Face Hub:
| Model Checkpoint | Tokenizer | Context Window | Parameters | Recommended Hardware | Use Case |
|---|---|---|---|---|---|
| Kronos-mini | Kronos-Tokenizer-2k | 2048 bars | 4.1M | CPU or any GPU | Long historical lookback, fast lightweight inference |
| Kronos-small | Kronos-Tokenizer-base | 512 bars | 24.7M | Modern GPU / CPU | General quantitative research & live intraday trading |
| Kronos-base | Kronos-Tokenizer-base | 512 bars | 102.3M | High-end GPU | Highest capacity, complex cross-market regimes |
Clone the repository:
git clone https://github.com/dhruvkachhela/Kronos.git
cd Kronos
Create and activate a virtual environment (Python 3.10 or 3.11):
python -m venv myenv
# Windows:
myenv\Scripts\activate
# Linux/macOS:
source myenv/bin/activate
Install dependencies:
pip install -r requirements.txt
Predict the next 120 bars from historical candlestick data in just a few lines:
import pandas as pd
from model import Kronos, KronosTokenizer, KronosPredictor

# 1. Load tokenizer and foundation model from Hugging Face
tokenizer = KronosTokenizer.from_pretrained("NeoQuasar/Kronos-Tokenizer-base")
model = Kronos.from_pretrained("NeoQuasar/Kronos-small")

# 2. Instantiate predictor
predictor = KronosPredictor(model, tokenizer, max_context=512)

# 3. Load historical candlestick data (OHLCV)
df = pd.read_csv("data/NSE_NIFTY50_5m.csv")
df['timestamps'] = pd.to_datetime(df['timestamps'])

lookback = 400   # Number of past bars to observe
pred_len = 120   # Number of future bars to predict

x_df = df.loc[:lookback-1, ['open', 'high', 'low', 'close', 'volume', 'amount']]
x_timestamp = df.loc[:lookback-1, 'timestamps']
y_timestamp = df.loc[lookback:lookback+pred_len-1, 'timestamps']

# 4. Generate future forecast trajectory
pred_df = predictor.predict(
    df=x_df,
    x_timestamp=x_timestamp,
    y_timestamp=y_timestamp,
    pred_len=pred_len,
    T=1.0,          # Temperature (lower = more deterministic, higher = more diverse)
    top_p=0.9,      # Nucleus sampling probability
    sample_count=1  # Number of paths to sample and average
)

print("Forecasted Candlesticks:")
print(pred_df.head())
Forecast multiple assets (e.g., BTC, ETH, Nifty 50, Reliance) in parallel on the GPU:
# Pass lists of dataframes and timestamps
pred_df_list = predictor.predict_batch(
    df_list=[df_btc, df_eth, df_nifty],
    x_timestamp_list=[ts_btc, ts_eth, ts_nifty],
    y_timestamp_list=[future_btc, future_eth, future_nifty],
    pred_len=120,
    T=1.0,
    top_p=0.9,
    sample_count=1,
    verbose=True
)

for symbol, pred in zip(["BTC", "ETH", "NIFTY"], pred_df_list):
    print(f"--- {symbol} Forecast ---")
    print(pred[['open', 'high', 'low', 'close', 'volume']].head())
Generate a full Gaussian-like probability distribution with $\pm 1\sigma$ and $\pm 2\sigma$ confidence intervals via Monte Carlo trajectory sampling:
import numpy as np

# Sample 50 distinct paths
sampled_trajectories = []
for _ in range(50):
    sample = predictor.predict(
        df=x_df,
        x_timestamp=x_timestamp,
        y_timestamp=y_timestamp,
        pred_len=pred_len,
        T=1.0,
        top_p=0.95,
        sample_count=1
    )
    sampled_trajectories.append(sample['close'].values)

samples_arr = np.array(sampled_trajectories)  # Shape: (50, pred_len)

# Calculate distribution metrics
mean_path = np.mean(samples_arr, axis=0)
std_path  = np.std(samples_arr, axis=0)
upper_1sigma = mean_path + std_path
lower_1sigma = mean_path - std_path
upper_2sigma = mean_path + 2 * std_path
lower_2sigma = mean_path - 2 * std_path

print(f"Expected Close: {mean_path[-1]:.2f} ± {std_path[-1]:.2f}")
Kronos comes with two interactive visual web interfaces tailored for different workflows:
quant_studio/app.py): A streamlined, high-speed 2-panel evaluator with synchronized zooming, scorecards, and directional hit rate metrics.webui/app.py): A comprehensive multi-model dashboard supporting candlestick (OHLC) charts, historical date range filtering, and tabular inspection.Designed for rapid quantitative validation and visual backtesting against ground truth.
python quant_studio/app.py
Open http://localhost:7080 in your browser.
^NSEI), Bank Nifty (^NSEBANK), Reliance (RELIANCE.NS), TCS (TCS.NS), HDFC Bank (HDFCBANK.NS), Infosys (INFY.NS), SBI (SBIN.NS), ICICI Bank (ICICIBANK.NS).BTC-USD), Ethereum (ETH-USD), Solana (SOL-USD).The official full-featured web interface for in-depth model exploration and custom timeframe testing.
python webui/app.py
Open http://localhost:7070 in your browser.
Kronos-mini (2048 context length)Kronos-small (512 context length)Kronos-base (102M parameters)Open, High, Low, Close, Volume, and Turnover in an exportable table.Use the included helper script to download and prepare any global or Indian ticker:
# Fetch Indian NSE Equities / Indices
python data/fetch_indian_data.py ^NSEI          # Nifty 50 Index
python data/fetch_indian_data.py RELIANCE.NS     # Reliance Industries
python data/fetch_indian_data.py TATAMOTORS.NS   # Tata Motors

# Fetch Cryptocurrencies
python data/fetch_indian_data.py BTC-USD         # Bitcoin
python data/fetch_indian_data.py ETH-USD         # Ethereum
Downloaded datasets are automatically saved to data/ formatted with required columns (timestamps, open, high, low, close, volume, amount).
You can fine-tune both the Tokenizer and the Predictor on proprietary or exchange-specific datasets:
finetune/config.py.python finetune/qlib_data_preprocess.py
torchrun --standalone --nproc_per_node=1 finetune/train_tokenizer.py
torchrun --standalone --nproc_per_node=1 finetune/train_predictor.py
^NSEI, ^NSEBANK)?Spot indices do not have direct trading volume (only underlying derivative contracts do). Volume for spot indices is recorded as 0, so Kronos correctly predicts 0 volume. For active volume curves, use individual stocks (RELIANCE.NS, TCS.NS) or crypto pairs (BTC-USD).
T affect forecasts?T = 0.1 - 0.5: Low temperature. Predictions are conservative, smooth, and adhere strictly to dominant historical patterns.T = 1.0: Standard setting. Balances realism and market fluctuation.T = 1.5+: High temperature. Produces wider dispersion and captures extreme volatility scenarios.@article{kronos2025,
title={Kronos: A Foundation Model for the Language of Financial Markets},
author={Shiyu et al.},
journal={arXiv preprint arXiv:2508.02739},
year={2025}
}
This project is licensed under the MIT License - see the LICENSE file for details.
Kronos: Foundation Model for the Language of Financial Markets with Quant Studio UI and Multi-Market Datasets
Python
0
74 commits
updated Sep 29, 2026
Pre-trained on historical market data across 45+ global exchanges.
If you are familiar with Large Language Models like ChatGPT:
Traditional time-series models (ARIMA, LSTMs, simple Linear Networks, or generic Time-Series Transformers) usually struggle in finance because:
Kronos employs a two-stage foundation architecture:
┌─────────────────────────────────┐      ┌───────────────────────────────┐      ┌───────────────────────────────┐
│ Continuous Financial K-Lines    │      │ Kronos Hierarchical Tokenizer │      │ Autoregressive Transformer    │
│ [Open, High, Low, Close, Vol]   │ ───► │ Quantizes continuous prices   │ ───► │ Predicts probability over     │
│ (Raw noisy market data)         │      │ into discrete semantic tokens │      │ next candlestick tokens       │
└─────────────────────────────────┘      └───────────────────────────────┘      └───────────────────────────────┘
                                                                                        │
                                                                                        ▼
                                                                        ┌───────────────────────────────┐
                                                                        │ De-quantization & Trajectory  │
                                                                        │ Future OHLCV + Probability    │
                                                                        └───────────────────────────────┘
Kronos was pre-trained on a massive, heterogeneous corpus of financial candlestick data spanning:
Kronos provides complete future trajectories for all 6 core market fields:
open: Projected opening price of each future bar.high: Expected maximum price reach (vital for setting stop-losses & take-profits).low: Expected minimum price dip.close: Projected settlement price.volume: Anticipated trading volume / liquidity.amount: Projected monetary turnover.Because Kronos outputs a probability distribution over discrete tokens at each step rather than a single deterministic number:
sample_count = 50 or 100).
Markets are not just price—they are driven by order flow. Kronos predicts price and volume simultaneously. This reveals:
Financial data is notorious for heavy tails and non-Gaussian jumps. The Kronos tokenizer breaks down each candlestick into hierarchical codes:
| Use Case | Description |
|---|---|
| Algorithmic Trading Signals | Generate directional momentum, mean-reversion, and breakout signals for automated execution bots. |
| Risk Management & VaR | Simulate thousands of possible future price paths to calculate Value-at-Risk, Expected Shortfall, and max drawdown risks. |
| Option Pricing & Volatility | Derive implied forward volatility cones directly from probabilistic trajectory distributions. |
| Optimal Order Execution (VWAP/TWAP) | Use predicted volume curves to minimize market impact and slippage when executing large institutional orders. |
| Foundation Feature Extractor | Extract Kronos token embeddings as dense latent representations for downstream Reinforcement Learning or Machine Learning models. |
All pre-trained checkpoints are hosted on the Hugging Face Hub:
| Model Checkpoint | Tokenizer | Context Window | Parameters | Recommended Hardware | Use Case |
|---|---|---|---|---|---|
| Kronos-mini | Kronos-Tokenizer-2k | 2048 bars | 4.1M | CPU or any GPU | Long historical lookback, fast lightweight inference |
| Kronos-small | Kronos-Tokenizer-base | 512 bars | 24.7M | Modern GPU / CPU | General quantitative research & live intraday trading |
| Kronos-base | Kronos-Tokenizer-base | 512 bars | 102.3M | High-end GPU | Highest capacity, complex cross-market regimes |
Clone the repository:
git clone https://github.com/dhruvkachhela/Kronos.git
cd Kronos
Create and activate a virtual environment (Python 3.10 or 3.11):
python -m venv myenv
# Windows:
myenv\Scripts\activate
# Linux/macOS:
source myenv/bin/activate
Install dependencies:
pip install -r requirements.txt
Predict the next 120 bars from historical candlestick data in just a few lines:
import pandas as pd
from model import Kronos, KronosTokenizer, KronosPredictor

# 1. Load tokenizer and foundation model from Hugging Face
tokenizer = KronosTokenizer.from_pretrained("NeoQuasar/Kronos-Tokenizer-base")
model = Kronos.from_pretrained("NeoQuasar/Kronos-small")

# 2. Instantiate predictor
predictor = KronosPredictor(model, tokenizer, max_context=512)

# 3. Load historical candlestick data (OHLCV)
df = pd.read_csv("data/NSE_NIFTY50_5m.csv")
df['timestamps'] = pd.to_datetime(df['timestamps'])

lookback = 400   # Number of past bars to observe
pred_len = 120   # Number of future bars to predict

x_df = df.loc[:lookback-1, ['open', 'high', 'low', 'close', 'volume', 'amount']]
x_timestamp = df.loc[:lookback-1, 'timestamps']
y_timestamp = df.loc[lookback:lookback+pred_len-1, 'timestamps']

# 4. Generate future forecast trajectory
pred_df = predictor.predict(
    df=x_df,
    x_timestamp=x_timestamp,
    y_timestamp=y_timestamp,
    pred_len=pred_len,
    T=1.0,          # Temperature (lower = more deterministic, higher = more diverse)
    top_p=0.9,      # Nucleus sampling probability
    sample_count=1  # Number of paths to sample and average
)

print("Forecasted Candlesticks:")
print(pred_df.head())
Forecast multiple assets (e.g., BTC, ETH, Nifty 50, Reliance) in parallel on the GPU:
# Pass lists of dataframes and timestamps
pred_df_list = predictor.predict_batch(
    df_list=[df_btc, df_eth, df_nifty],
    x_timestamp_list=[ts_btc, ts_eth, ts_nifty],
    y_timestamp_list=[future_btc, future_eth, future_nifty],
    pred_len=120,
    T=1.0,
    top_p=0.9,
    sample_count=1,
    verbose=True
)

for symbol, pred in zip(["BTC", "ETH", "NIFTY"], pred_df_list):
    print(f"--- {symbol} Forecast ---")
    print(pred[['open', 'high', 'low', 'close', 'volume']].head())
Generate a full Gaussian-like probability distribution with $\pm 1\sigma$ and $\pm 2\sigma$ confidence intervals via Monte Carlo trajectory sampling:
import numpy as np

# Sample 50 distinct paths
sampled_trajectories = []
for _ in range(50):
    sample = predictor.predict(
        df=x_df,
        x_timestamp=x_timestamp,
        y_timestamp=y_timestamp,
        pred_len=pred_len,
        T=1.0,
        top_p=0.95,
        sample_count=1
    )
    sampled_trajectories.append(sample['close'].values)

samples_arr = np.array(sampled_trajectories)  # Shape: (50, pred_len)

# Calculate distribution metrics
mean_path = np.mean(samples_arr, axis=0)
std_path  = np.std(samples_arr, axis=0)
upper_1sigma = mean_path + std_path
lower_1sigma = mean_path - std_path
upper_2sigma = mean_path + 2 * std_path
lower_2sigma = mean_path - 2 * std_path

print(f"Expected Close: {mean_path[-1]:.2f} ± {std_path[-1]:.2f}")
Kronos comes with two interactive visual web interfaces tailored for different workflows:
quant_studio/app.py): A streamlined, high-speed 2-panel evaluator with synchronized zooming, scorecards, and directional hit rate metrics.webui/app.py): A comprehensive multi-model dashboard supporting candlestick (OHLC) charts, historical date range filtering, and tabular inspection.Designed for rapid quantitative validation and visual backtesting against ground truth.
python quant_studio/app.py
Open http://localhost:7080 in your browser.
^NSEI), Bank Nifty (^NSEBANK), Reliance (RELIANCE.NS), TCS (TCS.NS), HDFC Bank (HDFCBANK.NS), Infosys (INFY.NS), SBI (SBIN.NS), ICICI Bank (ICICIBANK.NS).BTC-USD), Ethereum (ETH-USD), Solana (SOL-USD).The official full-featured web interface for in-depth model exploration and custom timeframe testing.
python webui/app.py
Open http://localhost:7070 in your browser.
Kronos-mini (2048 context length)Kronos-small (512 context length)Kronos-base (102M parameters)Open, High, Low, Close, Volume, and Turnover in an exportable table.Use the included helper script to download and prepare any global or Indian ticker:
# Fetch Indian NSE Equities / Indices
python data/fetch_indian_data.py ^NSEI          # Nifty 50 Index
python data/fetch_indian_data.py RELIANCE.NS     # Reliance Industries
python data/fetch_indian_data.py TATAMOTORS.NS   # Tata Motors

# Fetch Cryptocurrencies
python data/fetch_indian_data.py BTC-USD         # Bitcoin
python data/fetch_indian_data.py ETH-USD         # Ethereum
Downloaded datasets are automatically saved to data/ formatted with required columns (timestamps, open, high, low, close, volume, amount).
You can fine-tune both the Tokenizer and the Predictor on proprietary or exchange-specific datasets:
finetune/config.py.python finetune/qlib_data_preprocess.py
torchrun --standalone --nproc_per_node=1 finetune/train_tokenizer.py
torchrun --standalone --nproc_per_node=1 finetune/train_predictor.py
^NSEI, ^NSEBANK)?Spot indices do not have direct trading volume (only underlying derivative contracts do). Volume for spot indices is recorded as 0, so Kronos correctly predicts 0 volume. For active volume curves, use individual stocks (RELIANCE.NS, TCS.NS) or crypto pairs (BTC-USD).
T affect forecasts?T = 0.1 - 0.5: Low temperature. Predictions are conservative, smooth, and adhere strictly to dominant historical patterns.T = 1.0: Standard setting. Balances realism and market fluctuation.T = 1.5+: High temperature. Produces wider dispersion and captures extreme volatility scenarios.@article{kronos2025,
title={Kronos: A Foundation Model for the Language of Financial Markets},
author={Shiyu et al.},
journal={arXiv preprint arXiv:2508.02739},
year={2025}
}
This project is licensed under the MIT License - see the LICENSE file for details.



