
Chrome DevTools for native macOS and iOS apps: inspect views, edit styles, and debug Swift with AppKit and UIKit.
JavaScript
0
1 commits
updated Oct 7, 2026
See what people are saying
README
MacInspector
Chrome DevTools for native macOS and iOS apps.
Native UI debugging should be as immediate as web debugging: pick a control, inspect its properties, change its appearance and see the result. MacInspector brings that workflow to AppKit and UIKit, with native breakpoints and line-by-line stepping in the same window.
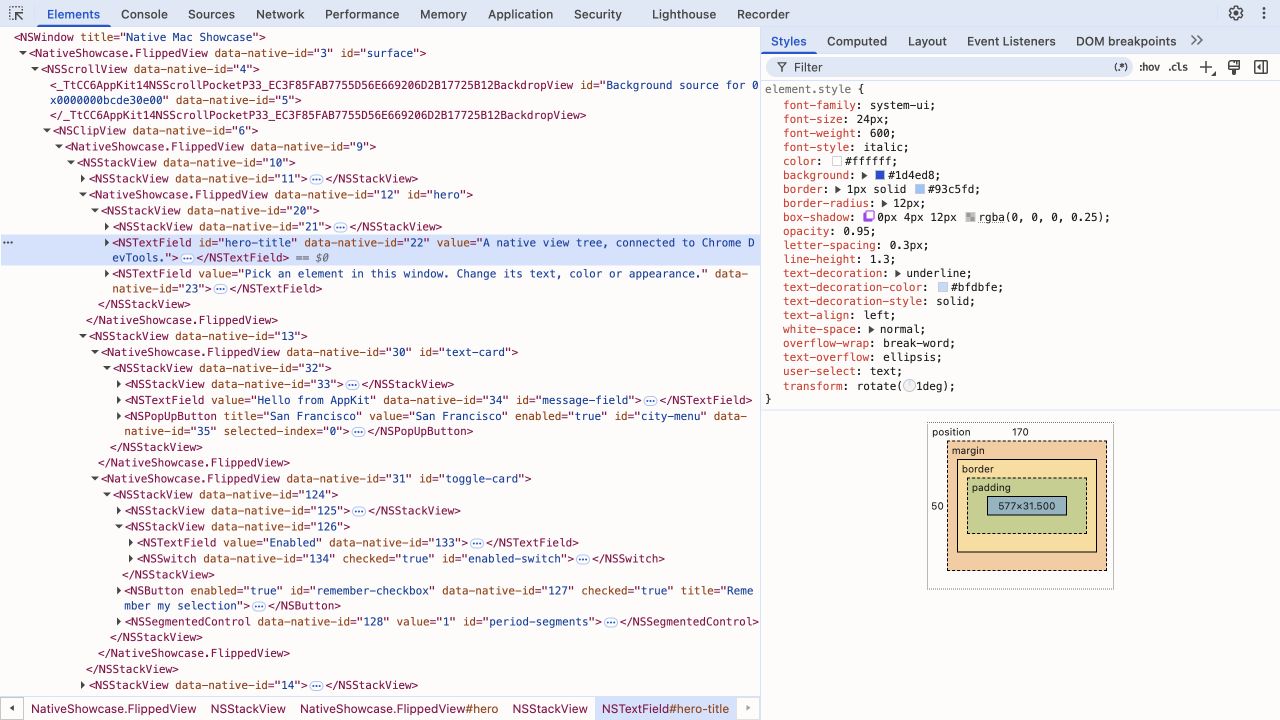
- Elements: the real native hierarchy, with tags such as
<NSTextField>, control attributes, bounds and dropdown items. Pick controls directly in the app. - Styles: edit colors, fonts, shadows, transforms, text formatting and native stack spacing live. Appearance stays in the right panel, keeping the element tree readable.
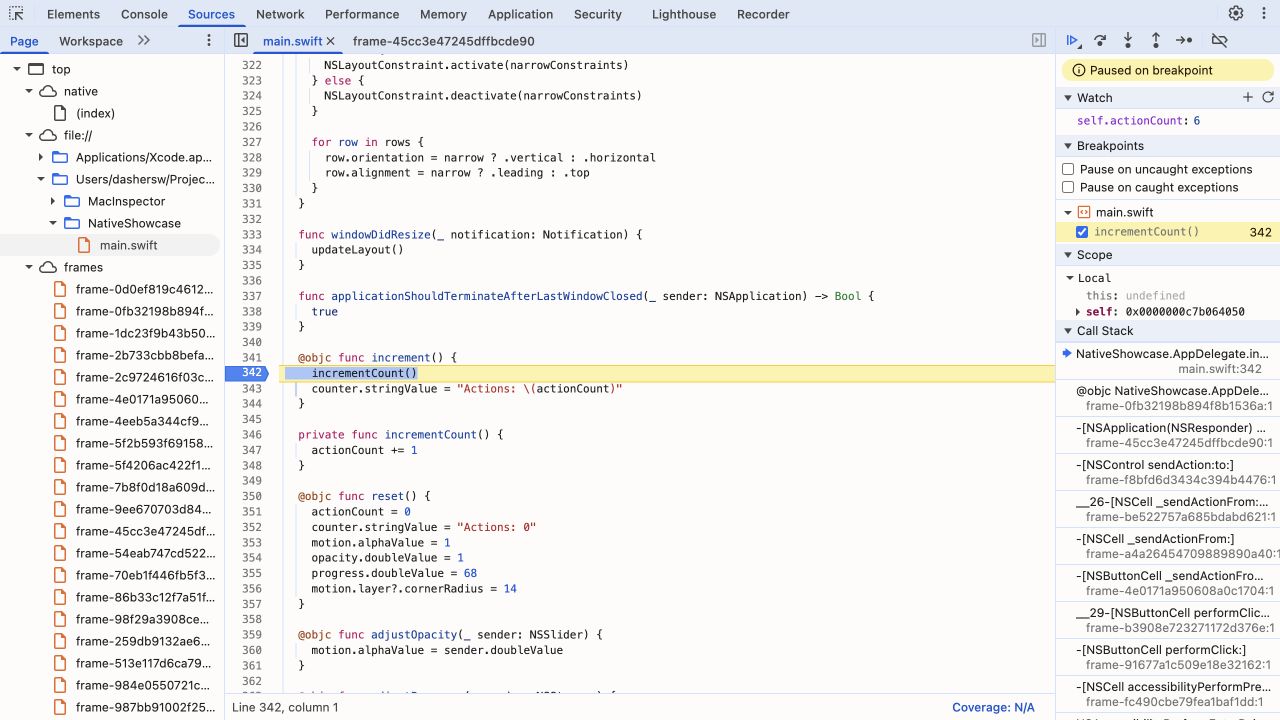
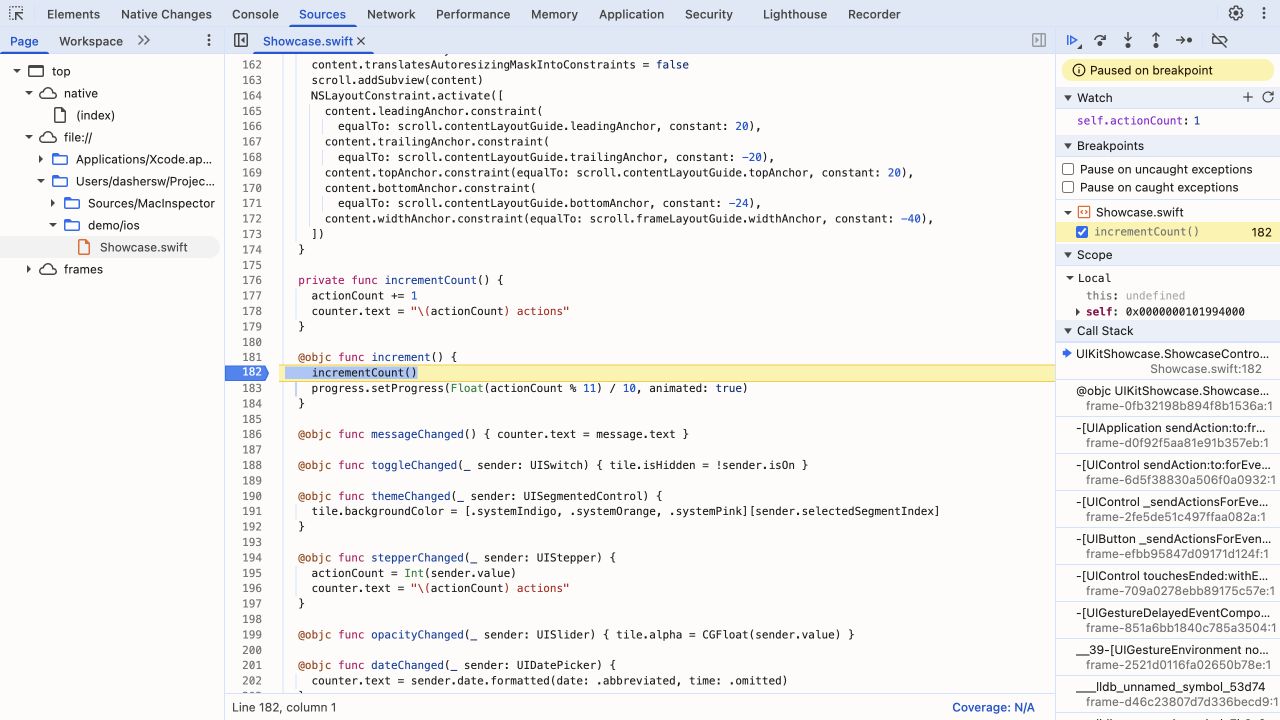
- Sources: read Swift with syntax highlighting, set breakpoints, step through native code and inspect variables through LLDB.
- Native Layout: inspect real Auto Layout constraints, intrinsic sizes, hugging and compression resistance. Highlight relationships and edit constants live.
- Event Listeners: see native control handlers with source links when debug symbols are available. AppKit also exposes menu actions and gesture recognizers.
- Native Changes: review edits, undo or redo, export Swift and save overrides to reapply after relaunch.
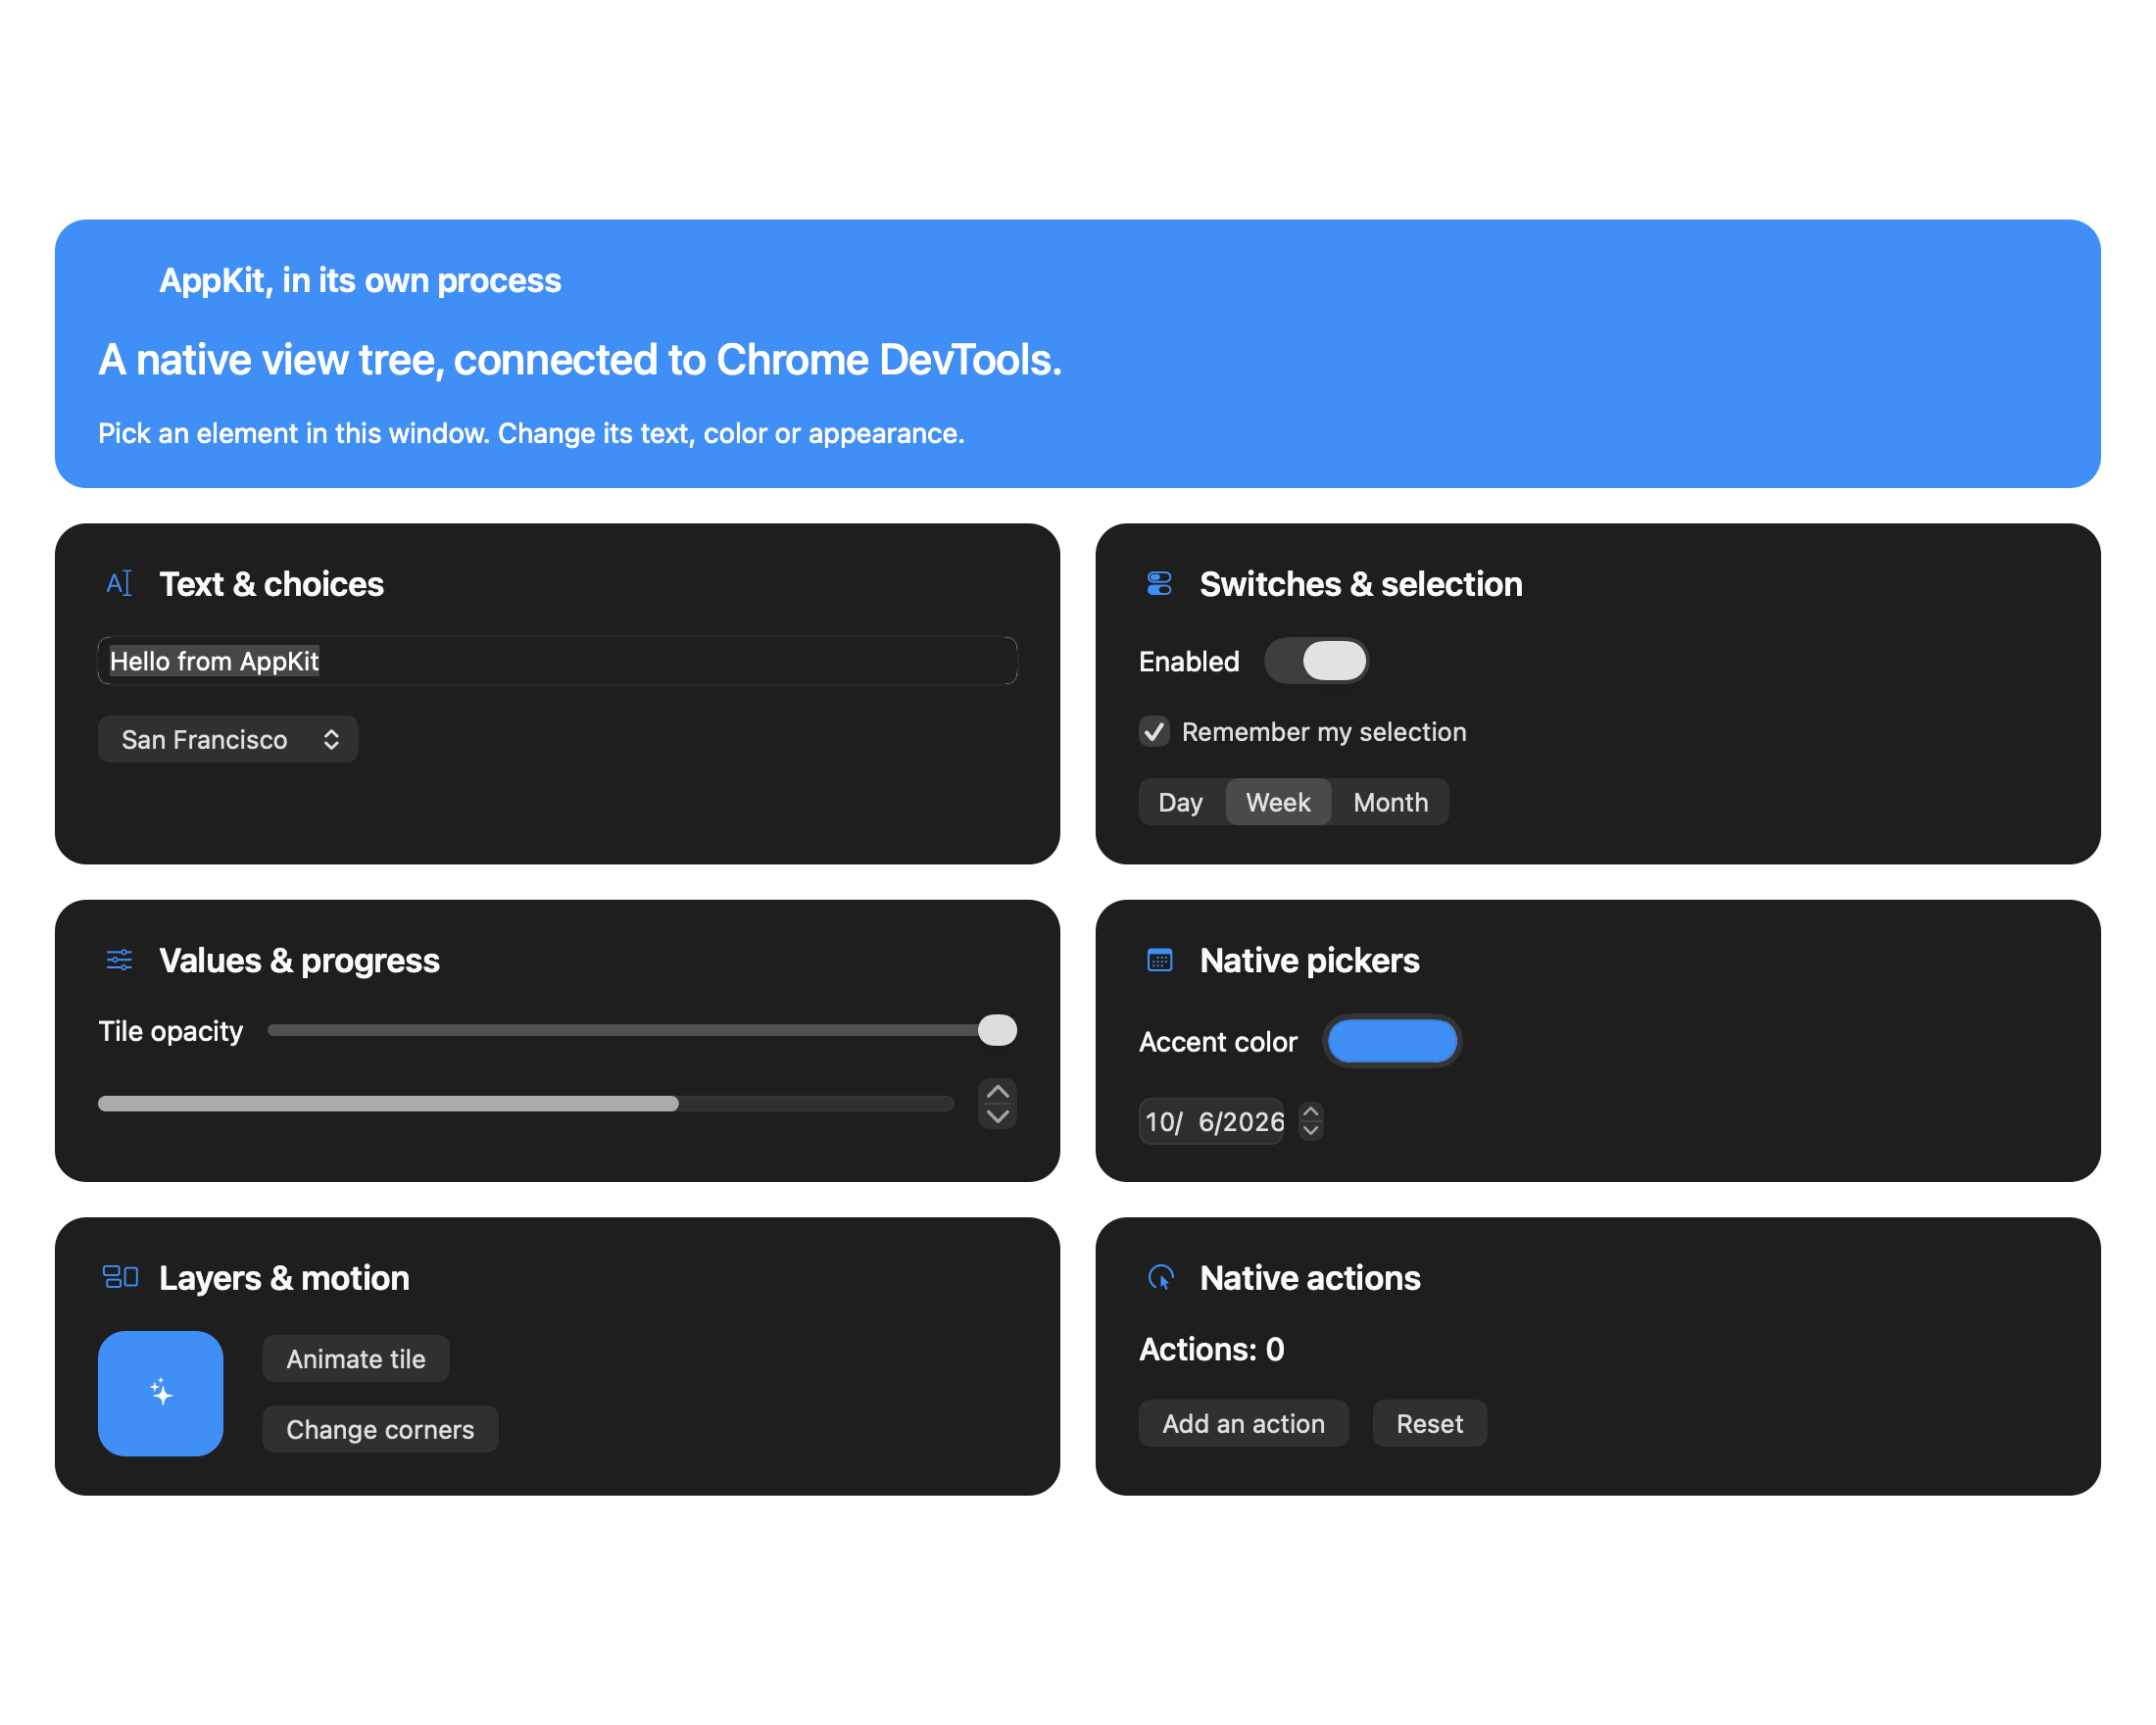
Install and try it
Requires macOS 13+, Node.js 22+, Google Chrome, and Xcode or the Xcode Command Line Tools with Swift and LLDB.
git clone https://github.com/dashersw/macinspector.git
cd macinspector
npm install
npm run demo
This builds and launches the included Swift/AppKit showcase and opens DevTools in Chrome. The frontend includes Swift highlighting; no browser extension is needed. The first install downloads its pinned DevTools assets.
Use ⌘+ / ⌘− to zoom the inspector UI and ⌘0 to reset it. The zoom level is saved across reloads.
For the UIKit demo, install full Xcode and an iOS Simulator runtime, then run
npm run demo -- --platform ios. See iOS setup to use it
with your own app.
The CLI chooses free loopback ports and prints the preview and DevTools URLs. It prefers 9333 for DevTools when available. Ctrl+C stops the debugger and its demo app.
Inspect and debug
- In Elements, enable the picker with ⌘⇧C, then click a control in the native app. Inspector clicks select the control without activating it.
- Select an element and edit its appearance in Styles. Toggle declarations to compare changes. Expand a dropdown to inspect its native menu items.
- In Sources, open
demo/macos/main.swift. Set a breakpoint onincrementCount()insideincrement(), then click Add an action in the app. Use F11 to step in, F10 to step over, and F8 to resume. Addself.actionCountto Watch to see the native value change.
# Choose different ports, or open DevTools yourself.
node bin/macinspector.mjs demo --port 9343 --native-port 9344
node bin/macinspector.mjs demo --no-open

# Inspect the UI without attaching LLDB.
node bin/macinspector.mjs demo --no-source-debug
Use it with another app
Choose a running app interactively, or attach by name or bundle ID. The CLI finds its SDK connection automatically, chooses a free port and opens DevTools. If the app has no SDK connection, it falls back to macOS Accessibility:
node bin/macinspector.mjs attach
node bin/macinspector.mjs attach "Native Mac Showcase"
node bin/macinspector.mjs attach com.dashersw.macinspector.showcase --source-debug

# List running apps and their PIDs; use --json for scripts.
node bin/macinspector.mjs apps

# A specific PID is useful when multiple instances have the same bundle ID.
node bin/macinspector.mjs attach --pid 12345
Names and bundle IDs match exactly, ignoring case. Ambiguous matches report the
matching processes so you can choose explicitly. The list contains user-facing
GUI apps; use --pid for background processes. Ctrl+C closes the inspector
and leaves the attached app running.
| Capability | AppKit SDK | macOS Accessibility fallback |
|---|---|---|
| Tree and picker | Actual native views and menus | Published accessible controls |
| Values and actions | Supported native controls | What the app exposes to Accessibility |
| Styles, constraints, screenshots | Yes | No |
| Native event registrations | Control/menu actions and gesture recognizers | No |
| Native breakpoints and stepping | --source-debug, with debug symbols and attach permission | Same LLDB requirements |
Grant the .build/debug/AccessibilityBridge helper access in System Settings
→ Privacy & Security → Accessibility. This mode exposes the controls, values
and actions the app publishes to Accessibility. It has no general appearance
editing and may omit custom drawing.
For the full view hierarchy and live appearance edits, add MacInspector to your AppKit debug build using the steps below. It walks the actual native views; you do not need to register individual controls.
Add MacInspector to an Xcode project
-
Choose File → Add Package Dependencies and enter
https://github.com/dashersw/macinspector.git. Select Branch: main and add the MacInspector library product to your macOS app target. -
Add this import at the top of your app delegate or window controller file:
#if DEBUG
import MacInspector
#endif
Put this property and method inside that class:
#if DEBUG
private var inspector: NativeInspector?

func startInspector(window: NSWindow) throws {
    let instance = NativeInspector(window: window)
    try instance.start()
    inspector = instance
}
#endif
Call it once on the main thread after creating the window:
#if DEBUG
try startInspector(window: window)
#endif
Retain the inspector property for as long as you want the window inspected.
-
For a sandboxed app, allow Incoming Connections (Server) for your debug target under Signing & Capabilities → App Sandbox. No scheme variables, fixed ports or copied tokens are needed. The SDK generates a secret, binds to loopback and publishes a connection record readable only by your user.
-
Run your app, then attach from this repository:
node bin/macinspector.mjs attach "My App"Chrome opens with the native tree, live styles, layout, changes, console and picker. Ctrl+C closes the inspector and leaves your app running.
To use Chrome for native breakpoints and stepping, build Debug, uncheck
Edit Scheme → Run → Info → Debug executable so Xcode is not already attached,
and use node bin/macinspector.mjs attach "My App" --source-debug. Use your
actual running app name or bundle ID. macOS must permit LLDB to attach; hardened debug
builds need the com.apple.security.get-task-allow entitlement.
Source debugging needs debug symbols, available source files and permission to attach LLDB. While paused, the inspector keeps the last UI snapshot; resume to apply UI edits. Optimized or stripped apps limit source debugging. SwiftUI's logical component hierarchy is not exposed.
Inspect an iOS app
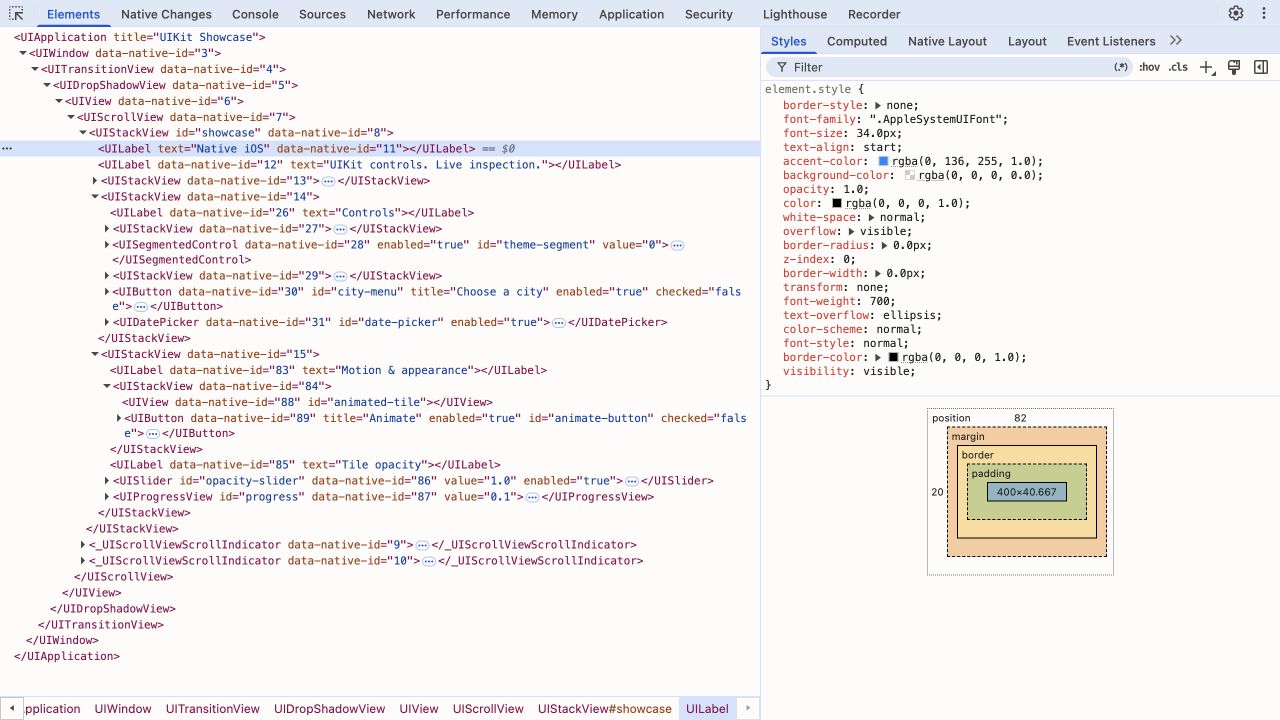
Requires full Xcode with an installed iOS Simulator runtime. Run the included UIKit showcase:
node bin/macinspector.mjs demo --platform ios
# Choose an installed simulator by name or UDID:
node bin/macinspector.mjs demo --platform ios --simulator "iPhone 17"
The CLI builds the app, boots a simulator, installs it and opens DevTools with
native source debugging enabled. It prefers a runtime compatible with the active
Xcode SDK. In Sources, open demo/ios/Showcase.swift, set a breakpoint on
incrementCount() inside increment(), then tap Add an action. Step in,
inspect self.actionCount, and resume. Turn the picker off before triggering a
control's action. Ctrl+C closes the inspector and its
demo app; the simulator stays open.
For your app (iOS 16+), choose File → Add Package Dependencies in Xcode,
enter https://github.com/dashersw/macinspector.git, select Branch: main, and
add the MacInspector library product to your iOS target. Add the guarded
import and retained property/method to your scene delegate or window owner:
#if DEBUG
import MacInspector
#endif
#if DEBUG
private var inspector: NativeInspector?

func startInspector(window: UIWindow) throws {
    let instance = NativeInspector(window: window)
    try instance.start()
    inspector = instance
}
#endif
After creating your view controller and calling window.makeKeyAndVisible(),
initialize the inspector on the main thread with that actual UIWindow:
#if DEBUG
do {
    try startInspector(window: window)
} catch {
    print("MacInspector: \(error.localizedDescription)")
}
#endif
Run the Debug build, detach Xcode's debugger, then attach using its bundle ID:
node bin/macinspector.mjs attach com.example.myapp --platform ios --source-debug
# Inspect the UI while leaving Xcode's source debugger attached:
node bin/macinspector.mjs attach com.example.myapp --platform ios
UIKit supports the native view tree, editable appearance, control values/actions,
touch picker, screenshots, Auto Layout, changes/undo, saved overrides and simulator
breakpoints/stepping. Menus expose UIMenu/UIAction titles and state. Control
listeners use UIKit's public target/action API; gesture target lists and closure
bodies are unavailable. iOS requires the SDK; there is no Accessibility fallback.
In Simulator, the picker continuously highlights the view under the Mac pointer
before clicking. Keep the target window visible with device bezels enabled.
Automated attachment and source debugging currently target Simulator. Physical
device discovery, USB forwarding and remote LLDB are not implemented.
See UIKit support and limits for details.
Inspect native layout
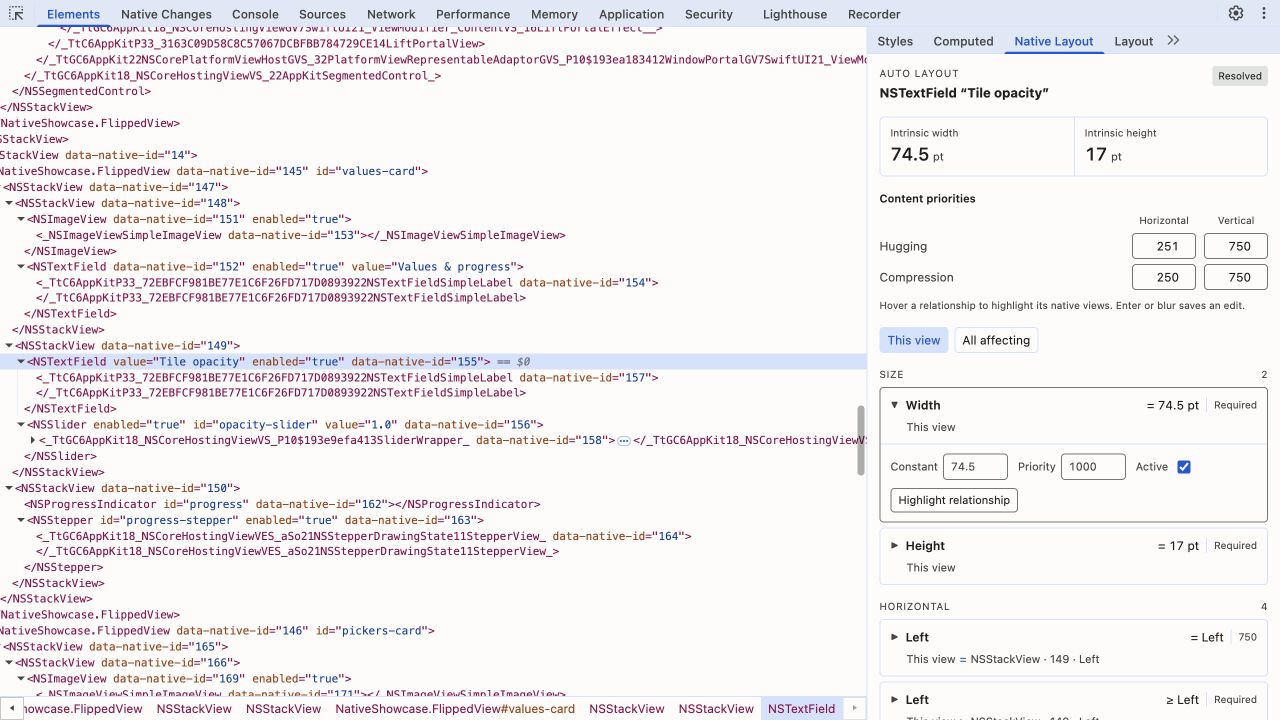
Select a view in Elements → Native Layout. The panel shows constraints, priorities, intrinsic sizes, ambiguity and autoresizing-mask translation. Hover a constraint to highlight its related views in the app. Change its constant, priority or active state directly; press Enter or leave the field to save. Hugging and compression priorities are also editable. Values use native points. Relationships are grouped by size and axis. This view shows direct constraints; All affecting includes constraints the native framework uses to resolve layout. Controls are labeled by their identifier or text; saved hierarchy paths stay internal.
Give important constraints unique identifiers to make saved edits stable:
let width = tile.widthAnchor.constraint(equalToConstant: 64)
width.identifier = "tile.width"
width.isActive = true
Inspect native handlers
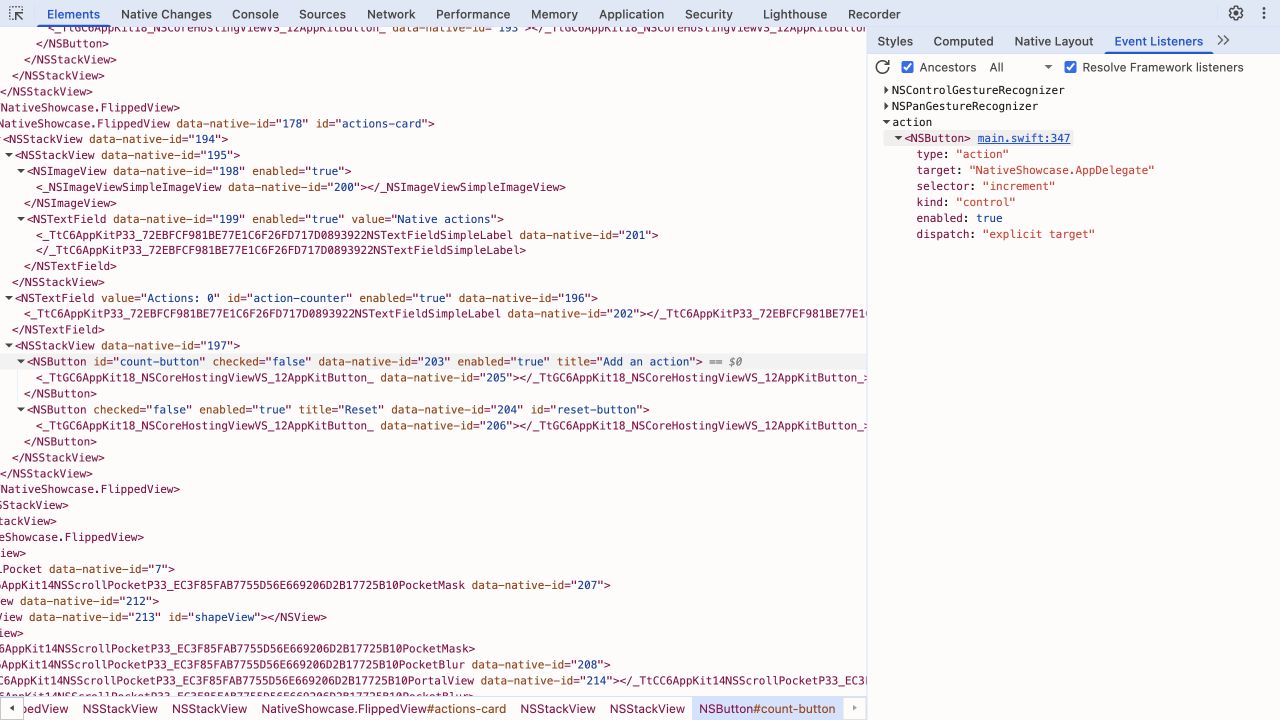
Select a control in Elements → Event Listeners. Expand action to see its AppKit target and selector, then follow the source link to set a native breakpoint. UIKit controls expose events such as touchUpInside and valueChanged. Gesture recognizers appear under their native class names. Handler properties include the selector, target class, dispatch through an explicit target or the responder chain, and enabled state. Internal AppKit handlers are visible too.
getEventListeners($0) in Console lists the latest snapshot's handler metadata.
The CDP endpoint implements DOMDebugger.getEventListeners, including subtree
queries. These are native registrations: browser capture/passive/once flags do
not apply. Removing handlers or toggling passive dispatch is disabled. Notifications,
Combine subscriptions, delegates and arbitrary closures are not enumerated.
Accessibility attachment cannot expose these registrations.
Source links need LLDB, matching debug symbols and local source files. The demo
enables LLDB by default; for another app, use
node bin/macinspector.mjs attach "My App" --source-debug with a Debug build.
If a link opens handler metadata, its message distinguishes source debugging
being disabled, an unresolved handler address, or enabled debugging with no
readable source. Internal framework handlers often have no available source; this
does not prevent breakpoints or stepping in your own app's code. In the demo,
Add an action → increment() opens the Swift handler.
Keep your edits
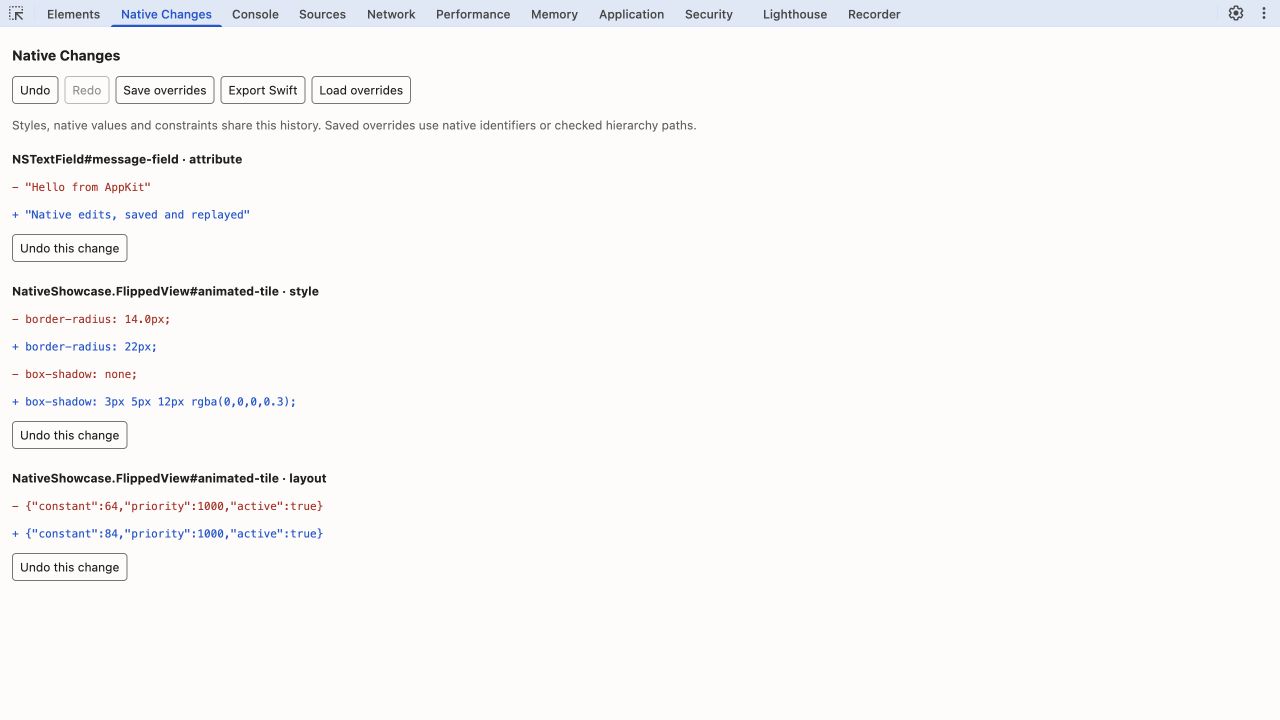
Open Native Changes beside Elements. Styles, native attribute edits and constraint edits share one history. Use Undo, Redo, or Undo this change. Overlapping later edits must be undone first; control actions are not undoable.
Save overrides downloads a JSON file. Load it from the panel or reapply it when attaching:
node bin/macinspector.mjs attach "My App" --overrides macinspector-overrides.json
# Save the current overrides when Ctrl+C closes the inspector:
node bin/macinspector.mjs attach "My App" --save-overrides macinspector-overrides.json
Export Swift downloads a snippet calling inspector.applyOverrides(...).
Put it after creating your views in a debug build. Overrides prefer unique view
and constraint identifiers; hierarchy paths are checked against native classes.
They do not rewrite your source files or replace Auto Layout.
See the integration guide for console examples, supported style properties and frontend details.
Development
npm run check
npm test
swift test --jobs 1
See the integration guide for frontend and debugging details.
License
MIT. Bundled dependencies include their own license files.
Similar repos


Chrome DevTools for native macOS and iOS apps: inspect views, edit styles, and debug Swift with AppKit and UIKit.
JavaScript
0
1 commits
updated Oct 7, 2026
See what people are saying
README
MacInspector
Chrome DevTools for native macOS and iOS apps.
Native UI debugging should be as immediate as web debugging: pick a control, inspect its properties, change its appearance and see the result. MacInspector brings that workflow to AppKit and UIKit, with native breakpoints and line-by-line stepping in the same window.
- Elements: the real native hierarchy, with tags such as
<NSTextField>, control attributes, bounds and dropdown items. Pick controls directly in the app. - Styles: edit colors, fonts, shadows, transforms, text formatting and native stack spacing live. Appearance stays in the right panel, keeping the element tree readable.
- Sources: read Swift with syntax highlighting, set breakpoints, step through native code and inspect variables through LLDB.
- Native Layout: inspect real Auto Layout constraints, intrinsic sizes, hugging and compression resistance. Highlight relationships and edit constants live.
- Event Listeners: see native control handlers with source links when debug symbols are available. AppKit also exposes menu actions and gesture recognizers.
- Native Changes: review edits, undo or redo, export Swift and save overrides to reapply after relaunch.
Install and try it
Requires macOS 13+, Node.js 22+, Google Chrome, and Xcode or the Xcode Command Line Tools with Swift and LLDB.
git clone https://github.com/dashersw/macinspector.git
cd macinspector
npm install
npm run demo
This builds and launches the included Swift/AppKit showcase and opens DevTools in Chrome. The frontend includes Swift highlighting; no browser extension is needed. The first install downloads its pinned DevTools assets.
Use ⌘+ / ⌘− to zoom the inspector UI and ⌘0 to reset it. The zoom level is saved across reloads.
For the UIKit demo, install full Xcode and an iOS Simulator runtime, then run
npm run demo -- --platform ios. See iOS setup to use it
with your own app.
The CLI chooses free loopback ports and prints the preview and DevTools URLs. It prefers 9333 for DevTools when available. Ctrl+C stops the debugger and its demo app.
Inspect and debug
- In Elements, enable the picker with ⌘⇧C, then click a control in the native app. Inspector clicks select the control without activating it.
- Select an element and edit its appearance in Styles. Toggle declarations to compare changes. Expand a dropdown to inspect its native menu items.
- In Sources, open
demo/macos/main.swift. Set a breakpoint onincrementCount()insideincrement(), then click Add an action in the app. Use F11 to step in, F10 to step over, and F8 to resume. Addself.actionCountto Watch to see the native value change.
# Choose different ports, or open DevTools yourself.
node bin/macinspector.mjs demo --port 9343 --native-port 9344
node bin/macinspector.mjs demo --no-open

# Inspect the UI without attaching LLDB.
node bin/macinspector.mjs demo --no-source-debug
Use it with another app
Choose a running app interactively, or attach by name or bundle ID. The CLI finds its SDK connection automatically, chooses a free port and opens DevTools. If the app has no SDK connection, it falls back to macOS Accessibility:
node bin/macinspector.mjs attach
node bin/macinspector.mjs attach "Native Mac Showcase"
node bin/macinspector.mjs attach com.dashersw.macinspector.showcase --source-debug

# List running apps and their PIDs; use --json for scripts.
node bin/macinspector.mjs apps

# A specific PID is useful when multiple instances have the same bundle ID.
node bin/macinspector.mjs attach --pid 12345
Names and bundle IDs match exactly, ignoring case. Ambiguous matches report the
matching processes so you can choose explicitly. The list contains user-facing
GUI apps; use --pid for background processes. Ctrl+C closes the inspector
and leaves the attached app running.
| Capability | AppKit SDK | macOS Accessibility fallback |
|---|---|---|
| Tree and picker | Actual native views and menus | Published accessible controls |
| Values and actions | Supported native controls | What the app exposes to Accessibility |
| Styles, constraints, screenshots | Yes | No |
| Native event registrations | Control/menu actions and gesture recognizers | No |
| Native breakpoints and stepping | --source-debug, with debug symbols and attach permission | Same LLDB requirements |
Grant the .build/debug/AccessibilityBridge helper access in System Settings
→ Privacy & Security → Accessibility. This mode exposes the controls, values
and actions the app publishes to Accessibility. It has no general appearance
editing and may omit custom drawing.
For the full view hierarchy and live appearance edits, add MacInspector to your AppKit debug build using the steps below. It walks the actual native views; you do not need to register individual controls.
Add MacInspector to an Xcode project
-
Choose File → Add Package Dependencies and enter
https://github.com/dashersw/macinspector.git. Select Branch: main and add the MacInspector library product to your macOS app target. -
Add this import at the top of your app delegate or window controller file:
#if DEBUG
import MacInspector
#endif
Put this property and method inside that class:
#if DEBUG
private var inspector: NativeInspector?

func startInspector(window: NSWindow) throws {
    let instance = NativeInspector(window: window)
    try instance.start()
    inspector = instance
}
#endif
Call it once on the main thread after creating the window:
#if DEBUG
try startInspector(window: window)
#endif
Retain the inspector property for as long as you want the window inspected.
-
For a sandboxed app, allow Incoming Connections (Server) for your debug target under Signing & Capabilities → App Sandbox. No scheme variables, fixed ports or copied tokens are needed. The SDK generates a secret, binds to loopback and publishes a connection record readable only by your user.
-
Run your app, then attach from this repository:
node bin/macinspector.mjs attach "My App"Chrome opens with the native tree, live styles, layout, changes, console and picker. Ctrl+C closes the inspector and leaves your app running.
To use Chrome for native breakpoints and stepping, build Debug, uncheck
Edit Scheme → Run → Info → Debug executable so Xcode is not already attached,
and use node bin/macinspector.mjs attach "My App" --source-debug. Use your
actual running app name or bundle ID. macOS must permit LLDB to attach; hardened debug
builds need the com.apple.security.get-task-allow entitlement.
Source debugging needs debug symbols, available source files and permission to attach LLDB. While paused, the inspector keeps the last UI snapshot; resume to apply UI edits. Optimized or stripped apps limit source debugging. SwiftUI's logical component hierarchy is not exposed.
Inspect an iOS app
Requires full Xcode with an installed iOS Simulator runtime. Run the included UIKit showcase:
node bin/macinspector.mjs demo --platform ios
# Choose an installed simulator by name or UDID:
node bin/macinspector.mjs demo --platform ios --simulator "iPhone 17"
The CLI builds the app, boots a simulator, installs it and opens DevTools with
native source debugging enabled. It prefers a runtime compatible with the active
Xcode SDK. In Sources, open demo/ios/Showcase.swift, set a breakpoint on
incrementCount() inside increment(), then tap Add an action. Step in,
inspect self.actionCount, and resume. Turn the picker off before triggering a
control's action. Ctrl+C closes the inspector and its
demo app; the simulator stays open.
For your app (iOS 16+), choose File → Add Package Dependencies in Xcode,
enter https://github.com/dashersw/macinspector.git, select Branch: main, and
add the MacInspector library product to your iOS target. Add the guarded
import and retained property/method to your scene delegate or window owner:
#if DEBUG
import MacInspector
#endif
#if DEBUG
private var inspector: NativeInspector?

func startInspector(window: UIWindow) throws {
    let instance = NativeInspector(window: window)
    try instance.start()
    inspector = instance
}
#endif
After creating your view controller and calling window.makeKeyAndVisible(),
initialize the inspector on the main thread with that actual UIWindow:
#if DEBUG
do {
    try startInspector(window: window)
} catch {
    print("MacInspector: \(error.localizedDescription)")
}
#endif
Run the Debug build, detach Xcode's debugger, then attach using its bundle ID:
node bin/macinspector.mjs attach com.example.myapp --platform ios --source-debug
# Inspect the UI while leaving Xcode's source debugger attached:
node bin/macinspector.mjs attach com.example.myapp --platform ios
UIKit supports the native view tree, editable appearance, control values/actions,
touch picker, screenshots, Auto Layout, changes/undo, saved overrides and simulator
breakpoints/stepping. Menus expose UIMenu/UIAction titles and state. Control
listeners use UIKit's public target/action API; gesture target lists and closure
bodies are unavailable. iOS requires the SDK; there is no Accessibility fallback.
In Simulator, the picker continuously highlights the view under the Mac pointer
before clicking. Keep the target window visible with device bezels enabled.
Automated attachment and source debugging currently target Simulator. Physical
device discovery, USB forwarding and remote LLDB are not implemented.
See UIKit support and limits for details.
Inspect native layout
Select a view in Elements → Native Layout. The panel shows constraints, priorities, intrinsic sizes, ambiguity and autoresizing-mask translation. Hover a constraint to highlight its related views in the app. Change its constant, priority or active state directly; press Enter or leave the field to save. Hugging and compression priorities are also editable. Values use native points. Relationships are grouped by size and axis. This view shows direct constraints; All affecting includes constraints the native framework uses to resolve layout. Controls are labeled by their identifier or text; saved hierarchy paths stay internal.
Give important constraints unique identifiers to make saved edits stable:
let width = tile.widthAnchor.constraint(equalToConstant: 64)
width.identifier = "tile.width"
width.isActive = true
Inspect native handlers
Select a control in Elements → Event Listeners. Expand action to see its AppKit target and selector, then follow the source link to set a native breakpoint. UIKit controls expose events such as touchUpInside and valueChanged. Gesture recognizers appear under their native class names. Handler properties include the selector, target class, dispatch through an explicit target or the responder chain, and enabled state. Internal AppKit handlers are visible too.
getEventListeners($0) in Console lists the latest snapshot's handler metadata.
The CDP endpoint implements DOMDebugger.getEventListeners, including subtree
queries. These are native registrations: browser capture/passive/once flags do
not apply. Removing handlers or toggling passive dispatch is disabled. Notifications,
Combine subscriptions, delegates and arbitrary closures are not enumerated.
Accessibility attachment cannot expose these registrations.
Source links need LLDB, matching debug symbols and local source files. The demo
enables LLDB by default; for another app, use
node bin/macinspector.mjs attach "My App" --source-debug with a Debug build.
If a link opens handler metadata, its message distinguishes source debugging
being disabled, an unresolved handler address, or enabled debugging with no
readable source. Internal framework handlers often have no available source; this
does not prevent breakpoints or stepping in your own app's code. In the demo,
Add an action → increment() opens the Swift handler.
Keep your edits
Open Native Changes beside Elements. Styles, native attribute edits and constraint edits share one history. Use Undo, Redo, or Undo this change. Overlapping later edits must be undone first; control actions are not undoable.
Save overrides downloads a JSON file. Load it from the panel or reapply it when attaching:
node bin/macinspector.mjs attach "My App" --overrides macinspector-overrides.json
# Save the current overrides when Ctrl+C closes the inspector:
node bin/macinspector.mjs attach "My App" --save-overrides macinspector-overrides.json
Export Swift downloads a snippet calling inspector.applyOverrides(...).
Put it after creating your views in a debug build. Overrides prefer unique view
and constraint identifiers; hierarchy paths are checked against native classes.
They do not rewrite your source files or replace Auto Layout.
See the integration guide for console examples, supported style properties and frontend details.
Development
npm run check
npm test
swift test --jobs 1
See the integration guide for frontend and debugging details.
License
MIT. Bundled dependencies include their own license files.