
Detects 5 silent NATS JetStream delivery violations (duplicate messages, data loss, stalls) with zero code changes. 200-round eval CI >= 98.1%. arXiv:2609.35310.
See the codeSee what people are saying
README
nats-lens
JetStream Health Monitor — detects delivery guarantee violations in NATS JetStream in real time, across any language or framework.



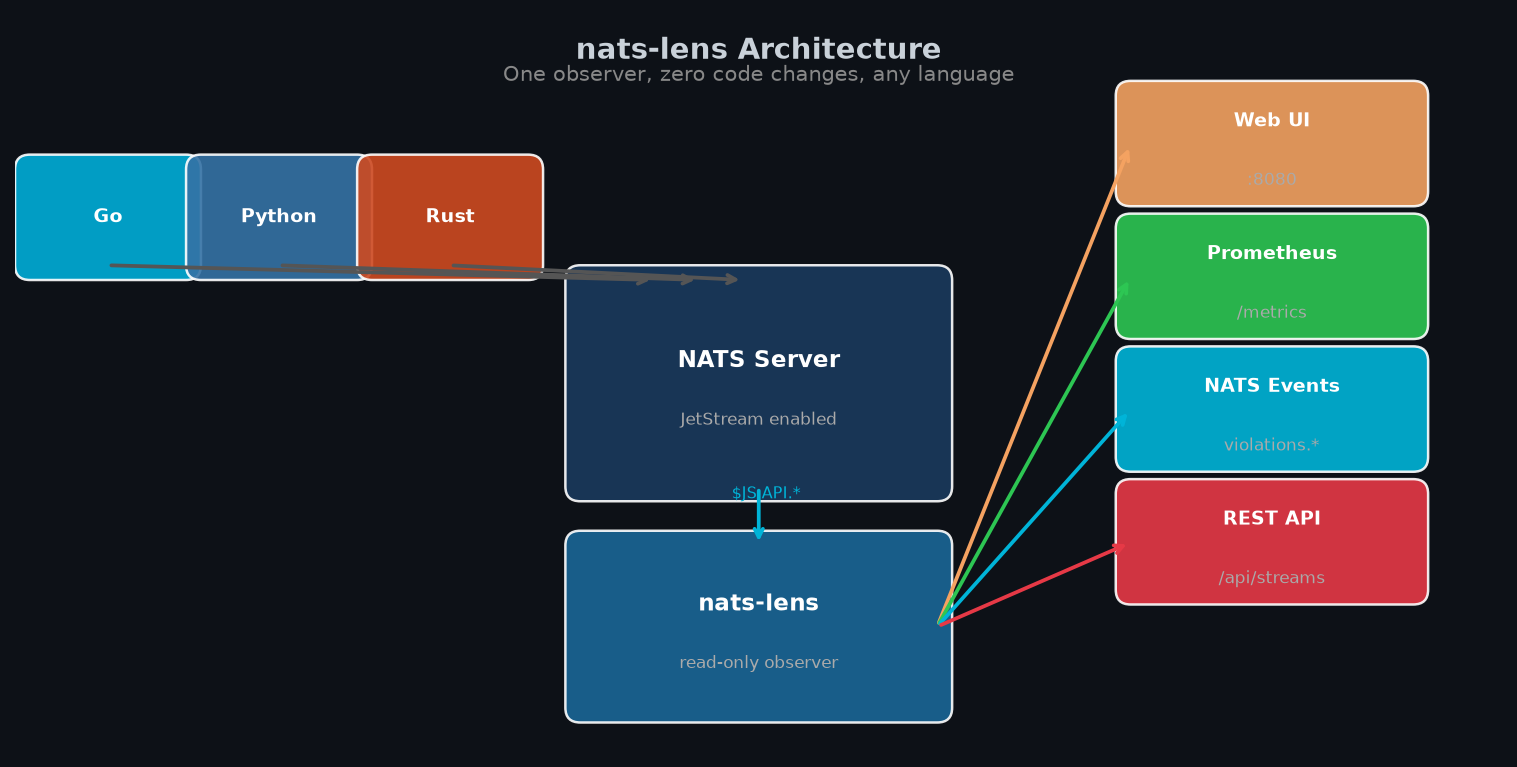
nats-lens connects to your NATS server as a read-only observer, detects the five configuration mistakes that silently break JetStream's at-least-once delivery guarantee, and tells you exactly how to fix them — with zero changes to your application code.
The Problem
NATS JetStream claims at-least-once delivery. But five common configuration mistakes silently violate this guarantee — producing duplicate messages, data loss, or redelivery storms — without any error in your application logs.
Standard monitoring tools (Prometheus, Datadog, existing NATS dashboards) show throughput metrics. None detect delivery correctness failures.
nats-lens detects all five.
Install
Option 1 — Desktop App (nats-studio)
The easiest way. A native macOS/Linux/Windows app with a graphical interface.
# macOS (Apple Silicon)
curl -L https://github.com/biplabku/nats-lens/releases/latest/download/nats-studio-macos-aarch64.dmg -o nats-studio.dmg
open nats-studio.dmg

# macOS (Intel)
curl -L https://github.com/biplabku/nats-lens/releases/latest/download/nats-studio-macos-x86_64.dmg -o nats-studio.dmg
open nats-studio.dmg
Launch the app → enter your NATS server URL → monitoring starts immediately.
Option 2 — cargo install (CLI + Web UI)
cargo install nats-lens

# Run against your NATS server
nats-lens --nats nats://localhost:4222 --port 8080

# Open the web dashboard
open http://localhost:8080
Option 3 — Docker
docker run -p 8080:8080 ghcr.io/biplabku/nats-lens:latest \
  --nats nats://your-nats-server:4222
Option 4 — Pre-built binary (no Rust required)
# macOS (Apple Silicon)
curl -L https://github.com/biplabku/nats-lens/releases/latest/download/nats-lens-macos-aarch64 \
  -o nats-lens && chmod +x nats-lens && sudo mv nats-lens /usr/local/bin/

# macOS (Intel)
curl -L https://github.com/biplabku/nats-lens/releases/latest/download/nats-lens-macos-x86_64 \
  -o nats-lens && chmod +x nats-lens && sudo mv nats-lens /usr/local/bin/

# Linux
curl -L https://github.com/biplabku/nats-lens/releases/latest/download/nats-lens-linux-x86_64 \
  -o nats-lens && chmod +x nats-lens && sudo mv nats-lens /usr/local/bin/
Option 5 — Kubernetes sidecar
containers:
- name: nats-lens
  image: ghcr.io/biplabku/nats-lens:latest
  args: ["--nats", "$(NATS_URL)"]
  ports:
  - containerPort: 8080   # Web UI + REST API
Quick Start (CLI)
# 1. Start a local NATS server with JetStream
docker run -d --name nats -p 4222:4222 -p 8222:8222 nats:2.10-alpine --js

# 2. Install nats-lens
cargo install nats-lens

# 3. Run it
nats-lens --nats nats://localhost:4222 --port 8080

# 4. Open the dashboard
open http://localhost:8080
nats-lens connects to your NATS server, discovers all streams and consumers automatically, and starts monitoring. No changes to your application code.
What It Detects
| Violation | What Happens | Visible To Existing Tools |
|---|---|---|
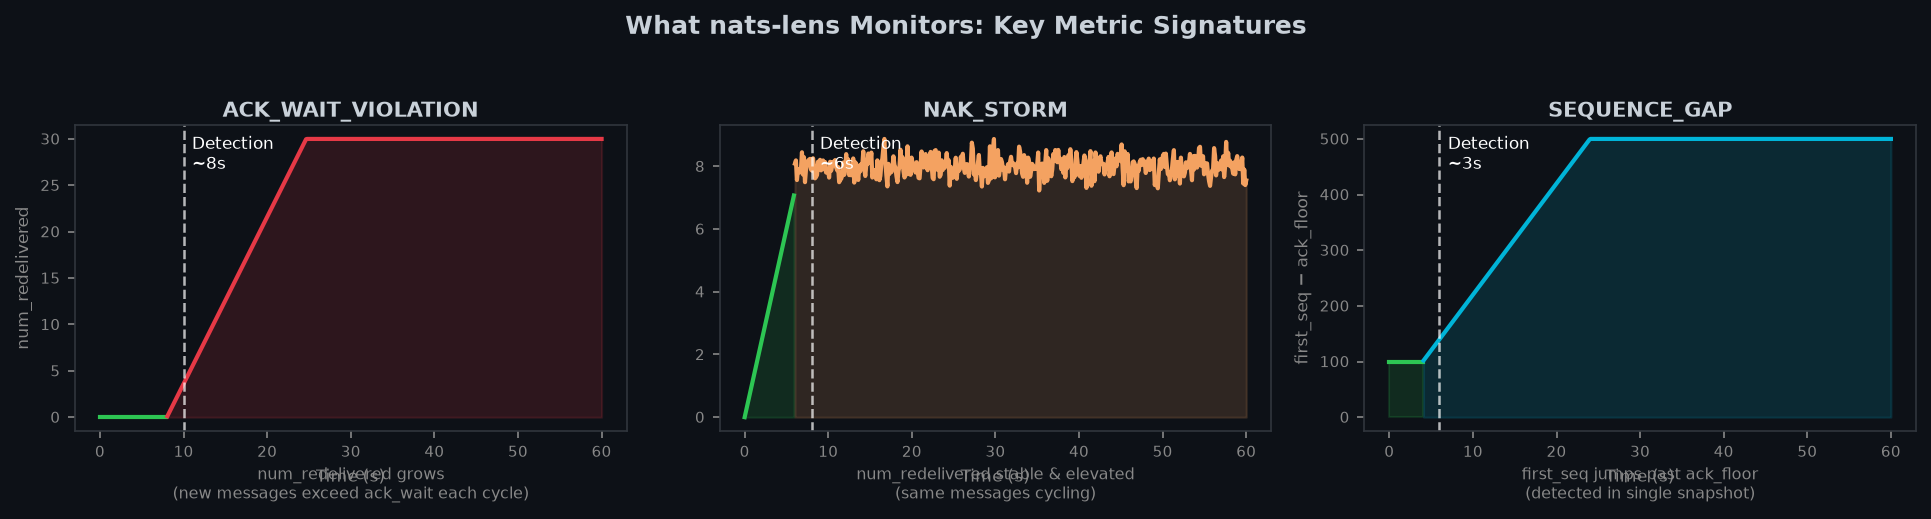
| ACK_WAIT_VIOLATION | ack_wait shorter than processing time → messages redelivered mid-processing → duplicate execution | ❌ No |
| SEQUENCE_GAP | Stream hit retention limit, evicted messages before consumer could pull them → silent data loss | ❌ No |
| MAX_PENDING_THROTTLE | max_ack_pending too small for concurrency + prefetch → consumer throttled despite having capacity | ❌ No |
| NAK_STORM | Consumer NAKing stale messages → NATS redelivers → still stale → infinite redelivery loop | ❌ No |
| MISSING_PROGRESS | Long-running tasks not sending in-progress acks → ack_wait fires → duplicate execution | ❌ No |
Four Output Channels
nats-lens doesn't touch your application code. It reads stream and consumer state via the JetStream management API and exposes findings through:
1. Web Dashboard (+ nats-studio Desktop App)
http://localhost:8080
Dark-theme dashboard showing stream health, consumer metrics, and violation cards with one-click fix commands. The nats-studio desktop app wraps this in a native window.
2. Prometheus Metrics
http://localhost:8080/metrics
nats_lens_consumer_lag_msgs{stream="ORDERS",consumer="order-processor"} 142
nats_lens_ack_pending_ratio{stream="ORDERS",consumer="order-processor"} 1.0
nats_lens_violations_active{stream="ORDERS",consumer="order-processor",type="ACK_WAIT_VIOLATION"} 1
3. NATS Health Events
Subscribe to nats.lens.health.violations.> from any language — no code changes to your existing application:
# Python
import asyncio, json, nats

async def on_violation(msg):
    event = json.loads(msg.data)
    print(f"[{event['severity']}] {event['violation']['type']} on "
          f"{event['stream_name']}/{event['consumer_name']}")
    print(f"  Fix: {event['violation']['fix_command']}")

async def main():
    nc = await nats.connect("nats://localhost:4222")
    await nc.subscribe("nats.lens.health.violations.>", cb=on_violation)
    await asyncio.sleep(3600)

asyncio.run(main())
// Go
nc, _ := nats.Connect("nats://localhost:4222")
nc.Subscribe("nats.lens.health.violations.>", func(msg *nats.Msg) {
    fmt.Println(string(msg.Data))
})
Each event is structured JSON:
{
  "type": "ACK_WAIT_VIOLATION",
  "stream_name": "ORDERS",
  "consumer_name": "order-processor",
  "severity": "Critical",
  "description": "28 redeliveries/min — ack_wait (30s) shorter than processing time.",
  "detected_at": "2026-09-29T10:00:00Z",
  "violation": {
    "type": "ACK_WAIT_VIOLATION",
    "redeliveries_per_min": 28.4,
    "recommended_ack_wait_secs": 117,
    "fix_command": "nats consumer edit ORDERS order-processor --ack-wait 1m57s"
  }
}
4. REST API
curl http://localhost:8080/api/streams
curl http://localhost:8080/api/history/ORDERS/order-processor
Language Examples
Python
import asyncio, json, nats

async def on_violation(msg):
    event = json.loads(msg.data)
    print(f"[{event['severity']}] {event['violation']['type']} on "
          f"{event['stream_name']}/{event['consumer_name']}")
    print(f"  Fix: {event['violation']['fix_command']}")

async def main():
    nc = await nats.connect("nats://localhost:4222")
    await nc.subscribe("nats.lens.health.violations.>", cb=on_violation)
    await asyncio.sleep(3600)

asyncio.run(main())
Go
nc, _ := nats.Connect("nats://localhost:4222")
nc.Subscribe("nats.lens.health.violations.>", func(msg *nats.Msg) {
    var event map[string]interface{}
    json.Unmarshal(msg.Data, &event)
    v := event["violation"].(map[string]interface{})
    fmt.Printf("[%s] %s on %s/%s\n  Fix: %s\n",
        event["severity"], v["type"],
        event["stream_name"], event["consumer_name"], v["fix_command"])
})
select {}
Rust
let nc = async_nats::connect("nats://localhost:4222").await?;
let mut sub = nc.subscribe("nats.lens.health.violations.>").await?;
while let Some(msg) = sub.next().await {
    let event: serde_json::Value = serde_json::from_slice(&msg.payload)?;
    println!("[{}] {} on {}/{}", event["severity"], event["violation"]["type"],
             event["stream_name"], event["consumer_name"]);
}
Node.js
const { connect, StringCodec } = require("nats");
const nc = await connect({ servers: "nats://localhost:4222" });
const sub = nc.subscribe("nats.lens.health.violations.>");
for await (const msg of sub) {
    const event = JSON.parse(StringCodec().decode(msg.data));
    console.log(`[${event.severity}] ${event.violation.type} → ${event.violation.fix_command}`);
}
Java
Dispatcher d = nc.createDispatcher(msg -> {
    JSONObject event = new JSONObject(new String(msg.getData()));
    System.out.printf("[%s] %s on %s/%s%n  Fix: %s%n",
        event.getString("severity"),
        event.getJSONObject("violation").getString("type"),
        event.getString("stream_name"), event.getString("consumer_name"),
        event.getJSONObject("violation").optString("fix_command"));
});
d.subscribe("nats.lens.health.violations.>");
CLI Reference
nats-lens [OPTIONS] [COMMAND]

Commands:
  init    Pre-deployment audit — checks consumer configs before connecting
          (exits non-zero on critical issues, suitable for CI/CD gates)

Options:
  --nats <URL>        NATS server URL [default: nats://localhost:4222]
  --port <PORT>       Web UI and API port [default: 8080]
  --interval <SECS>   Poll interval in seconds [default: 5]
  --auto-fix          Automatically apply fix commands when violations detected
  -h, --help          Print help
  -V, --version       Print version
Pre-deployment audit (CI/CD)
# Check consumer configs before deploying — fails if any critical violation detected
nats-lens --nats nats://localhost:4222 init --fail-on-critical
Fix violations automatically
nats-lens --nats nats://localhost:4222 --auto-fix
Understanding Fix Commands
Every violation card includes the exact NATS CLI command to fix it:
ACK_WAIT_VIOLATION on ORDERS/order-processor:
  Measured P99 processing: ~47s
  Current ack_wait: 30s  ← too short
  Fix: nats consumer edit ORDERS order-processor --ack-wait 1m57s
Grafana Dashboard
Import docs/grafana-dashboard.json into Grafana for pre-built panels showing consumer lag, redelivery rates, and violation history.
Security
nats-lens reads only from JetStream management API subjects ($JS.API.*). It never reads message payloads. For production use, run with a dedicated NATS user scoped to monitoring subjects only.
# Minimum required permissions (monitoring only):
$JS.API.STREAM.LIST
$JS.API.CONSUMER.LIST.*
$JS.API.CONSUMER.INFO.*.*

# Additional (for --auto-fix):
$JS.API.CONSUMER.UPDATE.*.*
$JS.API.STREAM.UPDATE.*
Research
nats-lens is associated with the paper:
"Configuration-Induced Delivery Failures in NATS JetStream: Detection and Remediation" Biplab Kumar Das. arXiv:2609.35310, 2026. Submitted to IEEE Transactions on Network and Service Management.
The five violation types are formally characterized with proofs of their failure conditions, an impossibility result showing Prometheus cannot detect them, and a detection latency guarantee of k × T_poll seconds validated across 200 controlled rounds (CI ≥ 98.1%).
License
MIT — see LICENSE.
Similar repos


Languages
Rust
39.5%
TeX
25.0%
HTML
17.3%
Python
12.2%
Shell
3.5%
Go
2.1%
Detects 5 silent NATS JetStream delivery violations (duplicate messages, data loss, stalls) with zero code changes. 200-round eval CI >= 98.1%. arXiv:2609.35310.
See the codeSee what people are saying
README
nats-lens
JetStream Health Monitor — detects delivery guarantee violations in NATS JetStream in real time, across any language or framework.
nats-lens connects to your NATS server as a read-only observer, detects the five configuration mistakes that silently break JetStream's at-least-once delivery guarantee, and tells you exactly how to fix them — with zero changes to your application code.
The Problem
NATS JetStream claims at-least-once delivery. But five common configuration mistakes silently violate this guarantee — producing duplicate messages, data loss, or redelivery storms — without any error in your application logs.
Standard monitoring tools (Prometheus, Datadog, existing NATS dashboards) show throughput metrics. None detect delivery correctness failures.
nats-lens detects all five.
Install
Option 1 — Desktop App (nats-studio)
The easiest way. A native macOS/Linux/Windows app with a graphical interface.
# macOS (Apple Silicon)
curl -L https://github.com/biplabku/nats-lens/releases/latest/download/nats-studio-macos-aarch64.dmg -o nats-studio.dmg
open nats-studio.dmg

# macOS (Intel)
curl -L https://github.com/biplabku/nats-lens/releases/latest/download/nats-studio-macos-x86_64.dmg -o nats-studio.dmg
open nats-studio.dmg
Launch the app → enter your NATS server URL → monitoring starts immediately.
Option 2 — cargo install (CLI + Web UI)
cargo install nats-lens

# Run against your NATS server
nats-lens --nats nats://localhost:4222 --port 8080

# Open the web dashboard
open http://localhost:8080
Option 3 — Docker
docker run -p 8080:8080 ghcr.io/biplabku/nats-lens:latest \
  --nats nats://your-nats-server:4222
Option 4 — Pre-built binary (no Rust required)
# macOS (Apple Silicon)
curl -L https://github.com/biplabku/nats-lens/releases/latest/download/nats-lens-macos-aarch64 \
  -o nats-lens && chmod +x nats-lens && sudo mv nats-lens /usr/local/bin/

# macOS (Intel)
curl -L https://github.com/biplabku/nats-lens/releases/latest/download/nats-lens-macos-x86_64 \
  -o nats-lens && chmod +x nats-lens && sudo mv nats-lens /usr/local/bin/

# Linux
curl -L https://github.com/biplabku/nats-lens/releases/latest/download/nats-lens-linux-x86_64 \
  -o nats-lens && chmod +x nats-lens && sudo mv nats-lens /usr/local/bin/
Option 5 — Kubernetes sidecar
containers:
- name: nats-lens
  image: ghcr.io/biplabku/nats-lens:latest
  args: ["--nats", "$(NATS_URL)"]
  ports:
  - containerPort: 8080   # Web UI + REST API
Quick Start (CLI)
# 1. Start a local NATS server with JetStream
docker run -d --name nats -p 4222:4222 -p 8222:8222 nats:2.10-alpine --js

# 2. Install nats-lens
cargo install nats-lens

# 3. Run it
nats-lens --nats nats://localhost:4222 --port 8080

# 4. Open the dashboard
open http://localhost:8080
nats-lens connects to your NATS server, discovers all streams and consumers automatically, and starts monitoring. No changes to your application code.
What It Detects
| Violation | What Happens | Visible To Existing Tools |
|---|---|---|
| ACK_WAIT_VIOLATION | ack_wait shorter than processing time → messages redelivered mid-processing → duplicate execution | ❌ No |
| SEQUENCE_GAP | Stream hit retention limit, evicted messages before consumer could pull them → silent data loss | ❌ No |
| MAX_PENDING_THROTTLE | max_ack_pending too small for concurrency + prefetch → consumer throttled despite having capacity | ❌ No |
| NAK_STORM | Consumer NAKing stale messages → NATS redelivers → still stale → infinite redelivery loop | ❌ No |
| MISSING_PROGRESS | Long-running tasks not sending in-progress acks → ack_wait fires → duplicate execution | ❌ No |
Four Output Channels
nats-lens doesn't touch your application code. It reads stream and consumer state via the JetStream management API and exposes findings through:
1. Web Dashboard (+ nats-studio Desktop App)
http://localhost:8080
Dark-theme dashboard showing stream health, consumer metrics, and violation cards with one-click fix commands. The nats-studio desktop app wraps this in a native window.
2. Prometheus Metrics
http://localhost:8080/metrics
nats_lens_consumer_lag_msgs{stream="ORDERS",consumer="order-processor"} 142
nats_lens_ack_pending_ratio{stream="ORDERS",consumer="order-processor"} 1.0
nats_lens_violations_active{stream="ORDERS",consumer="order-processor",type="ACK_WAIT_VIOLATION"} 1
3. NATS Health Events
Subscribe to nats.lens.health.violations.> from any language — no code changes to your existing application:
# Python
import asyncio, json, nats

async def on_violation(msg):
    event = json.loads(msg.data)
    print(f"[{event['severity']}] {event['violation']['type']} on "
          f"{event['stream_name']}/{event['consumer_name']}")
    print(f"  Fix: {event['violation']['fix_command']}")

async def main():
    nc = await nats.connect("nats://localhost:4222")
    await nc.subscribe("nats.lens.health.violations.>", cb=on_violation)
    await asyncio.sleep(3600)

asyncio.run(main())
// Go
nc, _ := nats.Connect("nats://localhost:4222")
nc.Subscribe("nats.lens.health.violations.>", func(msg *nats.Msg) {
    fmt.Println(string(msg.Data))
})
Each event is structured JSON:
{
  "type": "ACK_WAIT_VIOLATION",
  "stream_name": "ORDERS",
  "consumer_name": "order-processor",
  "severity": "Critical",
  "description": "28 redeliveries/min — ack_wait (30s) shorter than processing time.",
  "detected_at": "2026-09-29T10:00:00Z",
  "violation": {
    "type": "ACK_WAIT_VIOLATION",
    "redeliveries_per_min": 28.4,
    "recommended_ack_wait_secs": 117,
    "fix_command": "nats consumer edit ORDERS order-processor --ack-wait 1m57s"
  }
}
4. REST API
curl http://localhost:8080/api/streams
curl http://localhost:8080/api/history/ORDERS/order-processor
Language Examples
Python
import asyncio, json, nats

async def on_violation(msg):
    event = json.loads(msg.data)
    print(f"[{event['severity']}] {event['violation']['type']} on "
          f"{event['stream_name']}/{event['consumer_name']}")
    print(f"  Fix: {event['violation']['fix_command']}")

async def main():
    nc = await nats.connect("nats://localhost:4222")
    await nc.subscribe("nats.lens.health.violations.>", cb=on_violation)
    await asyncio.sleep(3600)

asyncio.run(main())
Go
nc, _ := nats.Connect("nats://localhost:4222")
nc.Subscribe("nats.lens.health.violations.>", func(msg *nats.Msg) {
    var event map[string]interface{}
    json.Unmarshal(msg.Data, &event)
    v := event["violation"].(map[string]interface{})
    fmt.Printf("[%s] %s on %s/%s\n  Fix: %s\n",
        event["severity"], v["type"],
        event["stream_name"], event["consumer_name"], v["fix_command"])
})
select {}
Rust
let nc = async_nats::connect("nats://localhost:4222").await?;
let mut sub = nc.subscribe("nats.lens.health.violations.>").await?;
while let Some(msg) = sub.next().await {
    let event: serde_json::Value = serde_json::from_slice(&msg.payload)?;
    println!("[{}] {} on {}/{}", event["severity"], event["violation"]["type"],
             event["stream_name"], event["consumer_name"]);
}
Node.js
const { connect, StringCodec } = require("nats");
const nc = await connect({ servers: "nats://localhost:4222" });
const sub = nc.subscribe("nats.lens.health.violations.>");
for await (const msg of sub) {
    const event = JSON.parse(StringCodec().decode(msg.data));
    console.log(`[${event.severity}] ${event.violation.type} → ${event.violation.fix_command}`);
}
Java
Dispatcher d = nc.createDispatcher(msg -> {
    JSONObject event = new JSONObject(new String(msg.getData()));
    System.out.printf("[%s] %s on %s/%s%n  Fix: %s%n",
        event.getString("severity"),
        event.getJSONObject("violation").getString("type"),
        event.getString("stream_name"), event.getString("consumer_name"),
        event.getJSONObject("violation").optString("fix_command"));
});
d.subscribe("nats.lens.health.violations.>");
CLI Reference
nats-lens [OPTIONS] [COMMAND]

Commands:
  init    Pre-deployment audit — checks consumer configs before connecting
          (exits non-zero on critical issues, suitable for CI/CD gates)

Options:
  --nats <URL>        NATS server URL [default: nats://localhost:4222]
  --port <PORT>       Web UI and API port [default: 8080]
  --interval <SECS>   Poll interval in seconds [default: 5]
  --auto-fix          Automatically apply fix commands when violations detected
  -h, --help          Print help
  -V, --version       Print version
Pre-deployment audit (CI/CD)
# Check consumer configs before deploying — fails if any critical violation detected
nats-lens --nats nats://localhost:4222 init --fail-on-critical
Fix violations automatically
nats-lens --nats nats://localhost:4222 --auto-fix
Understanding Fix Commands
Every violation card includes the exact NATS CLI command to fix it:
ACK_WAIT_VIOLATION on ORDERS/order-processor:
  Measured P99 processing: ~47s
  Current ack_wait: 30s  ← too short
  Fix: nats consumer edit ORDERS order-processor --ack-wait 1m57s
Grafana Dashboard
Import docs/grafana-dashboard.json into Grafana for pre-built panels showing consumer lag, redelivery rates, and violation history.
Security
nats-lens reads only from JetStream management API subjects ($JS.API.*). It never reads message payloads. For production use, run with a dedicated NATS user scoped to monitoring subjects only.
# Minimum required permissions (monitoring only):
$JS.API.STREAM.LIST
$JS.API.CONSUMER.LIST.*
$JS.API.CONSUMER.INFO.*.*

# Additional (for --auto-fix):
$JS.API.CONSUMER.UPDATE.*.*
$JS.API.STREAM.UPDATE.*
Research
nats-lens is associated with the paper:
"Configuration-Induced Delivery Failures in NATS JetStream: Detection and Remediation" Biplab Kumar Das. arXiv:2609.35310, 2026. Submitted to IEEE Transactions on Network and Service Management.
The five violation types are formally characterized with proofs of their failure conditions, an impossibility result showing Prometheus cannot detect them, and a detection latency guarantee of k × T_poll seconds validated across 200 controlled rounds (CI ≥ 98.1%).
License
MIT — see LICENSE.
Similar repos
Languages
Rust
39.5%
TeX
25.0%
HTML
17.3%
Python
12.2%
Shell
3.5%
Go
2.1%