
README
ARGODRIVE
Layout, balancer and instruments for running mixture-of-experts models from SSDs. A 518 GB model on a 128 GB laptop: every token waits on disk, so what matters is not how much bandwidth you own but how long the slowest required read takes.

The first fork row needs no extra hardware. Upstream's prefill sweep reads every expert of every routed layer, but a 512-token chunk only routes to 187 of 384 — so it reads about twice what the model touches. Fixing that alone is worth 1.73× prompt processing on one internal SSD, no replicas involved. Drives after that just shrink each split read further.
Every bar is a median of interleaved arms against pinned upstream bd66c40, all with the
same output SHA-256.
What it has done
| model | engine | baseline | best measured | gain |
|---|---|---|---|---|
| DeepSeek V4.1-Flash Q4, 518 GB on disk | ds4 fork | upstream ds4, one drive: 16.50 / 10.44 (vs our one-drive) · 16.23 / 10.61 (vs our three-drive) | one drive, no replicas: 28.04 / 14.38 · three drives: 43.62 / 17.38 | 1.70× / 2.69× |
| GLM-5.3, 744B | ds4 fork | our fork, one drive: 2.02 | four drives: 3.54 | 1.8× |
| Kimi K3, 2.78T | deltafin fork | our fork, one drive: 0.55 | four drives: 0.96 | 1.8× |
All on an M5 Max, 128 GB. Read the baselines carefully, because they are not the same kind of
number. The V4.1 row compares against the pinned upstream ds4 binary (bd66c40),
re-measured 2026-09-15 on the branch exactly as it ships, with a byte-identical output
SHA-256 on every arm. The one-drive and three-drive comparisons were separate interleaved
sessions, each with its own upstream control, which is why two baselines are quoted. The GLM and K3 rows are our own software scaling from one drive
to four, which is a storage result, not an engine comparison. GLM is 200-token generation;
K3 is the public 17-token prompt, a median of three runs at every rung. V4.1 is a 512-token
prompt with 200 generated, medians of interleaved pairs.
The one-drive V4.1 column is the portable part, and it needs no replicas. It is the selective expert read alone: a 512-token chunk routes to 187 of 384 experts per layer, so the stock layer-major sweep reads about twice what the model touches. Anyone with a single SSD gets that. The three-drive column adds weighted split reads across internal + two SN8100s at 10:5:5 — that is what extra devices buy, and it is what the published branch supports.
Time to first token on a 512-token prompt, which is the question everyone asks next: 31.5 s → 18.3 s on one drive → 11.7 s on three.
What the instruments show
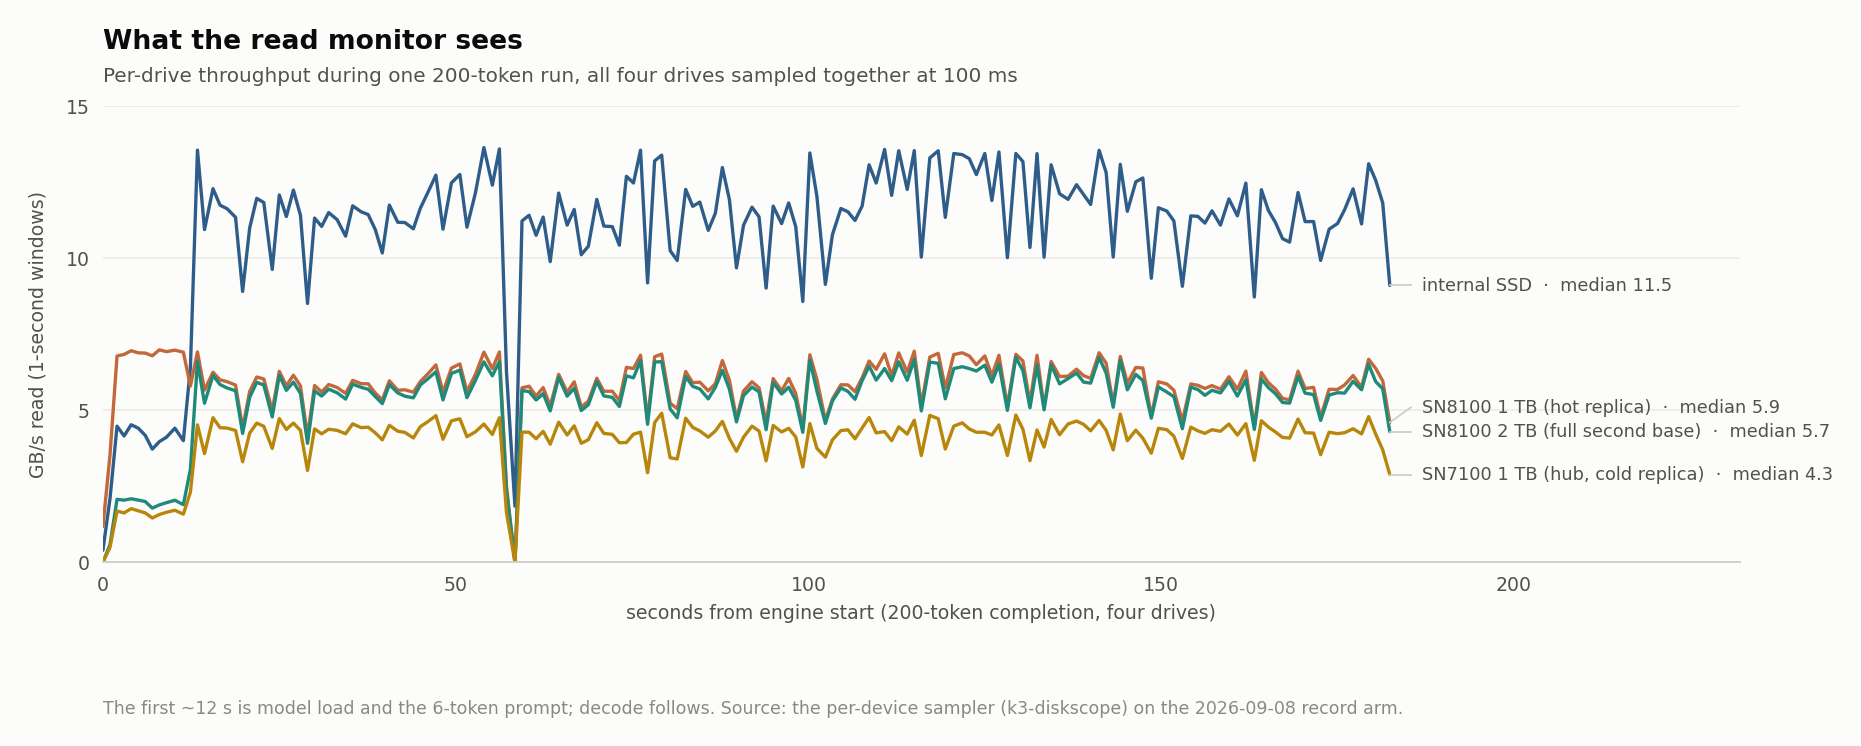
Per-drive throughput across one 200-token run, all four drives sampled together. The first ~12 s is model load and prompt; decode follows. (Kimi K3 record arm, 2026-09-08.)
The view that matters most is not this one, though. It is read latency: V4.1 decode averages 5.2 GB/s, about 19% of these drives' combined ceiling, and still gets faster when you add a fourth drive. No throughput chart can explain that. Milliseconds per read can.
How it works, in five lines
- One device holds the complete expert set; the others hold usage-weighted replicas.
- Each read is split across the devices that hold it, in proportion to measured device rate.
- Both read paths dispatch by expected completion time, with shared in-flight counters.
- During prefill, layer N+1 is staged while the GPU computes layer N.
- Only the experts the router actually selected are read — for V4.1 at 512 tokens that is 187 of 384 per layer, so the stock layer-major sweep was reading about twice what the model touches.
Why more drives help when bandwidth is not the limit
A layer cannot start until every routed expert has arrived. So it costs the maximum over its reads, not the sum. Adding a drive does not mainly add bandwidth — it makes each slice of a split read smaller, so the slice that lands last lands sooner. That is why a fourth drive moved peak throughput hardly at all and still bought +6.6% prefill and +2.9% decode, and it is why aggregate GB/s is the wrong number to optimise.
The engine branch
The V4.1 work lives in our fork of Salvatore Sanfilippo's ds4:
argonautlabsai/ds4-argodrive @ argonaut-v41-benchmark — commit 18fc795
What is reproducible from these repos. A fresh clone of that branch builds ds4 and
ds4-bench on Apple silicon with the multi-source reader compiled in — not stubs. Verified
2026-09-15 from a clean clone. Reproducing the number additionally needs N byte-identical
replicas of the 518 GB model file on separate devices, which is a hardware precondition we
cannot hand you in a repo; the loader checks replica size, not content. A single-drive clone
runs correctly and simply sees no split.
Download the Mac beta
Download ARGODRIVE for Apple silicon · Installation and testing guide · Beta source
Open Live Hardware to check connected drives, memory and activity. Choose a folder of supported benchmark runs to inspect results and compare configurations. Report launch, drive-discovery or chart issues on GitHub. Review any attachments for private paths and prompts before sharing.
This is a monitoring and saved-run analysis preview, not an automatic optimizer, and it does not include model weights. The beta is ad-hoc signed and not notarized; see the testing guide before installing.
Legacy Deltafin tools and recorded charts
The original Deltafin-specific research toolkit and its historical measurements are retained below. These charts are Kimi/Deltafin recordings, not DeepSeek V4.1 results.
ArgoDrive tools
Measurement instruments for SSD-streamed mixture-of-experts inference. These
are the tools that found every gain in the ArgoDrive Deltafin benchmark
package; they are shared as they are — deltafin-specific, rough, and honest —
because the results are not credible without them. Paths, drive names and
role assignments are the ones used on the reference machine (a MacBook Pro
M5 Max with three Thunderbolt 5 NVMe enclosures); adapt K3_DIR and the
volume names to yours.
What they show
Per-drive read throughput during one 200-token completion, all four drives
sampled together at 100 ms by k3-diskscope: first as a replay of the sampler's
record (the bars move as the drives did, at 8× speed), then reduced to one-second windows:


The same run reduced to median and peak draw per drive, against each drive's
standalone ceiling measured with k3-drive-ceiling.py while the engine was
idle — every drive at 88–100% of its own ceiling, which is why the read barrier
rather than total bandwidth sets the decode speed:

Both charts are produced from the sampler CSV and the ceiling tool's output by
the chart script in the benchmark package
(argonautlabsai/deltafin).
| directory | tool | what it does |
|---|---|---|
monitor/ | k3-diskscope.c | 100 ms sampler of per-device read bytes and ops, RAM, CPU and GPU counters, to CSV. cc -O2 -o k3-diskscope k3-diskscope.c -framework IOKit -framework CoreFoundation |
monitor/ | k3-live.py | local web dashboard on port 8130: live per-drive throughput, arm history with same-length deltas, by-layer barrier report from a per-read trace, CSV exports |
monitor/ | k3-memsample.sh | one line per second of macOS memory truth (used / available / wired / swap) |
harness/ | k3-arm.sh, k3-arm-inner.sh, k3-measure.sh | one measured arm: the configuration of record as environment, cold start enforced, swap guard, device map recorded, sampler and memory log per arm, text-identity check |
harness/ | k3-pressure.c | memory-pressure step before an arm (records what preceded each measurement) |
harness/ | k3-stdbench-table.py | inclusive / steady / first-token table from arm logs; derived prompt-processing rate |
trace/ | k3-trace-gaps.py | per-barrier attribution from the engine's read trace: which device landed last, its gap behind the next-to-last, by demand-vs-prefetch, barrier width and layer |
drives/ | k3-drive-ceiling.py, k3-ceiling-run.sh | standalone read ceiling of an expert directory (whole files, no page cache, N in flight), per drive and per queue depth |
drives/ | k3-drive-map.py, k3-drive-names.example.json | which physical drive is which — model, serial, whole-disk, bus, direct port or hub — and drift against the last snapshot; run after any replug |
placement/ | k3-regen-manifests.py | regenerate and verify placement manifests from the live directories |
placement/ | k3-stage-wider-bands.py | widen replica bands by traffic share from a usage trace, with a manifest and rollback script per band |
How they were used
Every published number came from one k3-arm.sh invocation: it exports the
configuration of record, refuses to run warm or under swap, records the device
map, starts the sampler and the memory log, runs the engine once, and checks
the output against the text of record. Arms were run one at a time with the
dashboard server stopped (its sampler costs about one percent). Read traces
(K3_READ_TRACE=<file>) were taken on separate arms and analysed with
k3-trace-gaps.py and the dashboard's by-layer view, never used for speed
figures. Drive ceilings were measured with the engine idle.
What these tools are not
They are not a product and not general-purpose: the sampler and the harness
assume macOS, the deltafin engine's log format and its K3_* environment
knobs. Nothing here schedules reads or changes the engine; these are
instruments only.
Development acknowledgements
Claude, ChatGPT and OpenAI Codex assisted with development and review. Their use is acknowledged here; private chat histories are not part of this repository. Performance and correctness claims are supported by the stated tests and measurements, with limitations recorded separately.
Licence
MIT.
Contributors

14 commits
See what people are saying
Similar repos


Languages
Python
57.4%
HTML
31.1%
Shell
7.2%
C
4.4%
README
ARGODRIVE
Layout, balancer and instruments for running mixture-of-experts models from SSDs. A 518 GB model on a 128 GB laptop: every token waits on disk, so what matters is not how much bandwidth you own but how long the slowest required read takes.
The first fork row needs no extra hardware. Upstream's prefill sweep reads every expert of every routed layer, but a 512-token chunk only routes to 187 of 384 — so it reads about twice what the model touches. Fixing that alone is worth 1.73× prompt processing on one internal SSD, no replicas involved. Drives after that just shrink each split read further.
Every bar is a median of interleaved arms against pinned upstream bd66c40, all with the
same output SHA-256.
What it has done
| model | engine | baseline | best measured | gain |
|---|---|---|---|---|
| DeepSeek V4.1-Flash Q4, 518 GB on disk | ds4 fork | upstream ds4, one drive: 16.50 / 10.44 (vs our one-drive) · 16.23 / 10.61 (vs our three-drive) | one drive, no replicas: 28.04 / 14.38 · three drives: 43.62 / 17.38 | 1.70× / 2.69× |
| GLM-5.3, 744B | ds4 fork | our fork, one drive: 2.02 | four drives: 3.54 | 1.8× |
| Kimi K3, 2.78T | deltafin fork | our fork, one drive: 0.55 | four drives: 0.96 | 1.8× |
All on an M5 Max, 128 GB. Read the baselines carefully, because they are not the same kind of
number. The V4.1 row compares against the pinned upstream ds4 binary (bd66c40),
re-measured 2026-09-15 on the branch exactly as it ships, with a byte-identical output
SHA-256 on every arm. The one-drive and three-drive comparisons were separate interleaved
sessions, each with its own upstream control, which is why two baselines are quoted. The GLM and K3 rows are our own software scaling from one drive
to four, which is a storage result, not an engine comparison. GLM is 200-token generation;
K3 is the public 17-token prompt, a median of three runs at every rung. V4.1 is a 512-token
prompt with 200 generated, medians of interleaved pairs.
The one-drive V4.1 column is the portable part, and it needs no replicas. It is the selective expert read alone: a 512-token chunk routes to 187 of 384 experts per layer, so the stock layer-major sweep reads about twice what the model touches. Anyone with a single SSD gets that. The three-drive column adds weighted split reads across internal + two SN8100s at 10:5:5 — that is what extra devices buy, and it is what the published branch supports.
Time to first token on a 512-token prompt, which is the question everyone asks next: 31.5 s → 18.3 s on one drive → 11.7 s on three.
What the instruments show
Per-drive throughput across one 200-token run, all four drives sampled together. The first ~12 s is model load and prompt; decode follows. (Kimi K3 record arm, 2026-09-08.)
The view that matters most is not this one, though. It is read latency: V4.1 decode averages 5.2 GB/s, about 19% of these drives' combined ceiling, and still gets faster when you add a fourth drive. No throughput chart can explain that. Milliseconds per read can.
How it works, in five lines
- One device holds the complete expert set; the others hold usage-weighted replicas.
- Each read is split across the devices that hold it, in proportion to measured device rate.
- Both read paths dispatch by expected completion time, with shared in-flight counters.
- During prefill, layer N+1 is staged while the GPU computes layer N.
- Only the experts the router actually selected are read — for V4.1 at 512 tokens that is 187 of 384 per layer, so the stock layer-major sweep was reading about twice what the model touches.
Why more drives help when bandwidth is not the limit
A layer cannot start until every routed expert has arrived. So it costs the maximum over its reads, not the sum. Adding a drive does not mainly add bandwidth — it makes each slice of a split read smaller, so the slice that lands last lands sooner. That is why a fourth drive moved peak throughput hardly at all and still bought +6.6% prefill and +2.9% decode, and it is why aggregate GB/s is the wrong number to optimise.
The engine branch
The V4.1 work lives in our fork of Salvatore Sanfilippo's ds4:
argonautlabsai/ds4-argodrive @ argonaut-v41-benchmark — commit 18fc795
What is reproducible from these repos. A fresh clone of that branch builds ds4 and
ds4-bench on Apple silicon with the multi-source reader compiled in — not stubs. Verified
2026-09-15 from a clean clone. Reproducing the number additionally needs N byte-identical
replicas of the 518 GB model file on separate devices, which is a hardware precondition we
cannot hand you in a repo; the loader checks replica size, not content. A single-drive clone
runs correctly and simply sees no split.
Download the Mac beta
Download ARGODRIVE for Apple silicon · Installation and testing guide · Beta source
Open Live Hardware to check connected drives, memory and activity. Choose a folder of supported benchmark runs to inspect results and compare configurations. Report launch, drive-discovery or chart issues on GitHub. Review any attachments for private paths and prompts before sharing.
This is a monitoring and saved-run analysis preview, not an automatic optimizer, and it does not include model weights. The beta is ad-hoc signed and not notarized; see the testing guide before installing.
Legacy Deltafin tools and recorded charts
The original Deltafin-specific research toolkit and its historical measurements are retained below. These charts are Kimi/Deltafin recordings, not DeepSeek V4.1 results.
ArgoDrive tools
Measurement instruments for SSD-streamed mixture-of-experts inference. These
are the tools that found every gain in the ArgoDrive Deltafin benchmark
package; they are shared as they are — deltafin-specific, rough, and honest —
because the results are not credible without them. Paths, drive names and
role assignments are the ones used on the reference machine (a MacBook Pro
M5 Max with three Thunderbolt 5 NVMe enclosures); adapt K3_DIR and the
volume names to yours.
What they show
Per-drive read throughput during one 200-token completion, all four drives
sampled together at 100 ms by k3-diskscope: first as a replay of the sampler's
record (the bars move as the drives did, at 8× speed), then reduced to one-second windows:
The same run reduced to median and peak draw per drive, against each drive's
standalone ceiling measured with k3-drive-ceiling.py while the engine was
idle — every drive at 88–100% of its own ceiling, which is why the read barrier
rather than total bandwidth sets the decode speed:
Both charts are produced from the sampler CSV and the ceiling tool's output by
the chart script in the benchmark package
(argonautlabsai/deltafin).
| directory | tool | what it does |
|---|---|---|
monitor/ | k3-diskscope.c | 100 ms sampler of per-device read bytes and ops, RAM, CPU and GPU counters, to CSV. cc -O2 -o k3-diskscope k3-diskscope.c -framework IOKit -framework CoreFoundation |
monitor/ | k3-live.py | local web dashboard on port 8130: live per-drive throughput, arm history with same-length deltas, by-layer barrier report from a per-read trace, CSV exports |
monitor/ | k3-memsample.sh | one line per second of macOS memory truth (used / available / wired / swap) |
harness/ | k3-arm.sh, k3-arm-inner.sh, k3-measure.sh | one measured arm: the configuration of record as environment, cold start enforced, swap guard, device map recorded, sampler and memory log per arm, text-identity check |
harness/ | k3-pressure.c | memory-pressure step before an arm (records what preceded each measurement) |
harness/ | k3-stdbench-table.py | inclusive / steady / first-token table from arm logs; derived prompt-processing rate |
trace/ | k3-trace-gaps.py | per-barrier attribution from the engine's read trace: which device landed last, its gap behind the next-to-last, by demand-vs-prefetch, barrier width and layer |
drives/ | k3-drive-ceiling.py, k3-ceiling-run.sh | standalone read ceiling of an expert directory (whole files, no page cache, N in flight), per drive and per queue depth |
drives/ | k3-drive-map.py, k3-drive-names.example.json | which physical drive is which — model, serial, whole-disk, bus, direct port or hub — and drift against the last snapshot; run after any replug |
placement/ | k3-regen-manifests.py | regenerate and verify placement manifests from the live directories |
placement/ | k3-stage-wider-bands.py | widen replica bands by traffic share from a usage trace, with a manifest and rollback script per band |
How they were used
Every published number came from one k3-arm.sh invocation: it exports the
configuration of record, refuses to run warm or under swap, records the device
map, starts the sampler and the memory log, runs the engine once, and checks
the output against the text of record. Arms were run one at a time with the
dashboard server stopped (its sampler costs about one percent). Read traces
(K3_READ_TRACE=<file>) were taken on separate arms and analysed with
k3-trace-gaps.py and the dashboard's by-layer view, never used for speed
figures. Drive ceilings were measured with the engine idle.
What these tools are not
They are not a product and not general-purpose: the sampler and the harness
assume macOS, the deltafin engine's log format and its K3_* environment
knobs. Nothing here schedules reads or changes the engine; these are
instruments only.
Development acknowledgements
Claude, ChatGPT and OpenAI Codex assisted with development and review. Their use is acknowledged here; private chat histories are not part of this repository. Performance and correctness claims are supported by the stated tests and measurements, with limitations recorded separately.
Licence
MIT.
See what people are saying
Similar repos
Contributors
14 commits
Languages
Python
57.4%
HTML
31.1%
Shell
7.2%
C
4.4%