
README
Swift Profile Recorder, an in-process sampling profiler
Want to profile your software in restricted Kubernetes or Docker containers or other environments where you don't have CAP_SYS_PTRACE? Look no further.
What is this?
This is a sampling profiler (like sample on macOS) with the special twist that it runs inside the process that gets sampled. This means that it doesn't need CAP_SYS_PTRACE or any other privileges to work.
You can pull it in as a fully self-contained Swift Package Manager dependency and then use it in your app.
Swift Profile Recorder is an on- and off-CPU profiler, which means that it records waiting threads (e.g., sleeps, locks, blocking system calls) as well as running (i.e., computing) threads.
Supported OSes
At the moment, it only supports Linux and macOS. It could also support other operating systems, but that's not implemented at this point in time.
How can I use it?
Via Swift Profile Recorder Server
The easiest way to use Swift Profile Recorder in your application is to run the Swift Profile Recorder Server.
This allows you to retrieve symbolicated samples with a single curl (or any other HTTP client) command.
Using the Sampling Server
One-off setup to get your application ready for sampling
- Add a
swift-profile-recorderdependency:.package(url: "https://github.com/apple/swift-profile-recorder.git", .upToNextMinor(from: "0.3.13")) - Make your main
executableTargetdepend onProfileRecorderServer:.product(name: "ProfileRecorderServer", package: "swift-profile-recorder"), - Add the following few lines at the very beginning of your main function (
static func main()orfunc run()):
import ProfileRecorderServer

[...]

@main
struct YourApp {
   func run() async throws {
       // Run `ProfileRecorderServer` in the background if enabled via environment variable. Ignore failures.
       // It will be automatically cancelled if this function returns.
       //
       // Example:
       //   PROFILE_RECORDER_SERVER_URL_PATTERN='unix:///tmp/my-app-samples-{PID}.sock' ./my-app
       async let _ = ProfileRecorderServer(configuration: .parseFromEnvironment()).runIgnoringFailures(logger: logger)

       [... your regular main function ...]
    }
}
Using the profiling server
Once you added the profile recorder server to your app, you can enable it using an environment variable (assuming you passed configuration: .parseFromEnvironment()):
# Request the profile recording server to listen on a UNIX Domain Socket at path `/tmp/my-app-samples-{PID}.sock`.
# `{PID}` will automatically be replaced with your process's process ID.
PROFILE_RECORDER_SERVER_URL_PATTERN=unix:///tmp/my-app-samples-{PID}.sock .build/release/MyApp
After that, you're ready to request samples:
curl --unix-socket /tmp/my-app-samples-62012.sock -sd '{"numberOfSamples":10,"timeInterval":"100 ms"}' http://localhost/sample | swift demangle --compact > /tmp/samples.perf
Now, a file called /tmp/samples.perf should have been created. This file is in the standard Linux perf format.
Visualisation
Whilst .perf files are plain text files, they are most easily digested in a visual form such as FlameGraphs.
Below, some compatible visualisation tools:
- Speedscope (speedscope.app), simply drag a
.perffile (such as/tmp/samples.perfin the example above) onto the Speedscope website. - Firefox Profiler (profiler.firefox.com), simply drag a
.perffile (such as/tmp/samples.perfin the example above) onto the Firefox Profiler website. - The original FlameGraph tooling. Try for example
./stackcollapse-perf.pl < /tmp/samples.perf | swift demangle --compact | ./flamegraph.pl > /tmp/samples.svg && open -a Safari /tmp/samples.svg.
Compatibility
Formats
- The Linux perf script format (
.perf, like whatperf record && perf scriptwould emit) - The
pprofformat (.pprof, like what Golang's pprof emits) - The "collapsed" format (like what FlameGraph's
stackcollapse*scripts emit)
Profile recording server URL endpoints
- pprof's
/debug/pprof/profileendpoint - Swift Profile Recorder's own
/sampleendpoint /healthendpoint for health checks (returns200 OK)
Example profiles
-
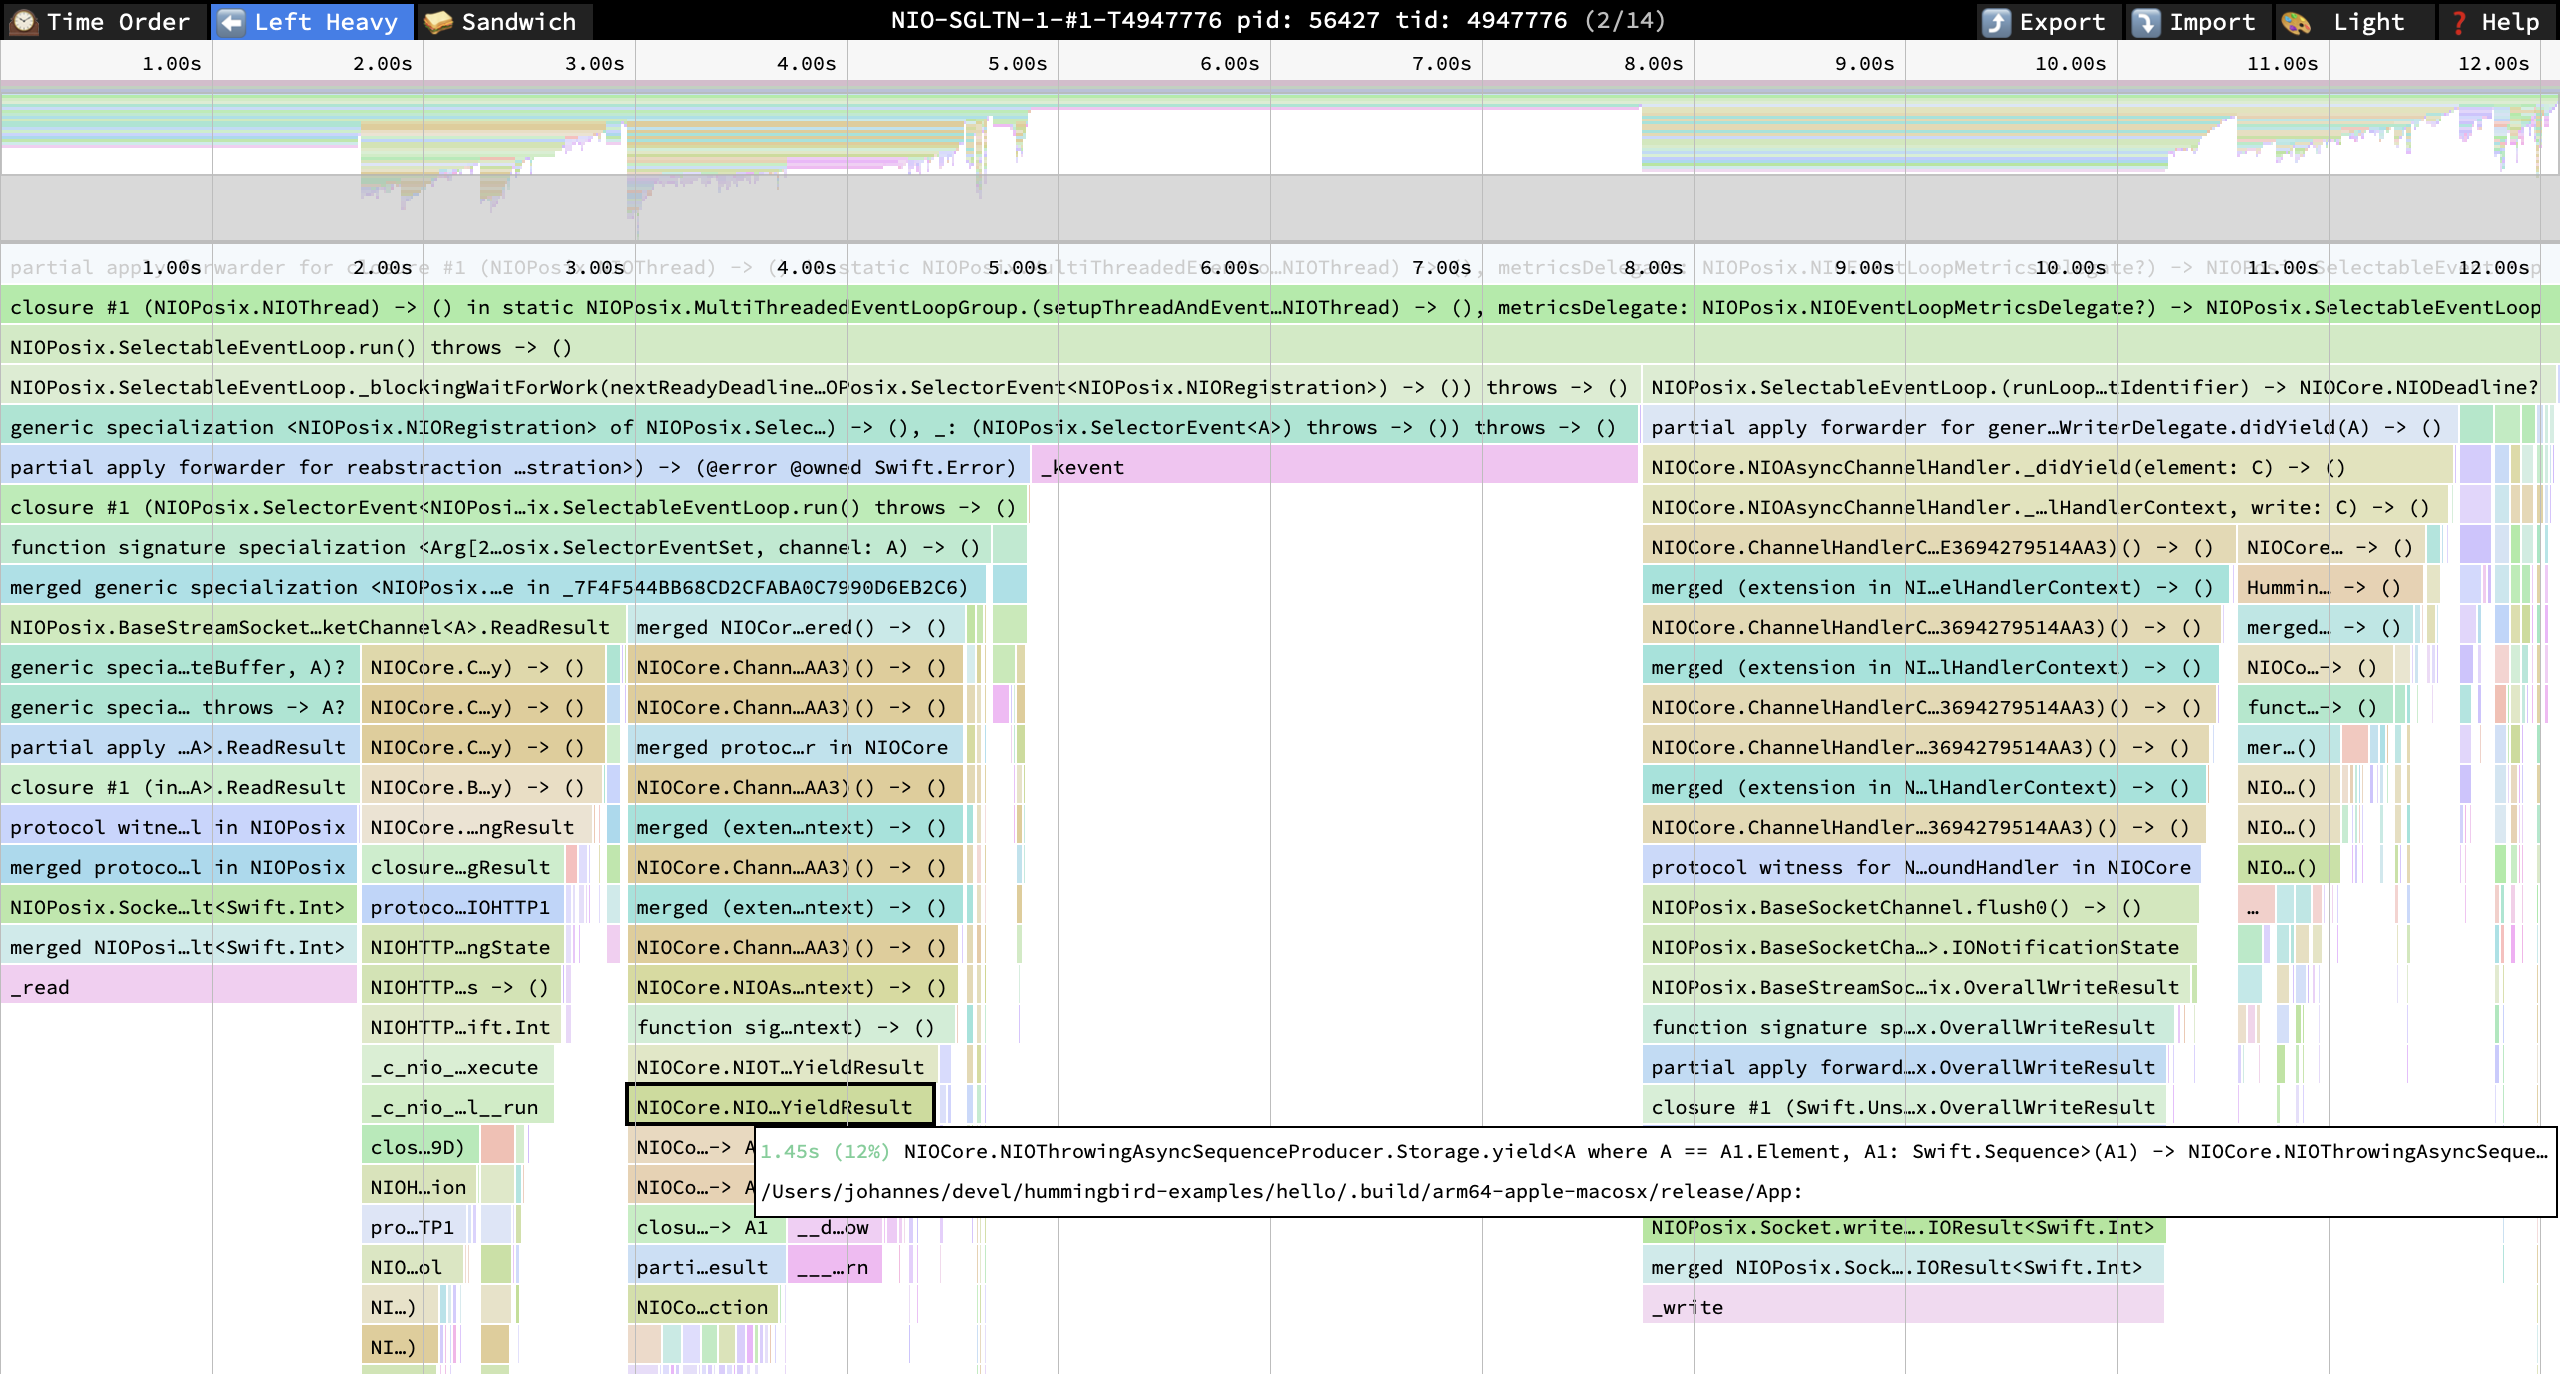
Hummingbird's hello example load-tested by
wrk -T50s -c 20000 -t 200 http://127.0.0.1:8080running on macOS- Applied a small diff to enable Swift Profile Recorder in Humminbird's hello example
- Server started with just one SwiftNIO thread for a cleaner profile:
NIO_SINGLETON_BLOCKING_POOL_THREAD_COUNT=1 NIO_SINGLETON_GROUP_LOOP_COUNT=1 PROFILE_RECORDER_SERVER_URL_PATTERN=unix:///tmp/swipr-{PID}.sock .build/release/App= Samples received usingcurl -sd '{"numberOfSamples":1000,"timeInterval":"10ms"}' --unix-socket /tmp/swipr-SERVER_PID.sock http://unix | swift demangle --compact > /tmp/samples.perf - View profile in Firefox Profiler
- Screenshot of speedscope.app:
-
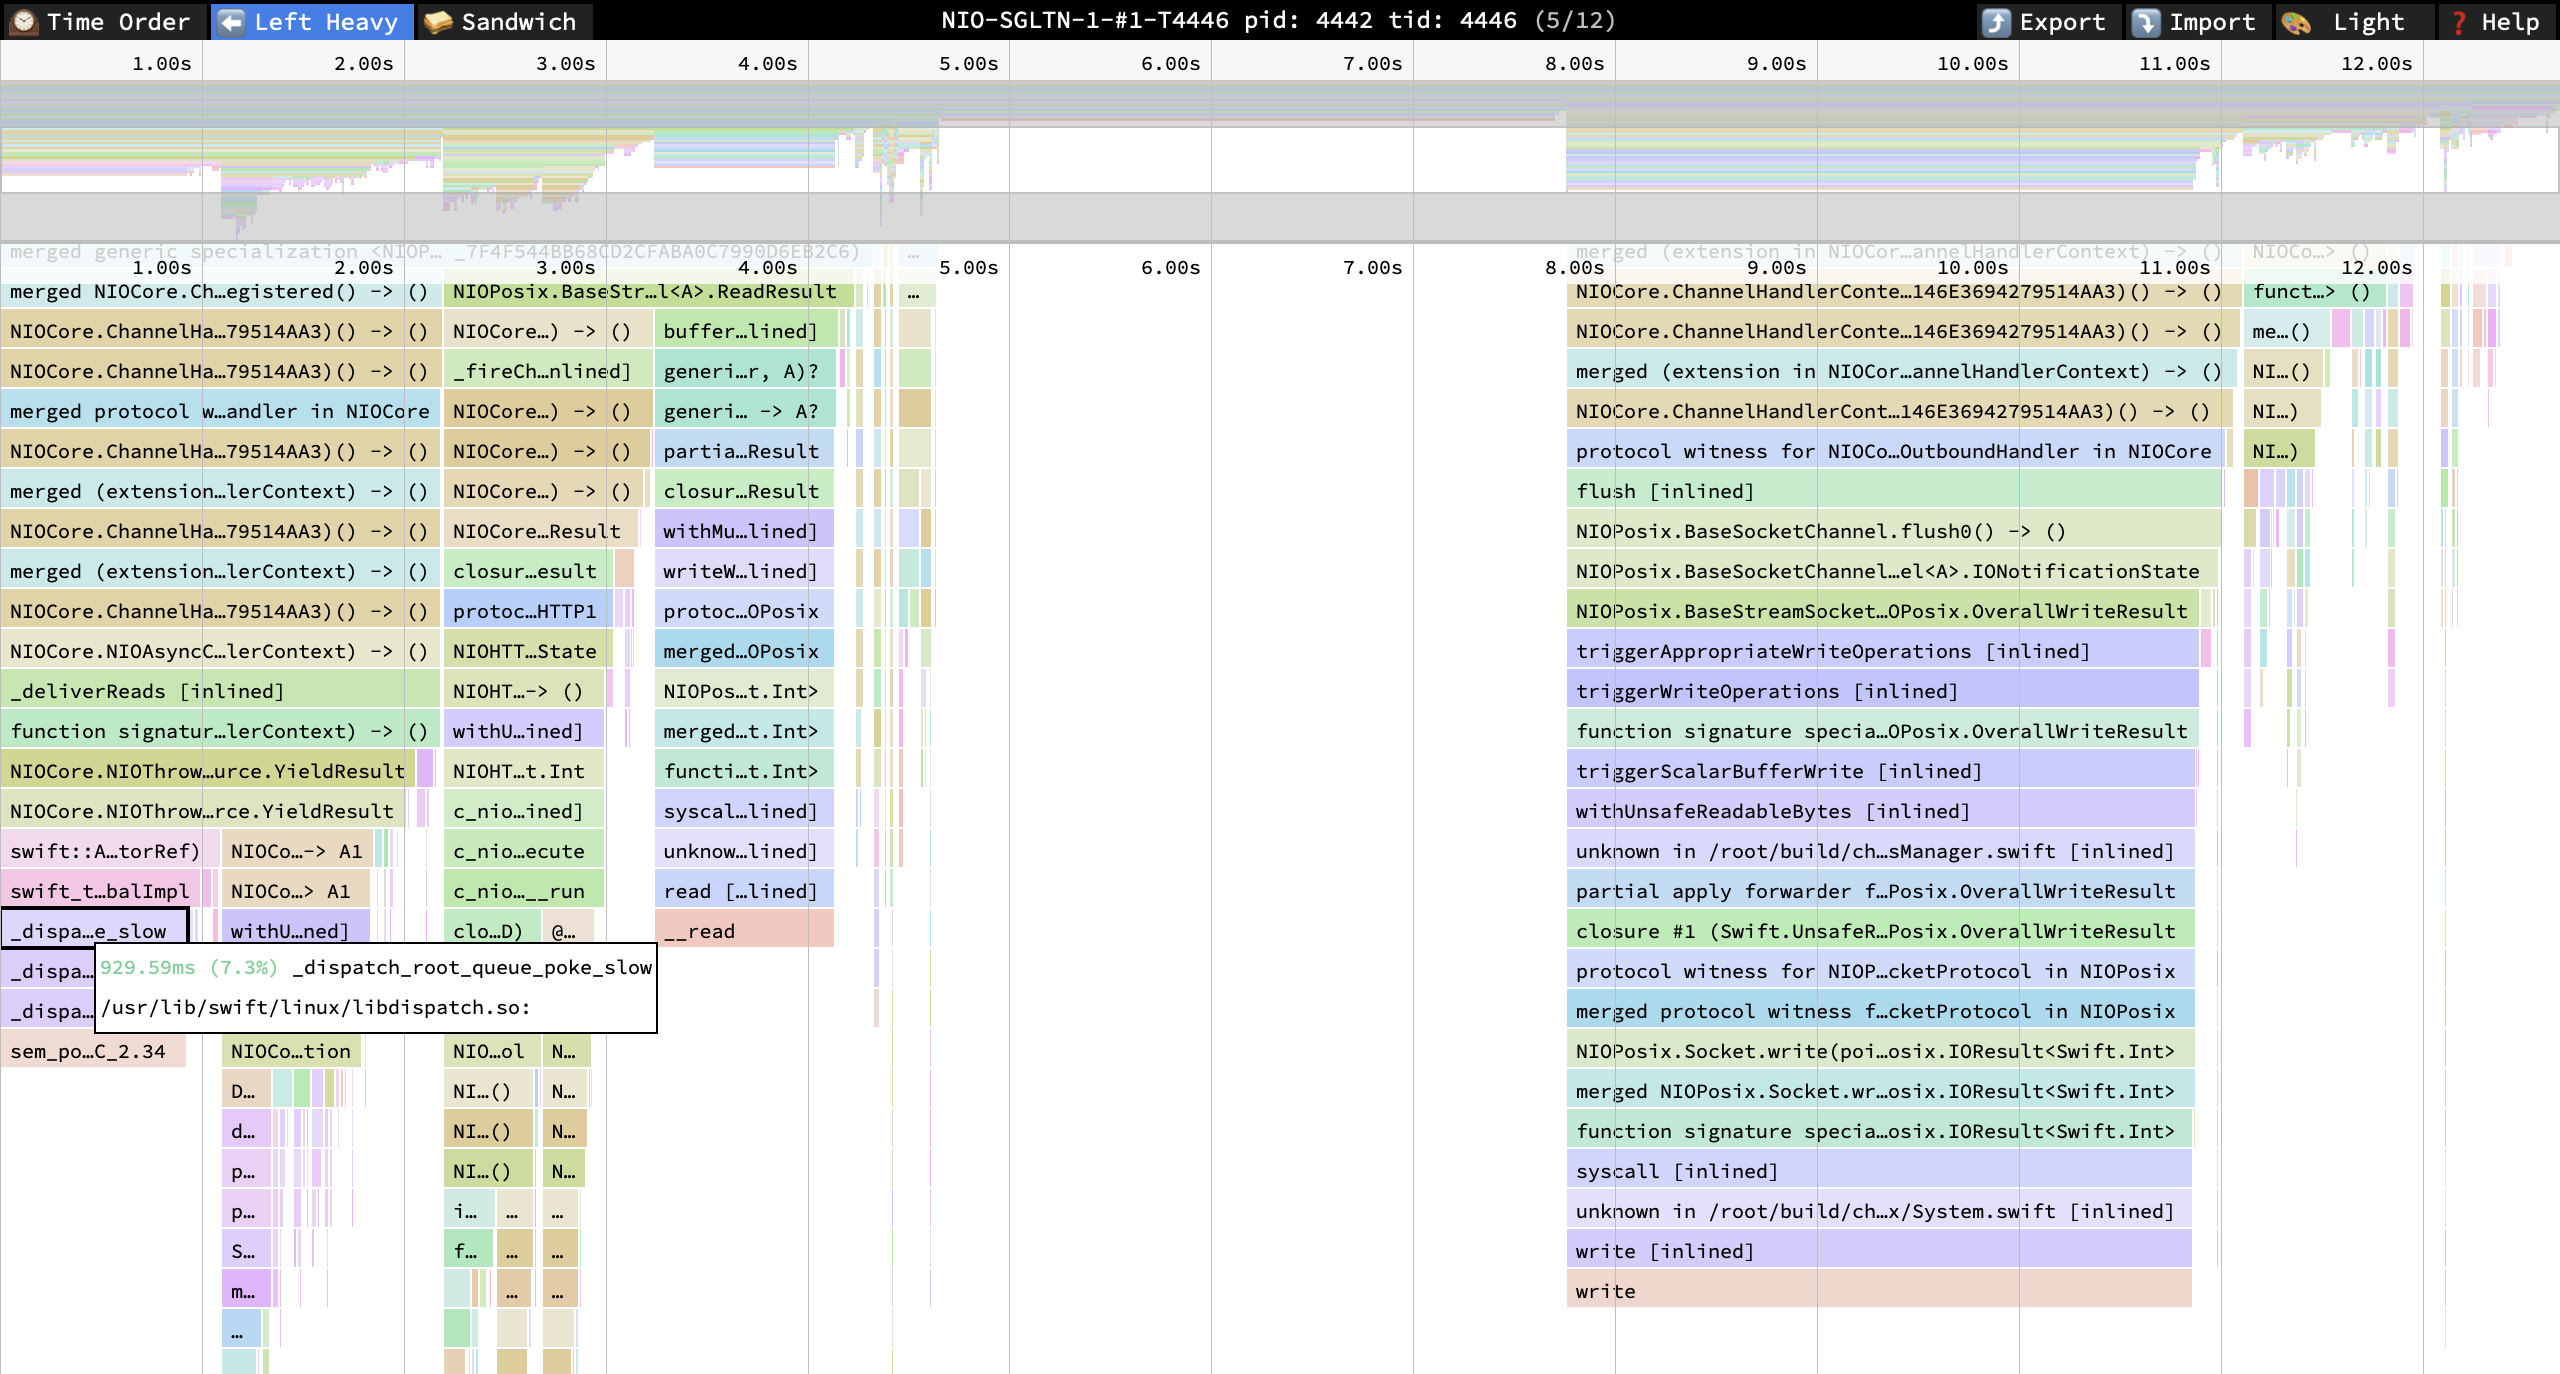
Hummingbird's hello example load-tested by
wrk -T50s -c 20000 -t 200 http://127.0.0.1:8080running on Linux (Ubuntu 20.04, Swift 6.2, unprivileged container)- Applied a small diff to enable Swift Profile Recorder in Humminbird's hello example
- Server started with just one SwiftNIO thread for a cleaner profile:
NIO_SINGLETON_BLOCKING_POOL_THREAD_COUNT=1 NIO_SINGLETON_GROUP_LOOP_COUNT=1 PROFILE_RECORDER_SERVER_URL_PATTERN=unix:///tmp/swipr-{PID}.sock .build/release/App= Samples received usingcurl -sd '{"numberOfSamples":1000,"timeInterval":"10ms"}' --unix-socket /tmp/swipr-SERVER_PID.sock http://unix | swift demangle --compact > /tmp/samples.perf - View profile in Firefox Profiler
- Screenshot of speedscope.app:
Example diffs
Add Swift Profile Recorder to hummingbird-examples/hello
Expand here to see git diff -U1 onto commit 97a09f0664679f017616a82894848b267c5e7068
git diff -U1 onto commit 97a09f0664679f017616a82894848b267c5e7068diff --git a/hello/Package.swift b/hello/Package.swift
index ae0b6d2..33b24ed 100644
--- a/hello/Package.swift
+++ b/hello/Package.swift
@@ -11,2 +11,3 @@ let package = Package(
.package(url: "https://github.com/apple/swift-argument-parser.git", from: "1.4.0"),
+ .package(url: "https://github.com/apple/swift-profile-recorder.git", .upToNextMinor(from: "0.3.13")),
],
@@ -18,2 +19,3 @@ let package = Package(
.product(name: "Hummingbird", package: "hummingbird"),
+ .product(name: "ProfileRecorderServer", package: "swift-profile-recorder"),
],
diff --git a/hello/Sources/App/app.swift b/hello/Sources/App/app.swift
index 13131d9..95b114a 100644
--- a/hello/Sources/App/app.swift
+++ b/hello/Sources/App/app.swift
@@ -1,2 +1,3 @@
import ArgumentParser
+import ProfileRecorderServer
@@ -17,2 +18,5 @@ struct HummingbirdArguments: AsyncParsableCommand {
)
+ async let _ = ProfileRecorderServer(configuration: .parseFromEnvironment()).runIgnoringFailures(
+ logger: app.logger
+ )
try await app.runService()


Similar repos


Languages
Swift
74.8%
C++
11.7%
C
10.6%
Shell
2.7%
README
Swift Profile Recorder, an in-process sampling profiler
Want to profile your software in restricted Kubernetes or Docker containers or other environments where you don't have CAP_SYS_PTRACE? Look no further.
What is this?
This is a sampling profiler (like sample on macOS) with the special twist that it runs inside the process that gets sampled. This means that it doesn't need CAP_SYS_PTRACE or any other privileges to work.
You can pull it in as a fully self-contained Swift Package Manager dependency and then use it in your app.
Swift Profile Recorder is an on- and off-CPU profiler, which means that it records waiting threads (e.g., sleeps, locks, blocking system calls) as well as running (i.e., computing) threads.
Supported OSes
At the moment, it only supports Linux and macOS. It could also support other operating systems, but that's not implemented at this point in time.
How can I use it?
Via Swift Profile Recorder Server
The easiest way to use Swift Profile Recorder in your application is to run the Swift Profile Recorder Server.
This allows you to retrieve symbolicated samples with a single curl (or any other HTTP client) command.
Using the Sampling Server
One-off setup to get your application ready for sampling
- Add a
swift-profile-recorderdependency:.package(url: "https://github.com/apple/swift-profile-recorder.git", .upToNextMinor(from: "0.3.13")) - Make your main
executableTargetdepend onProfileRecorderServer:.product(name: "ProfileRecorderServer", package: "swift-profile-recorder"), - Add the following few lines at the very beginning of your main function (
static func main()orfunc run()):
import ProfileRecorderServer

[...]

@main
struct YourApp {
   func run() async throws {
       // Run `ProfileRecorderServer` in the background if enabled via environment variable. Ignore failures.
       // It will be automatically cancelled if this function returns.
       //
       // Example:
       //   PROFILE_RECORDER_SERVER_URL_PATTERN='unix:///tmp/my-app-samples-{PID}.sock' ./my-app
       async let _ = ProfileRecorderServer(configuration: .parseFromEnvironment()).runIgnoringFailures(logger: logger)

       [... your regular main function ...]
    }
}
Using the profiling server
Once you added the profile recorder server to your app, you can enable it using an environment variable (assuming you passed configuration: .parseFromEnvironment()):
# Request the profile recording server to listen on a UNIX Domain Socket at path `/tmp/my-app-samples-{PID}.sock`.
# `{PID}` will automatically be replaced with your process's process ID.
PROFILE_RECORDER_SERVER_URL_PATTERN=unix:///tmp/my-app-samples-{PID}.sock .build/release/MyApp
After that, you're ready to request samples:
curl --unix-socket /tmp/my-app-samples-62012.sock -sd '{"numberOfSamples":10,"timeInterval":"100 ms"}' http://localhost/sample | swift demangle --compact > /tmp/samples.perf
Now, a file called /tmp/samples.perf should have been created. This file is in the standard Linux perf format.
Visualisation
Whilst .perf files are plain text files, they are most easily digested in a visual form such as FlameGraphs.
Below, some compatible visualisation tools:
- Speedscope (speedscope.app), simply drag a
.perffile (such as/tmp/samples.perfin the example above) onto the Speedscope website. - Firefox Profiler (profiler.firefox.com), simply drag a
.perffile (such as/tmp/samples.perfin the example above) onto the Firefox Profiler website. - The original FlameGraph tooling. Try for example
./stackcollapse-perf.pl < /tmp/samples.perf | swift demangle --compact | ./flamegraph.pl > /tmp/samples.svg && open -a Safari /tmp/samples.svg.
Compatibility
Formats
- The Linux perf script format (
.perf, like whatperf record && perf scriptwould emit) - The
pprofformat (.pprof, like what Golang's pprof emits) - The "collapsed" format (like what FlameGraph's
stackcollapse*scripts emit)
Profile recording server URL endpoints
- pprof's
/debug/pprof/profileendpoint - Swift Profile Recorder's own
/sampleendpoint /healthendpoint for health checks (returns200 OK)
Example profiles
-
Hummingbird's hello example load-tested by
wrk -T50s -c 20000 -t 200 http://127.0.0.1:8080running on macOS- Applied a small diff to enable Swift Profile Recorder in Humminbird's hello example
- Server started with just one SwiftNIO thread for a cleaner profile:
NIO_SINGLETON_BLOCKING_POOL_THREAD_COUNT=1 NIO_SINGLETON_GROUP_LOOP_COUNT=1 PROFILE_RECORDER_SERVER_URL_PATTERN=unix:///tmp/swipr-{PID}.sock .build/release/App= Samples received usingcurl -sd '{"numberOfSamples":1000,"timeInterval":"10ms"}' --unix-socket /tmp/swipr-SERVER_PID.sock http://unix | swift demangle --compact > /tmp/samples.perf - View profile in Firefox Profiler
- Screenshot of speedscope.app:
-
Hummingbird's hello example load-tested by
wrk -T50s -c 20000 -t 200 http://127.0.0.1:8080running on Linux (Ubuntu 20.04, Swift 6.2, unprivileged container)- Applied a small diff to enable Swift Profile Recorder in Humminbird's hello example
- Server started with just one SwiftNIO thread for a cleaner profile:
NIO_SINGLETON_BLOCKING_POOL_THREAD_COUNT=1 NIO_SINGLETON_GROUP_LOOP_COUNT=1 PROFILE_RECORDER_SERVER_URL_PATTERN=unix:///tmp/swipr-{PID}.sock .build/release/App= Samples received usingcurl -sd '{"numberOfSamples":1000,"timeInterval":"10ms"}' --unix-socket /tmp/swipr-SERVER_PID.sock http://unix | swift demangle --compact > /tmp/samples.perf - View profile in Firefox Profiler
- Screenshot of speedscope.app:
Example diffs
Add Swift Profile Recorder to hummingbird-examples/hello
Expand here to see git diff -U1 onto commit 97a09f0664679f017616a82894848b267c5e7068
git diff -U1 onto commit 97a09f0664679f017616a82894848b267c5e7068diff --git a/hello/Package.swift b/hello/Package.swift
index ae0b6d2..33b24ed 100644
--- a/hello/Package.swift
+++ b/hello/Package.swift
@@ -11,2 +11,3 @@ let package = Package(
.package(url: "https://github.com/apple/swift-argument-parser.git", from: "1.4.0"),
+ .package(url: "https://github.com/apple/swift-profile-recorder.git", .upToNextMinor(from: "0.3.13")),
],
@@ -18,2 +19,3 @@ let package = Package(
.product(name: "Hummingbird", package: "hummingbird"),
+ .product(name: "ProfileRecorderServer", package: "swift-profile-recorder"),
],
diff --git a/hello/Sources/App/app.swift b/hello/Sources/App/app.swift
index 13131d9..95b114a 100644
--- a/hello/Sources/App/app.swift
+++ b/hello/Sources/App/app.swift
@@ -1,2 +1,3 @@
import ArgumentParser
+import ProfileRecorderServer
@@ -17,2 +18,5 @@ struct HummingbirdArguments: AsyncParsableCommand {
)
+ async let _ = ProfileRecorderServer(configuration: .parseFromEnvironment()).runIgnoringFailures(
+ logger: app.logger
+ )
try await app.runService()
Similar repos
Languages
Swift
74.8%
C++
11.7%
C
10.6%
Shell
2.7%