♾ A Graph Visualization Framework in JavaScript.
See the code English | 简体中文






Introduction • Examples • Quick Start • API
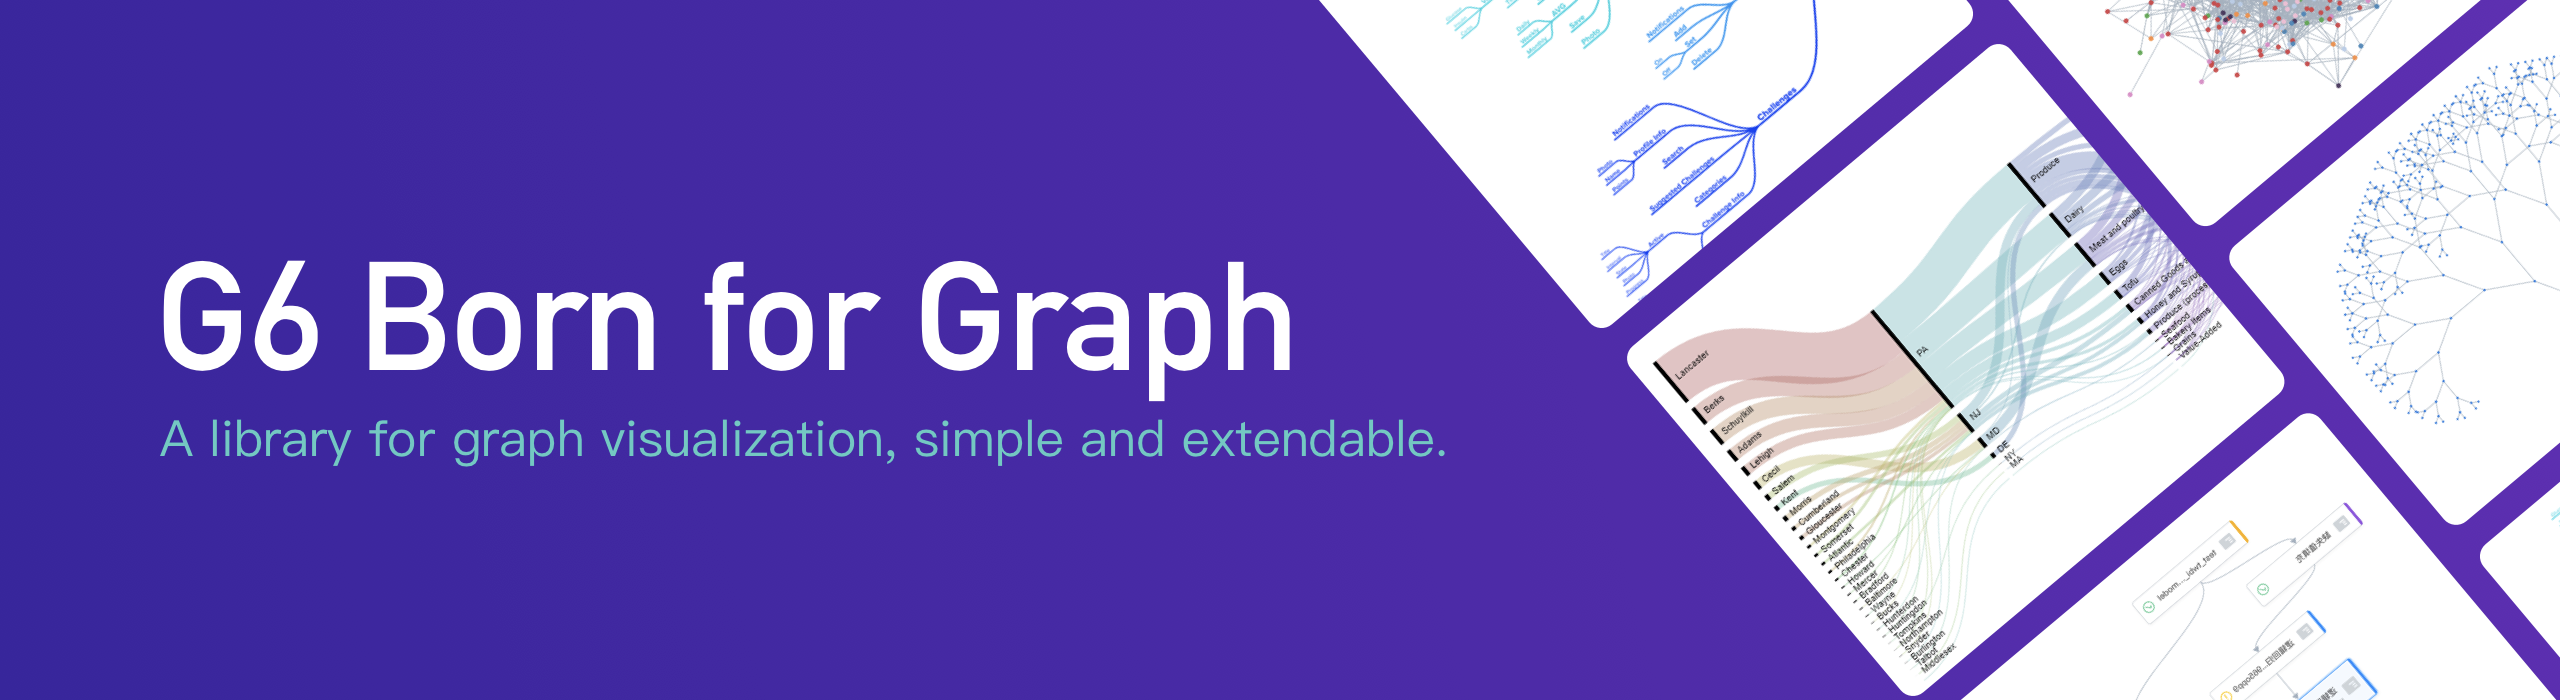
G6 is a graph visualization engine. It provides basic capabilities for graph visualization and analysis such as drawing, layout, analysis, interaction, animation, themes, and plugins. With G6, users can quickly build their own graph visualization and analysis applications, making relational data simple, transparent, and meaningful.


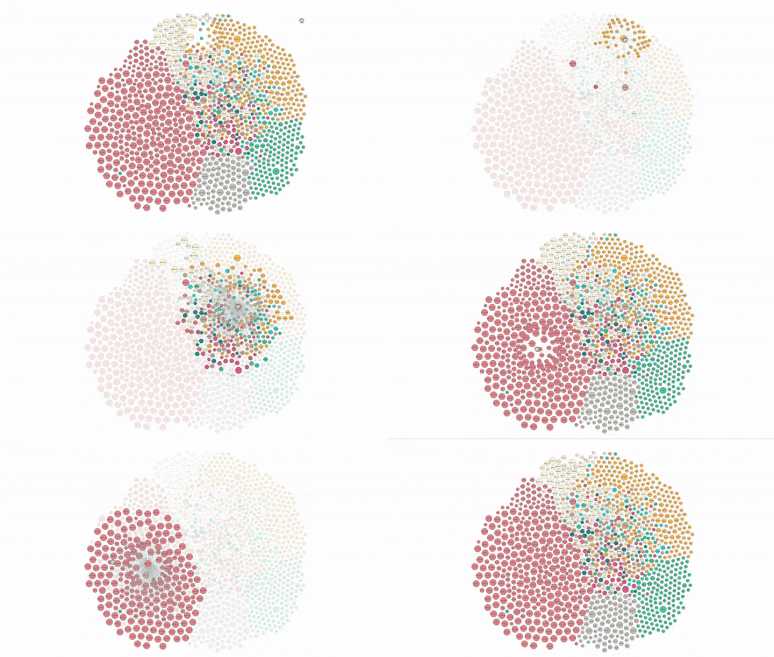
G6, as a professional graph visualization engine, boasts the following features:
G6 is usually installed via a package manager such as npm or Yarn.
$ npm install @antv/g6
The Graph object then can be imported from G6.
<div id="container"></div>
import { Graph } from '@antv/g6';

// Get the Data.
const data = {
  nodes: [
    /* your nodes data */
  ],
  edges: [
    /* your edges data */
  ],
};

// Create the Graph instance.
const graph = new Graph({
  container: 'container',
  data,
  node: {
    palette: {
      type: 'group',
      field: 'cluster',
    },
  },
  layout: {
    type: 'force',
  },
  behaviors: ['drag-canvas', 'drag-node'],
});

// Render the Graph.
graph.render();
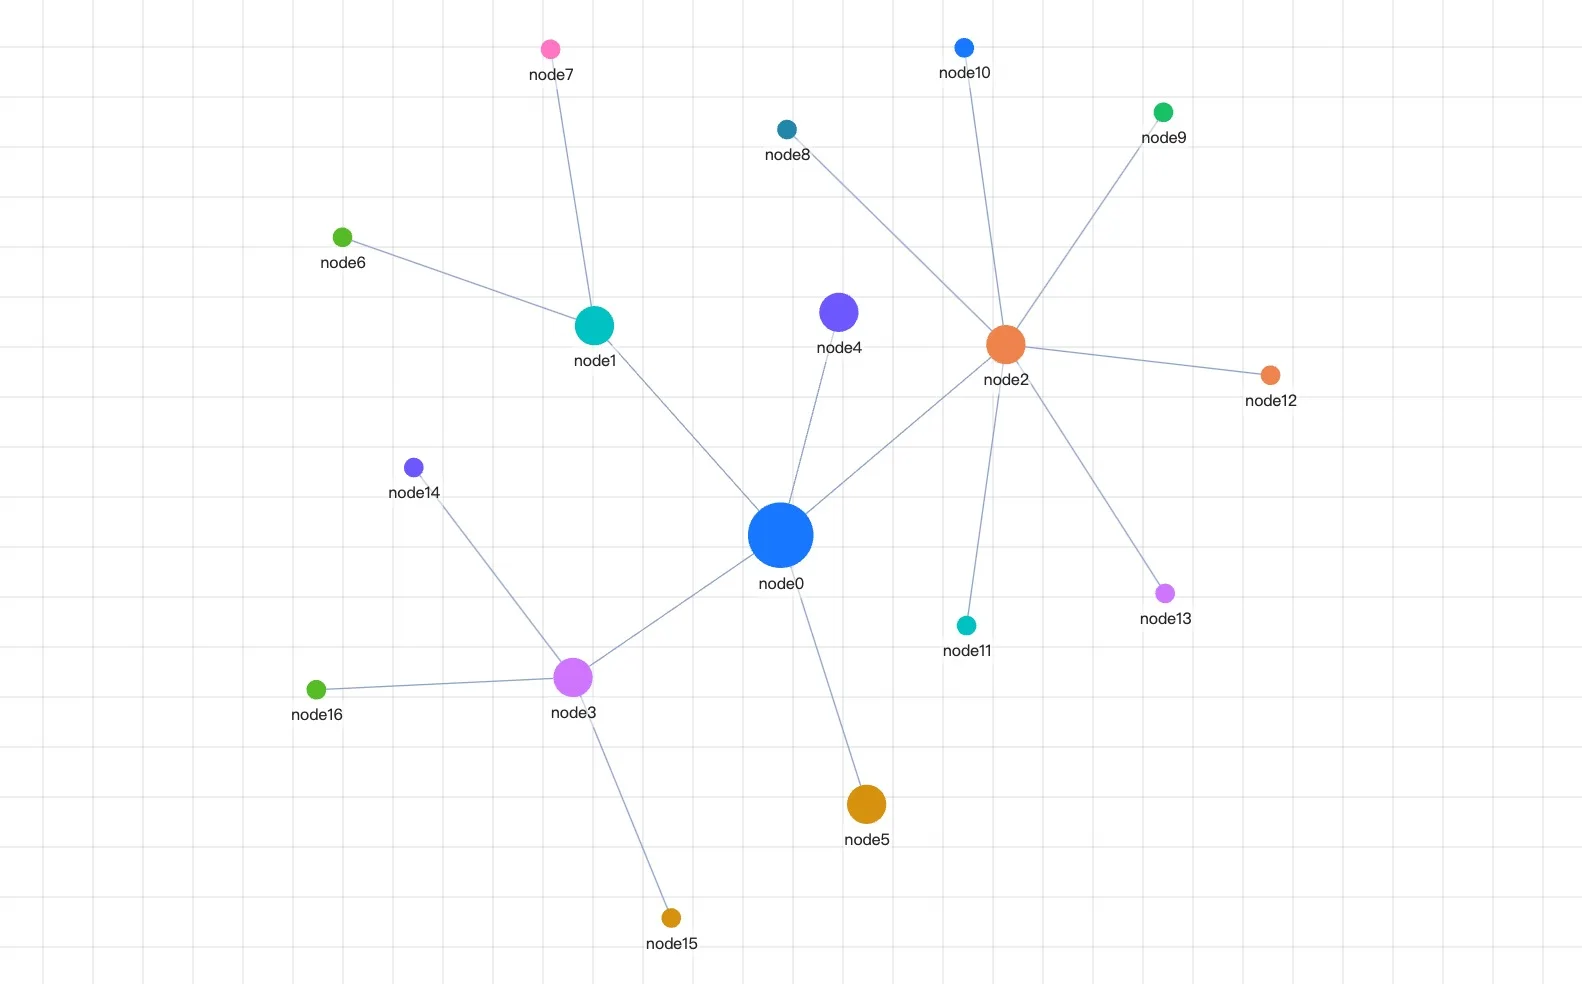
All goes well, you can get the following lovely graph!
For more ecosystem open-source projects, contributions are welcome. Please feel free to submit a PR for inclusion.
This project exists thanks to all the people who contribute.
And thank you to all our backers! 🙏

MIT.
(top 24 of 40)
808 followers · starred Oct 2025
3,105 followers · starred Aug 2026
572 followers · starred Jun 2018
608 followers · starred Jun 2018
♾ A Graph Visualization Framework in JavaScript.
See the code English | 简体中文
Introduction • Examples • Quick Start • API
G6 is a graph visualization engine. It provides basic capabilities for graph visualization and analysis such as drawing, layout, analysis, interaction, animation, themes, and plugins. With G6, users can quickly build their own graph visualization and analysis applications, making relational data simple, transparent, and meaningful.
G6, as a professional graph visualization engine, boasts the following features:
G6 is usually installed via a package manager such as npm or Yarn.
$ npm install @antv/g6
The Graph object then can be imported from G6.
<div id="container"></div>
import { Graph } from '@antv/g6';

// Get the Data.
const data = {
  nodes: [
    /* your nodes data */
  ],
  edges: [
    /* your edges data */
  ],
};

// Create the Graph instance.
const graph = new Graph({
  container: 'container',
  data,
  node: {
    palette: {
      type: 'group',
      field: 'cluster',
    },
  },
  layout: {
    type: 'force',
  },
  behaviors: ['drag-canvas', 'drag-node'],
});

// Render the Graph.
graph.render();
All goes well, you can get the following lovely graph!
For more ecosystem open-source projects, contributions are welcome. Please feel free to submit a PR for inclusion.
This project exists thanks to all the people who contribute.
And thank you to all our backers! 🙏
MIT.
(top 24 of 40)
808 followers · starred Oct 2025
3,105 followers · starred Aug 2026
572 followers · starred Jun 2018
608 followers · starred Jun 2018