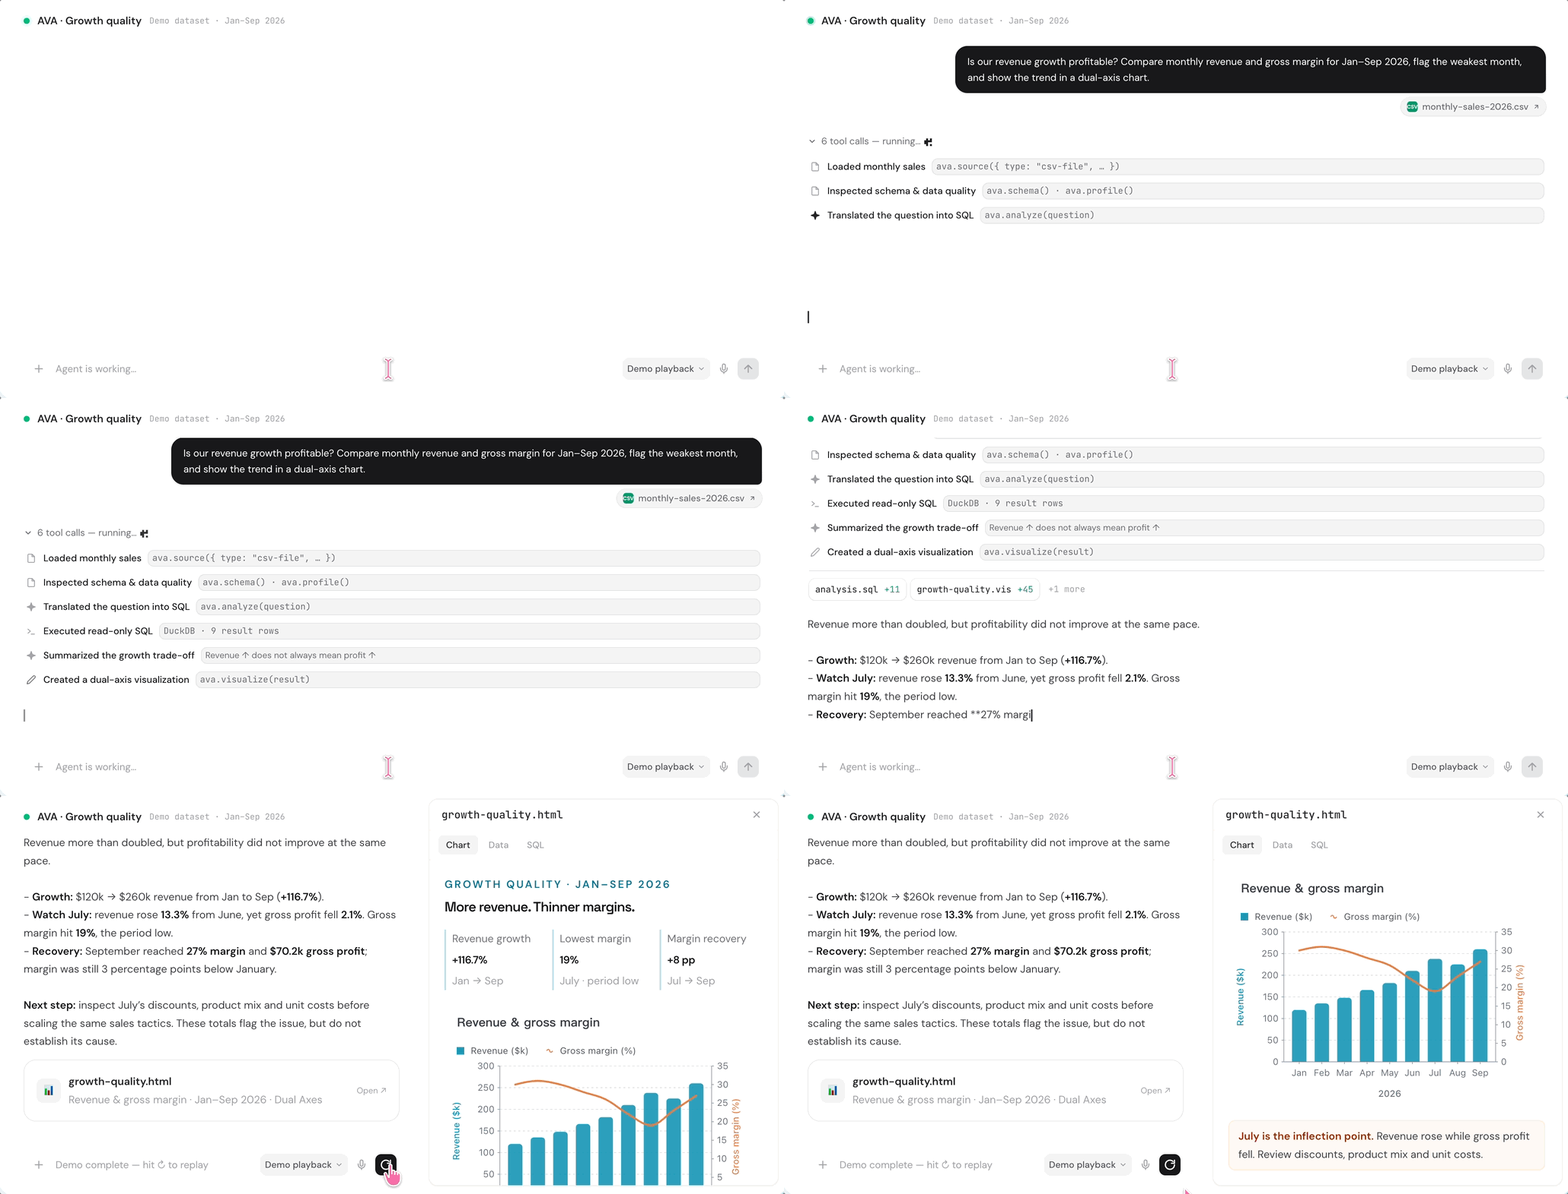
👾 AI-native Visual Analytics framework build for agents.
See the code
AVA (


Install the v4 alpha with Node.js 22.13+:
npm install @antv/ava@alpha
Investigate a monthly sales decline: measure the change, identify the largest contributors, and visualize the breakdown.
Download sales.csv to your working directory. The sample contains 240 orders across 2025, with products, regions, channels, sales, and profit.
import { AVA } from '@antv/ava';

const ava = new AVA({
  llm: {
    model: '<your-model>',
    apiKey: '<your-api-key>',
    // baseURL: '<your-provider-api-url>',
  },
});

await ava.source({ type: 'csv-file', options: { path: './sales.csv' } });
Measure the overall change using sales, the amount after discounts:
const overview = await ava.analyze(`
  Compare total sales in January and February 2025 using the sales column.
  Include the change and percentage change.
`);
console.log(overview.text);
Expected: sales fell from 38,897.18 to 21,804.11, down 17,093.07 (43.94%).
Find the products contributing to the decline:
const result = await ava.analyze(`
  Compare January and February 2025 sales by product using the sales column.
  Show both months and the change, ordered by the largest decline.
`);
console.log(result.text);
console.table(result.data);
Expected breakdown:
| Product | January sales | February sales | Change |
|---|---|---|---|
| Laptop | 19,688.10 | 3,596.00 | −16,092.10 |
| Standing Desk | 9,655.80 | 5,546.10 | −4,109.70 |
| Monitor | 6,536.25 | 4,731.00 | −1,805.25 |
| Pen Set | 232.20 | 127.71 | −104.49 |
| Bookshelf | 1,225.50 | 1,251.30 | +25.80 |
| Copy Paper | 59.19 | 137.06 | +77.87 |
| Notebook | 31.50 | 137.03 | +105.53 |
| Keyboard | 215.64 | 1,015.31 | +799.67 |
| Office Chair | 1,253.00 | 5,262.60 | +4,009.60 |
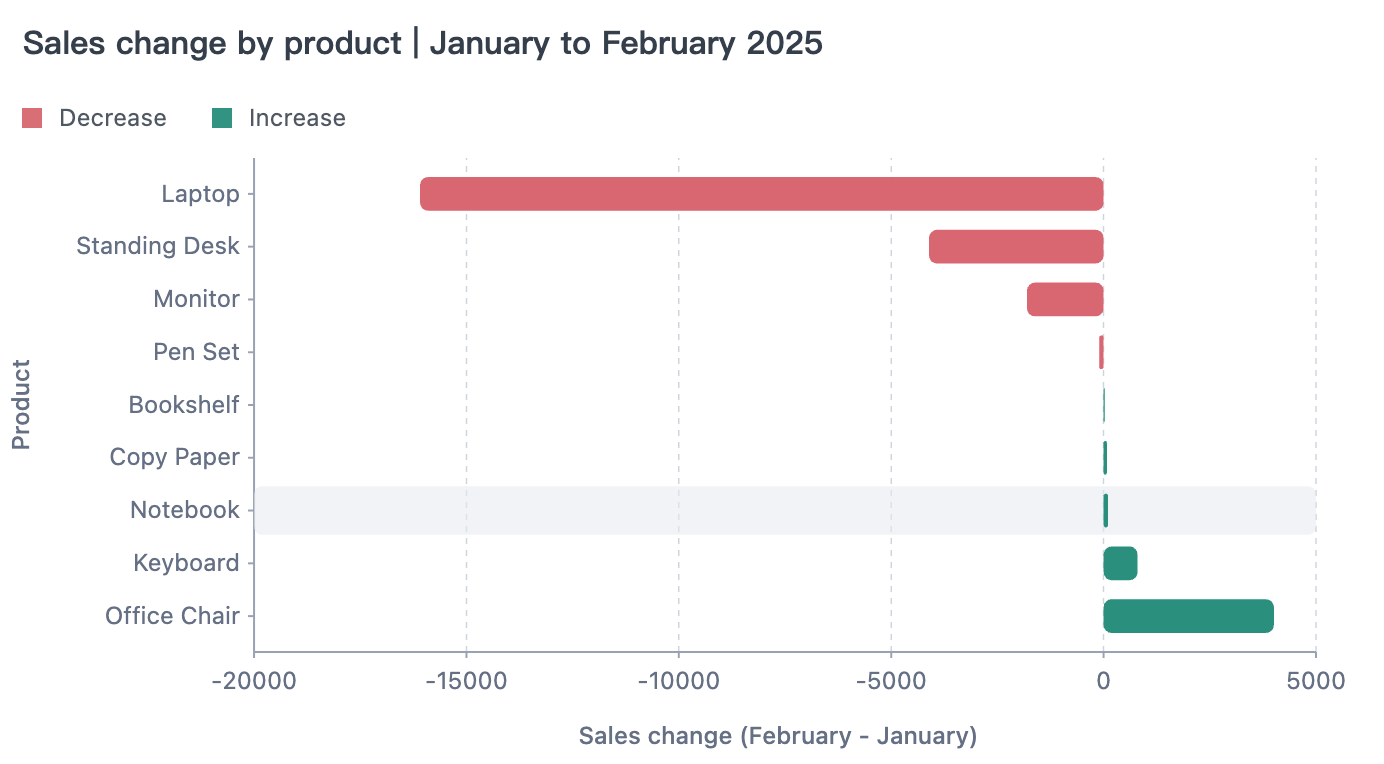
Laptops contributed the largest decline, while office chairs delivered the largest increase.
Chart each product's contribution to the sales change:
import { writeFile } from 'node:fs/promises';

const chart = await ava.visualize({
  query: 'Plot the sales change by product from January to February 2025 as a bar chart.',
  data: result.data,
});
if (chart) {
  await writeFile('sales-change.html', chart.html);
}
Open sales-change.html in a browser with internet access.
Get suggested questions for your data:
const suggestions = await ava.suggest();
console.log(suggestions);
💡 Suggested questions
How do sales change month by month?
Which products contribute the most profit?
How do sales compare across channels?
Check missing values and sales ranges:
console.log(await ava.schema());
console.log(await ava.profile({ metrics: ['row_count', 'null_count', 'min', 'max'] }));
The sample has one missing region and one missing quantity.
Release resources when finished:
await ava.dispose();
Connect files and databases, or load inline data.
Load an Excel workbook with source():
await ava.source({ type: 'excel', options: { path: './sales.xlsx' } });
See the data source guide for connection settings and engine support.
For browser applications, use @antv/ava/browser with inline data. See runtime configuration.
The agent and CLI workflows run on Node.js 22.13+ on macOS or Linux.
Your agent plans the analysis; AVA runs queries and creates charts.
npm install -g @antv/ava@alpha
npx skills add antvis/AVA
In a new agent session, ask:
Use the AVA skill to analyze ./sales.csv. Compare January and February 2025
sales, identify the products contributing most to the change, and save a chart.
This workflow uses your agent's existing model. See agent setup.
Configure your model and load a CSV:
npm install -g @antv/ava@alpha

export OPENAI_API_KEY='<your-api-key>'
export OPENAI_MODEL='<your-model>'
# export OPENAI_BASE_URL='<your-provider-api-url>'

ava source ./sales.csv
Use the dataset ID returned by source:
ava analyze '<your-dataset-id>' 'Compare January and February 2025 sales by product, including the change.'
ava dispose '<your-dataset-id>'
analyze returns the answer as JSON. dispose releases the dataset. See all CLI commands.
Contributions are welcome. Include tests, examples, and documentation with new features.
Run npm test to test your changes. For model-backed tests, copy .env.example to .env and add your model settings.
VizLinter - Chen, Q., Sun, F., Xu, X., Chen, Z., Wang, J. and Cao, N., 2021. VizLinter: A Linter and Fixer Framework for Data Visualization. IEEE transactions on visualization and computer graphics, 28(1), pp.206-216.
《数据可视化设计的类型学实践》(Exploring the Typology of Visualization Design) - 蓝星宇, 王嘉喆. 数据可视化设计的类型学实践, 《美术大观》, 2022(3), 149-152.
MIT
👾 AI-native Visual Analytics framework build for agents.
See the code
AVA (
Install the v4 alpha with Node.js 22.13+:
npm install @antv/ava@alpha
Investigate a monthly sales decline: measure the change, identify the largest contributors, and visualize the breakdown.
Download sales.csv to your working directory. The sample contains 240 orders across 2025, with products, regions, channels, sales, and profit.
import { AVA } from '@antv/ava';

const ava = new AVA({
  llm: {
    model: '<your-model>',
    apiKey: '<your-api-key>',
    // baseURL: '<your-provider-api-url>',
  },
});

await ava.source({ type: 'csv-file', options: { path: './sales.csv' } });
Measure the overall change using sales, the amount after discounts:
const overview = await ava.analyze(`
  Compare total sales in January and February 2025 using the sales column.
  Include the change and percentage change.
`);
console.log(overview.text);
Expected: sales fell from 38,897.18 to 21,804.11, down 17,093.07 (43.94%).
Find the products contributing to the decline:
const result = await ava.analyze(`
  Compare January and February 2025 sales by product using the sales column.
  Show both months and the change, ordered by the largest decline.
`);
console.log(result.text);
console.table(result.data);
Expected breakdown:
| Product | January sales | February sales | Change |
|---|---|---|---|
| Laptop | 19,688.10 | 3,596.00 | −16,092.10 |
| Standing Desk | 9,655.80 | 5,546.10 | −4,109.70 |
| Monitor | 6,536.25 | 4,731.00 | −1,805.25 |
| Pen Set | 232.20 | 127.71 | −104.49 |
| Bookshelf | 1,225.50 | 1,251.30 | +25.80 |
| Copy Paper | 59.19 | 137.06 | +77.87 |
| Notebook | 31.50 | 137.03 | +105.53 |
| Keyboard | 215.64 | 1,015.31 | +799.67 |
| Office Chair | 1,253.00 | 5,262.60 | +4,009.60 |
Laptops contributed the largest decline, while office chairs delivered the largest increase.
Chart each product's contribution to the sales change:
import { writeFile } from 'node:fs/promises';

const chart = await ava.visualize({
  query: 'Plot the sales change by product from January to February 2025 as a bar chart.',
  data: result.data,
});
if (chart) {
  await writeFile('sales-change.html', chart.html);
}
Open sales-change.html in a browser with internet access.
Get suggested questions for your data:
const suggestions = await ava.suggest();
console.log(suggestions);
💡 Suggested questions
How do sales change month by month?
Which products contribute the most profit?
How do sales compare across channels?
Check missing values and sales ranges:
console.log(await ava.schema());
console.log(await ava.profile({ metrics: ['row_count', 'null_count', 'min', 'max'] }));
The sample has one missing region and one missing quantity.
Release resources when finished:
await ava.dispose();
Connect files and databases, or load inline data.
Load an Excel workbook with source():
await ava.source({ type: 'excel', options: { path: './sales.xlsx' } });
See the data source guide for connection settings and engine support.
For browser applications, use @antv/ava/browser with inline data. See runtime configuration.
The agent and CLI workflows run on Node.js 22.13+ on macOS or Linux.
Your agent plans the analysis; AVA runs queries and creates charts.
npm install -g @antv/ava@alpha
npx skills add antvis/AVA
In a new agent session, ask:
Use the AVA skill to analyze ./sales.csv. Compare January and February 2025
sales, identify the products contributing most to the change, and save a chart.
This workflow uses your agent's existing model. See agent setup.
Configure your model and load a CSV:
npm install -g @antv/ava@alpha

export OPENAI_API_KEY='<your-api-key>'
export OPENAI_MODEL='<your-model>'
# export OPENAI_BASE_URL='<your-provider-api-url>'

ava source ./sales.csv
Use the dataset ID returned by source:
ava analyze '<your-dataset-id>' 'Compare January and February 2025 sales by product, including the change.'
ava dispose '<your-dataset-id>'
analyze returns the answer as JSON. dispose releases the dataset. See all CLI commands.
Contributions are welcome. Include tests, examples, and documentation with new features.
Run npm test to test your changes. For model-backed tests, copy .env.example to .env and add your model settings.
VizLinter - Chen, Q., Sun, F., Xu, X., Chen, Z., Wang, J. and Cao, N., 2021. VizLinter: A Linter and Fixer Framework for Data Visualization. IEEE transactions on visualization and computer graphics, 28(1), pp.206-216.
《数据可视化设计的类型学实践》(Exploring the Typology of Visualization Design) - 蓝星宇, 王嘉喆. 数据可视化设计的类型学实践, 《美术大观》, 2022(3), 149-152.
MIT