
See what people are saying
README
flattensf
flattensf.com: the flattest route between any two places in San Francisco, and every route between it and the shortest.
Behind it, an analysis of the city's hidden network of relatively flat streets: the routes that connect San Francisco's neighborhoods while climbing as little as possible.
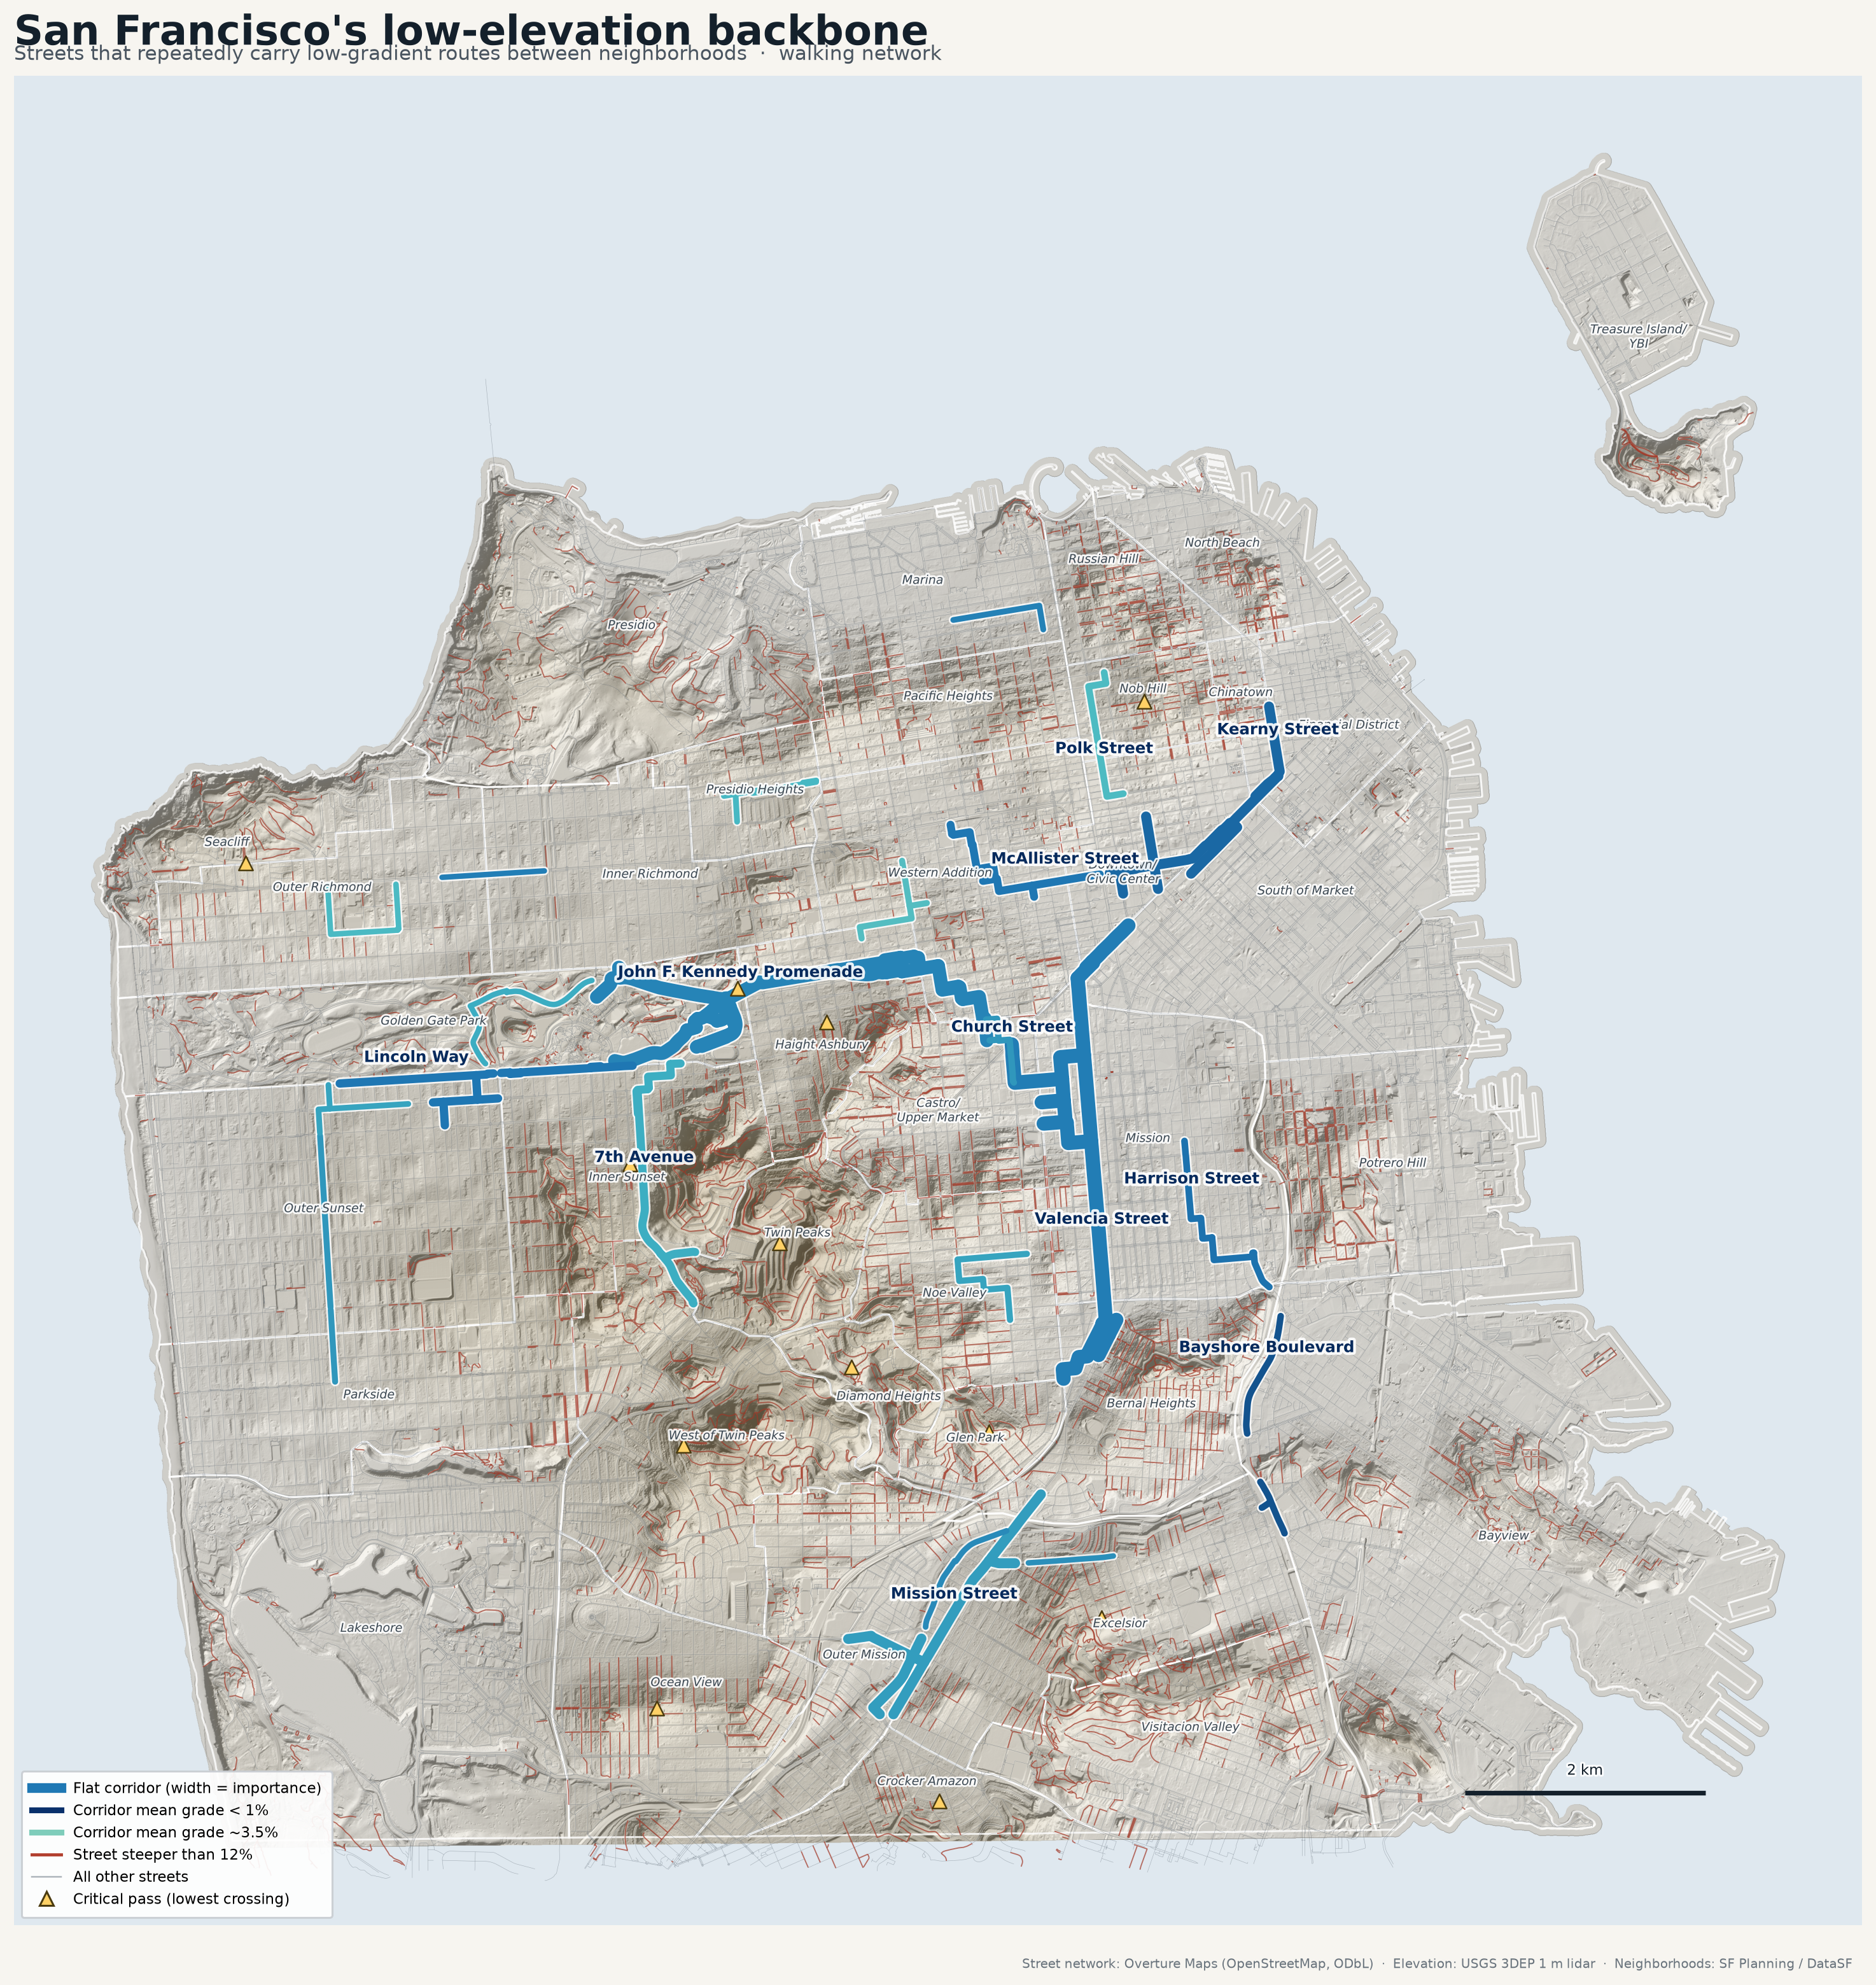
San Francisco is famously hilly, but it is hilly in a structured way. Its hills are separated by valleys, saddles and old dune flats, and those low places join up into a network that is far more continuous than the city's reputation suggests. This project models that network from authoritative elevation and street data, routes across it under several competing definitions of "flat", and then works out which streets the city's geography forces low-gradient traffic onto.
The central result: about 14% more walking buys about 39% less climbing. Averaged over all 1,260 ordered neighborhood pairs, the minimum-climbing pedestrian route is only 14% longer than the shortest one, yet avoids 39% of the ascent and drops the typical steepest pitch from 27% to 17%.
The full write-up is in outputs/findings.md, and
the checks against known ground truth are in
outputs/validation_report.md.
The route finder
Live: flattensf.com
Type where you are and where you are going, then drag the slider from shortest to flattest and watch the route change. Every position is a real route, solved in your browser over the full street graph with the same cost model the analysis uses; the slider scales how much a foot of climbing costs relative to a foot of walking, from nothing to enough that the route avoids every avoidable hill. The numbers and the elevation profile follow along, and the faint lines are the other members of the family, so you can see where the routes agree and where they part.
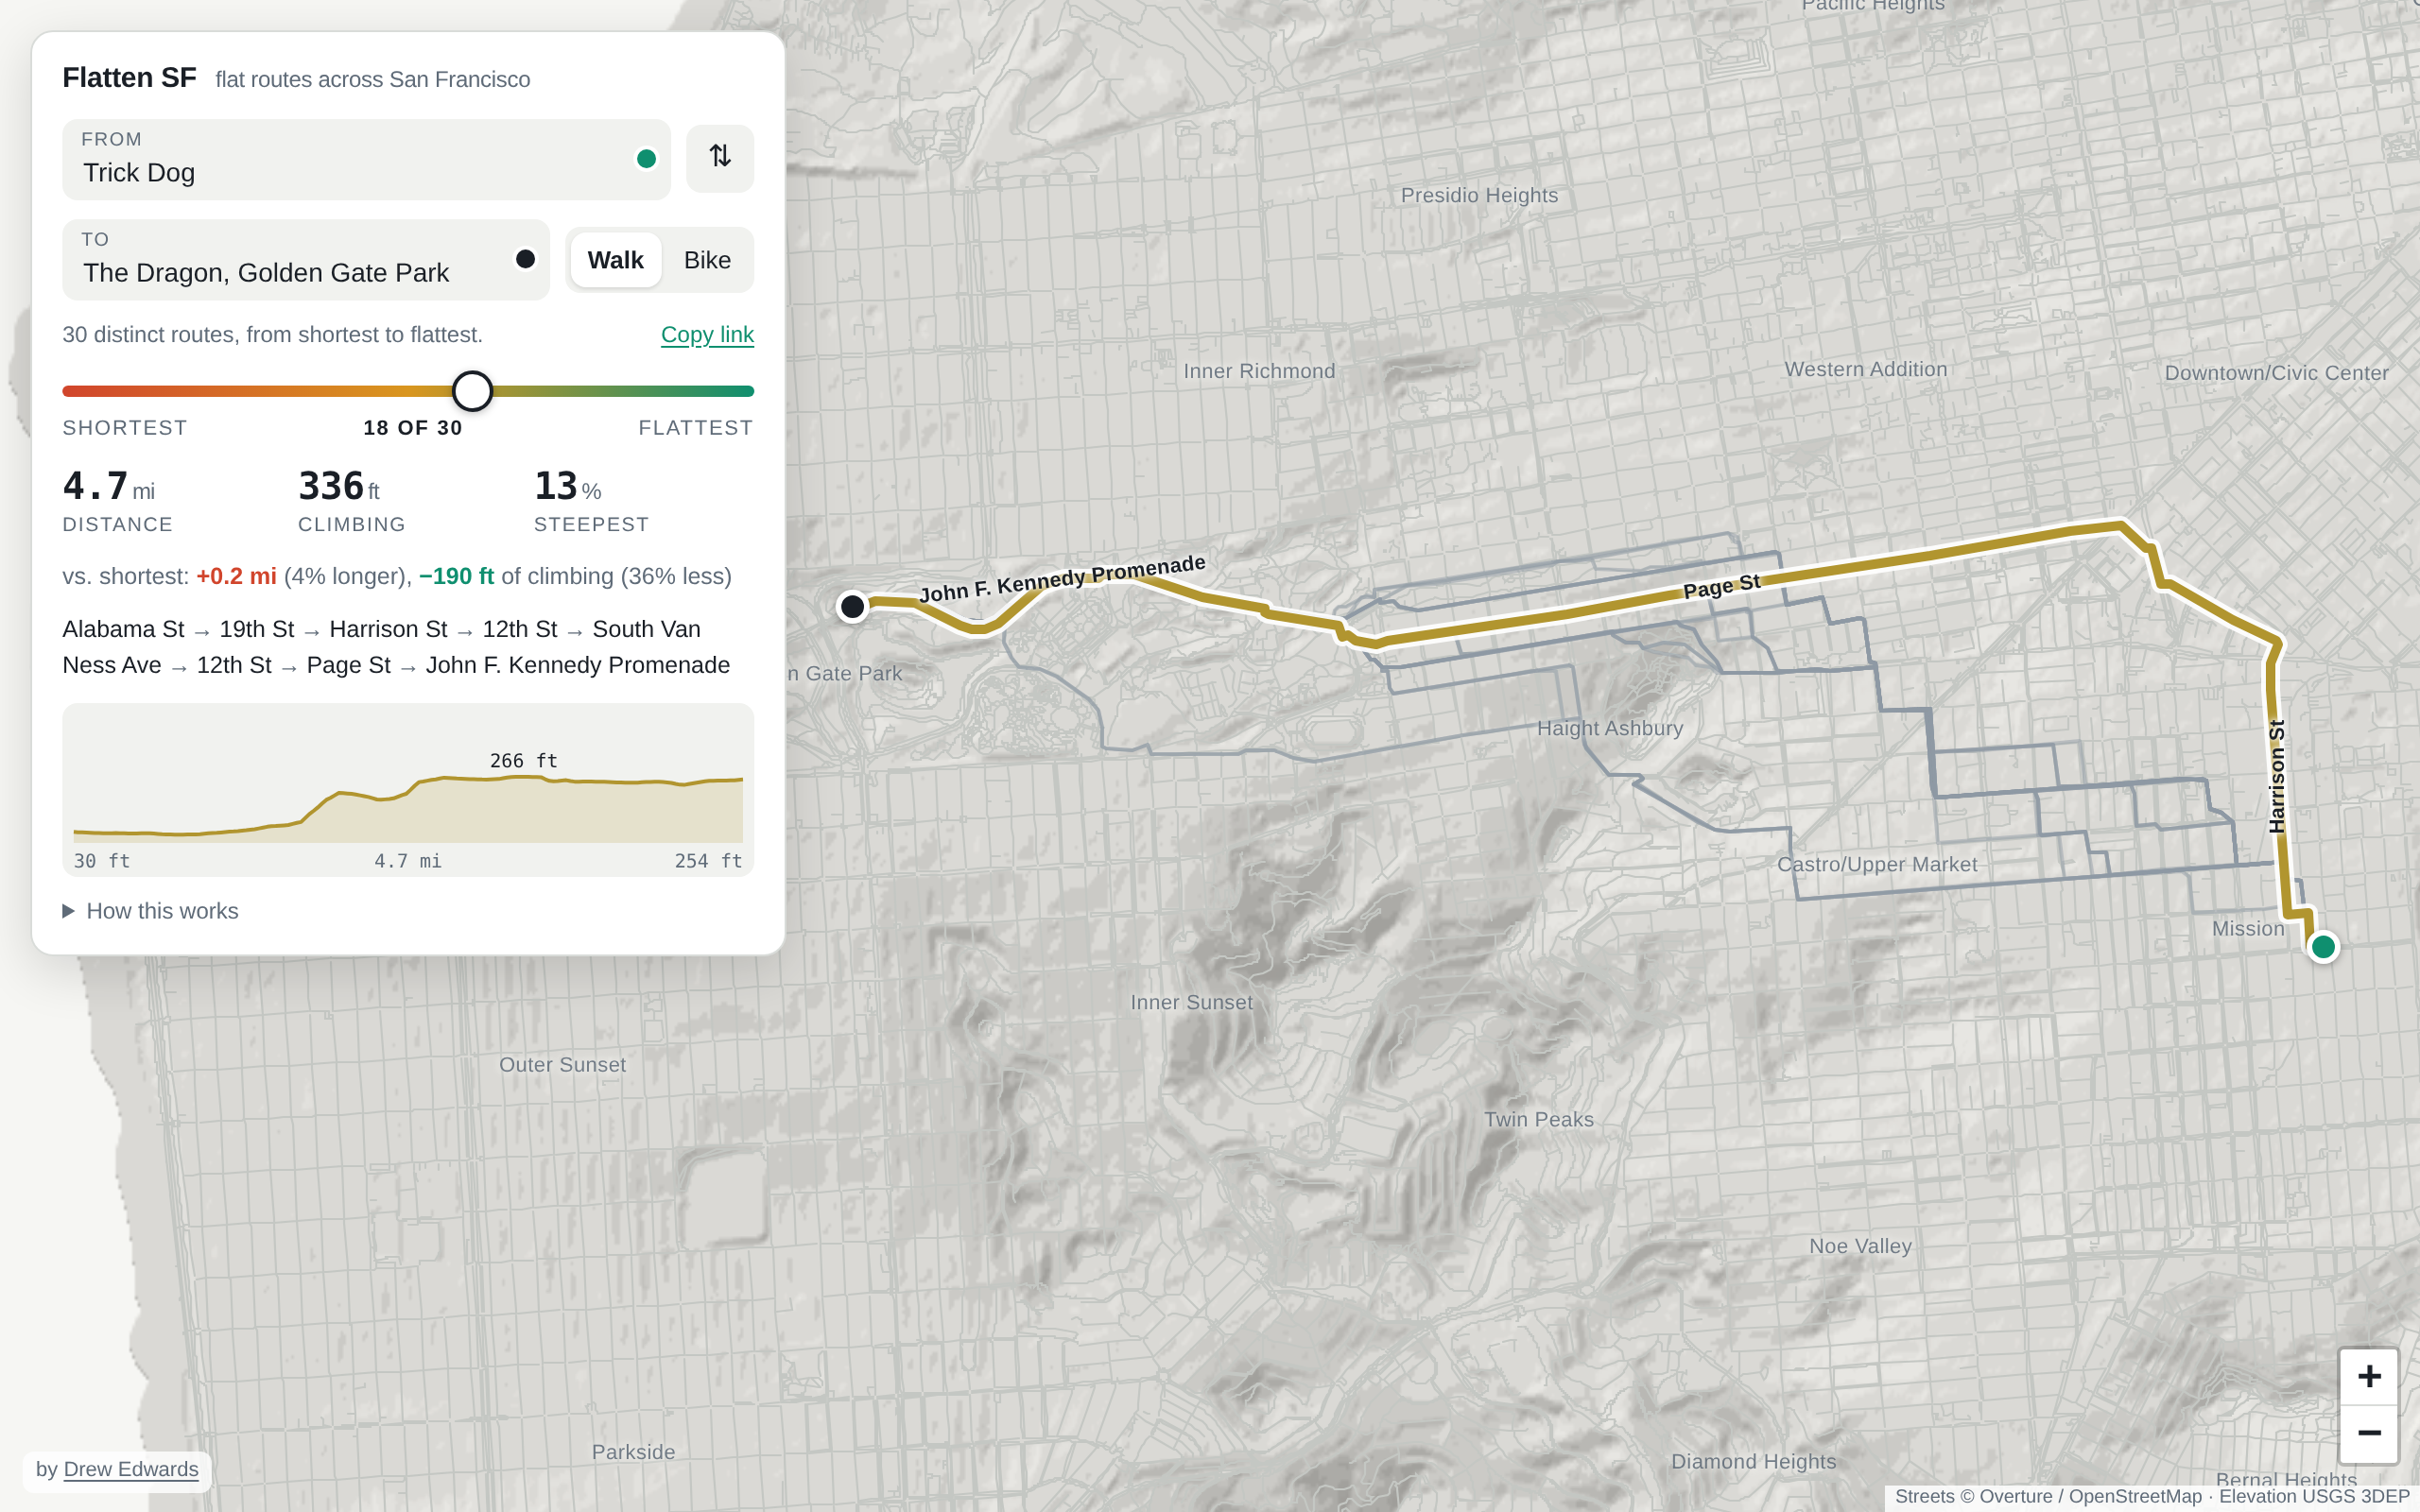
Place search is offline: street intersections ("24th & Mission"), addresses ("1234 Valencia") and about 10,000 parks, landmarks, stations, schools, shops and cafes are built into the page from the street graph and Overture's places, addresses and base themes. No geocoding API, so no key to leak and nothing to pay for. You can also click the map, or drag either pin. "Copy link" gives a URL that reopens the exact trip.
The site is static: site/ holds the page, its CSS and JS, the
whole street graph as one 4.8 MB gzipped file and the hillshade as a PNG,
and GitHub Pages serves it as is. Loading it cold takes a couple of seconds
on a decent connection; after that every route is solved locally. The same
page is also written as one self-contained 6.8 MB file,
outputs/sf_flat_route_finder.html,
which opens straight from disk.
The explorer
outputs/sf_flat_routes_map.html is the
working view of the analysis: the network coloured by gradient, the
discovered corridors, passes, barriers and basins as toggleable layers, the
four objectives with live α/β/γ sliders, a Pareto readout, and the warped
city below. It is dense by design.
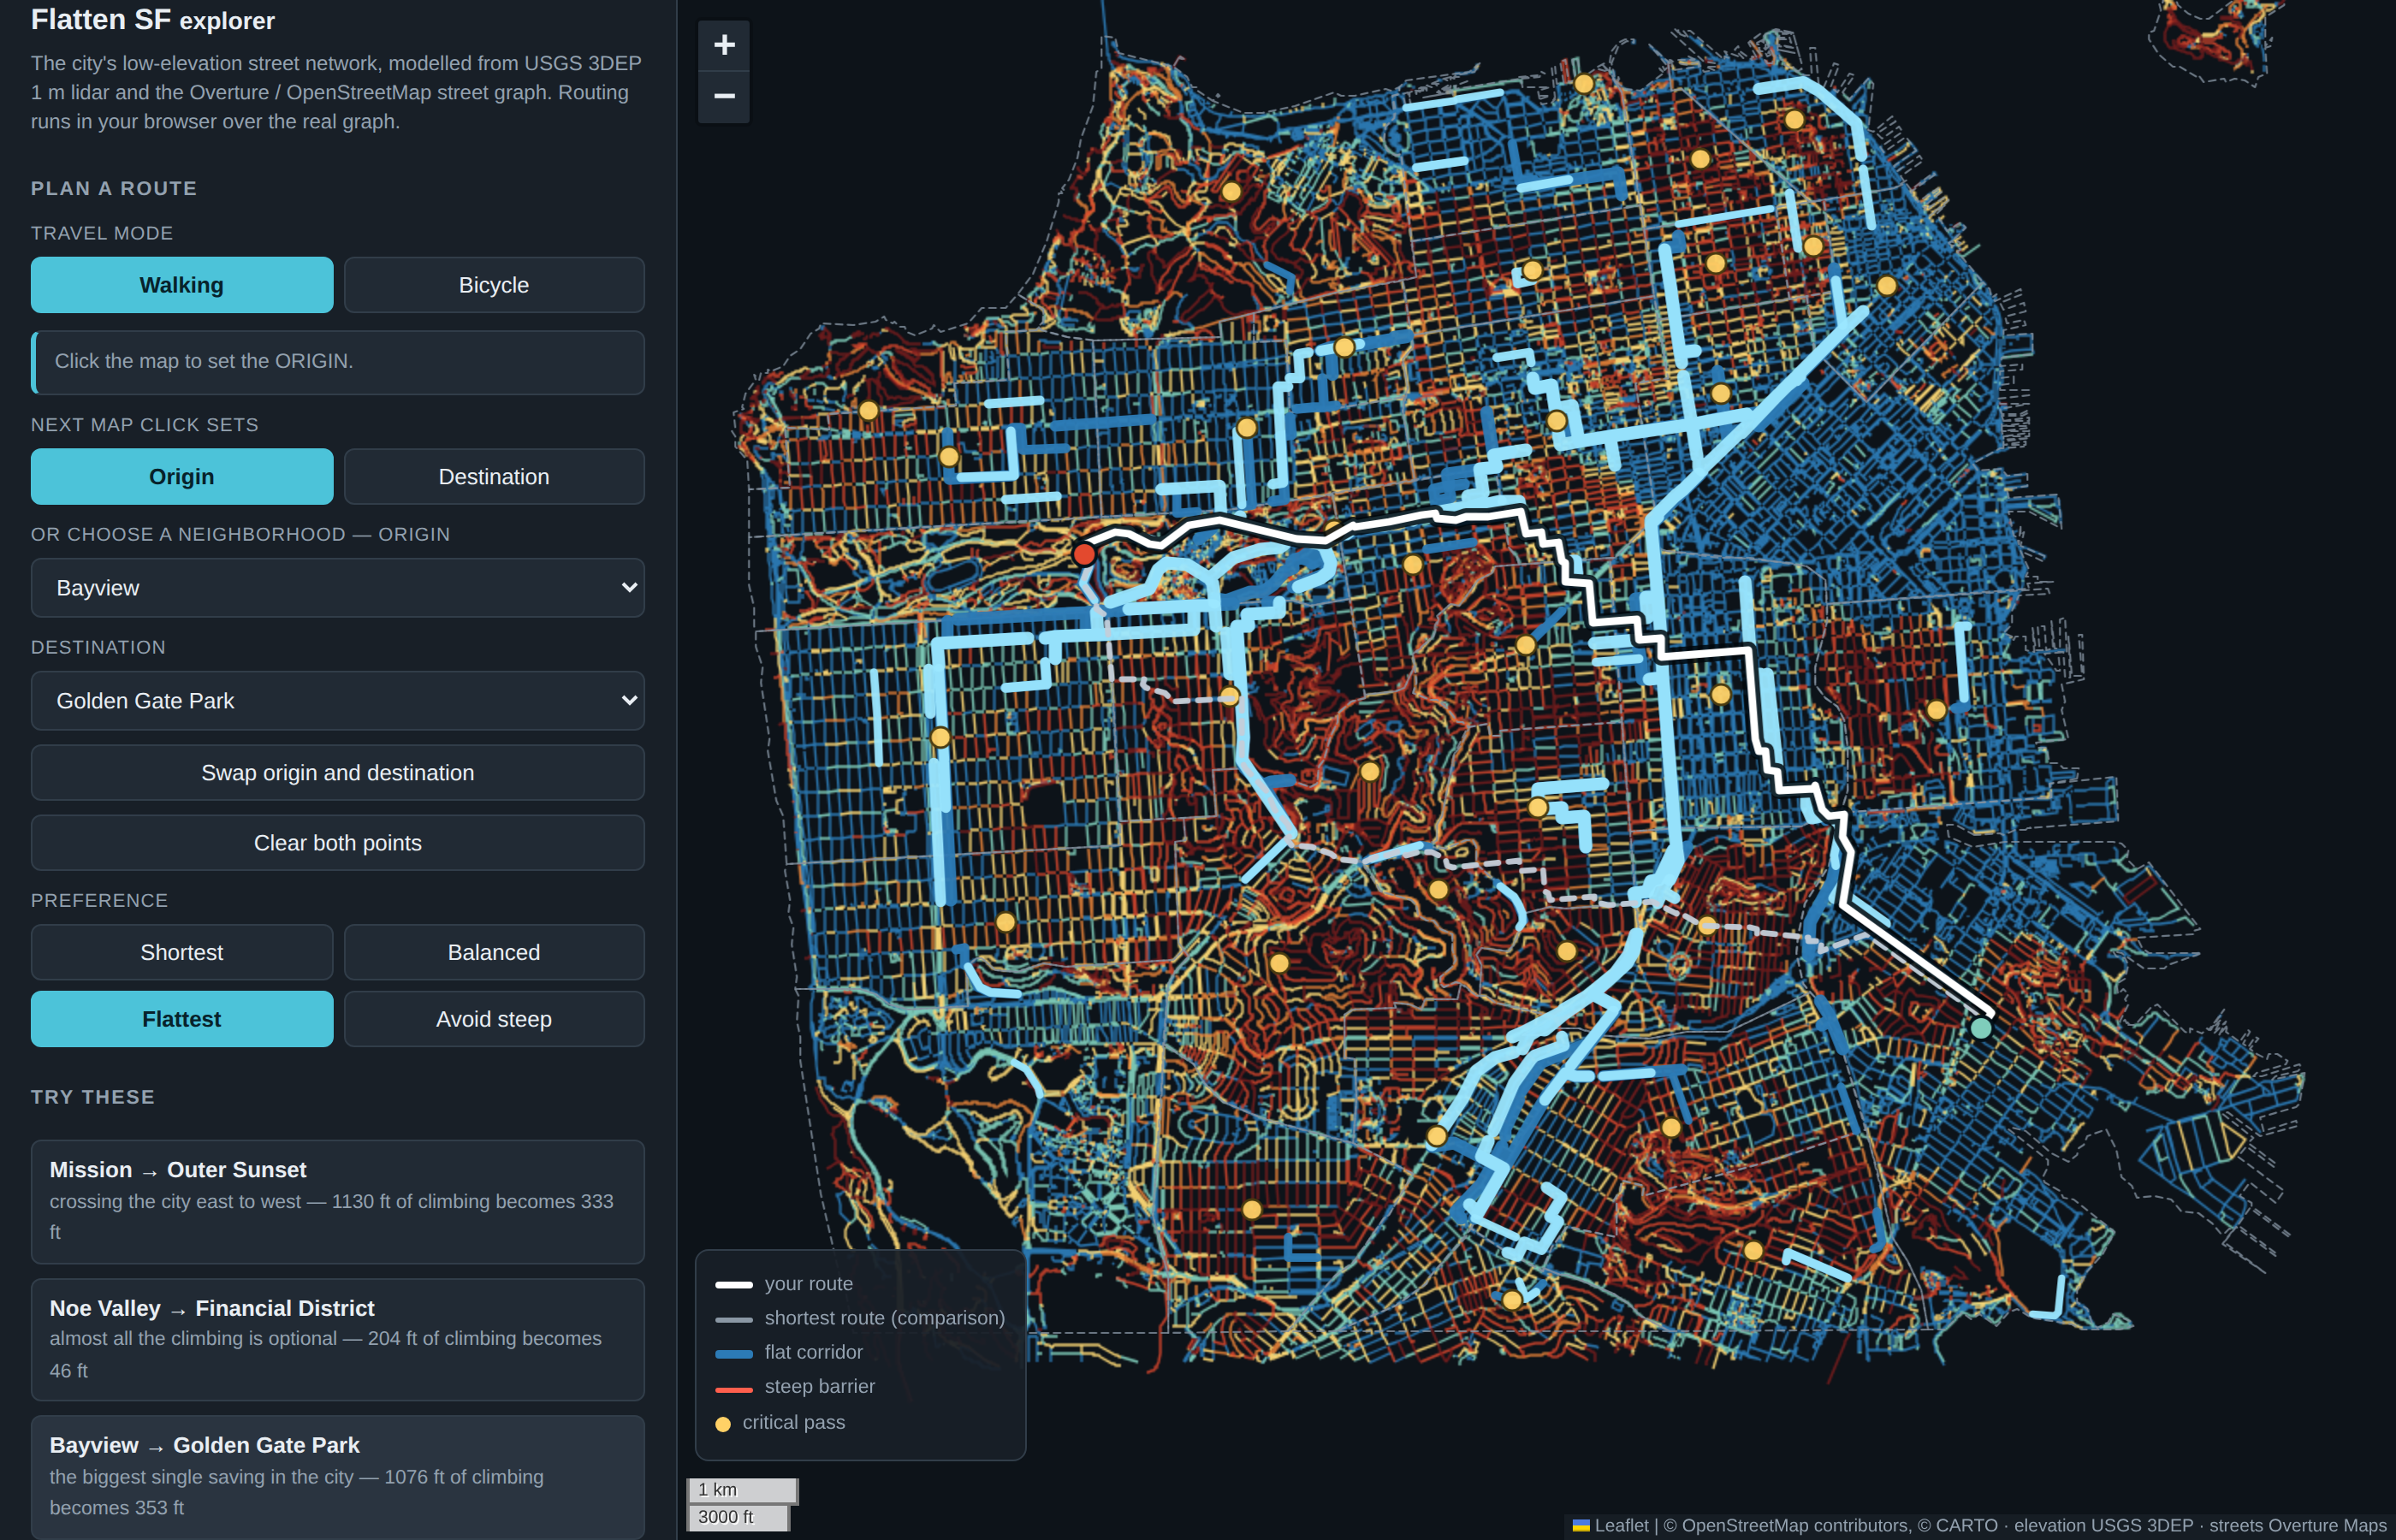
Here it is showing the flattest walking route from the Bayview to Golden Gate Park: 7.67 miles and 353 ft of climbing, against 7.01 miles and 1,076 ft for the shortest one. The red arcs are the streets steeper than 10% — they trace the city's hills like contours — and the thick pale blue lines are the flat corridors the analysis discovered. The route threads between them.
The warped city
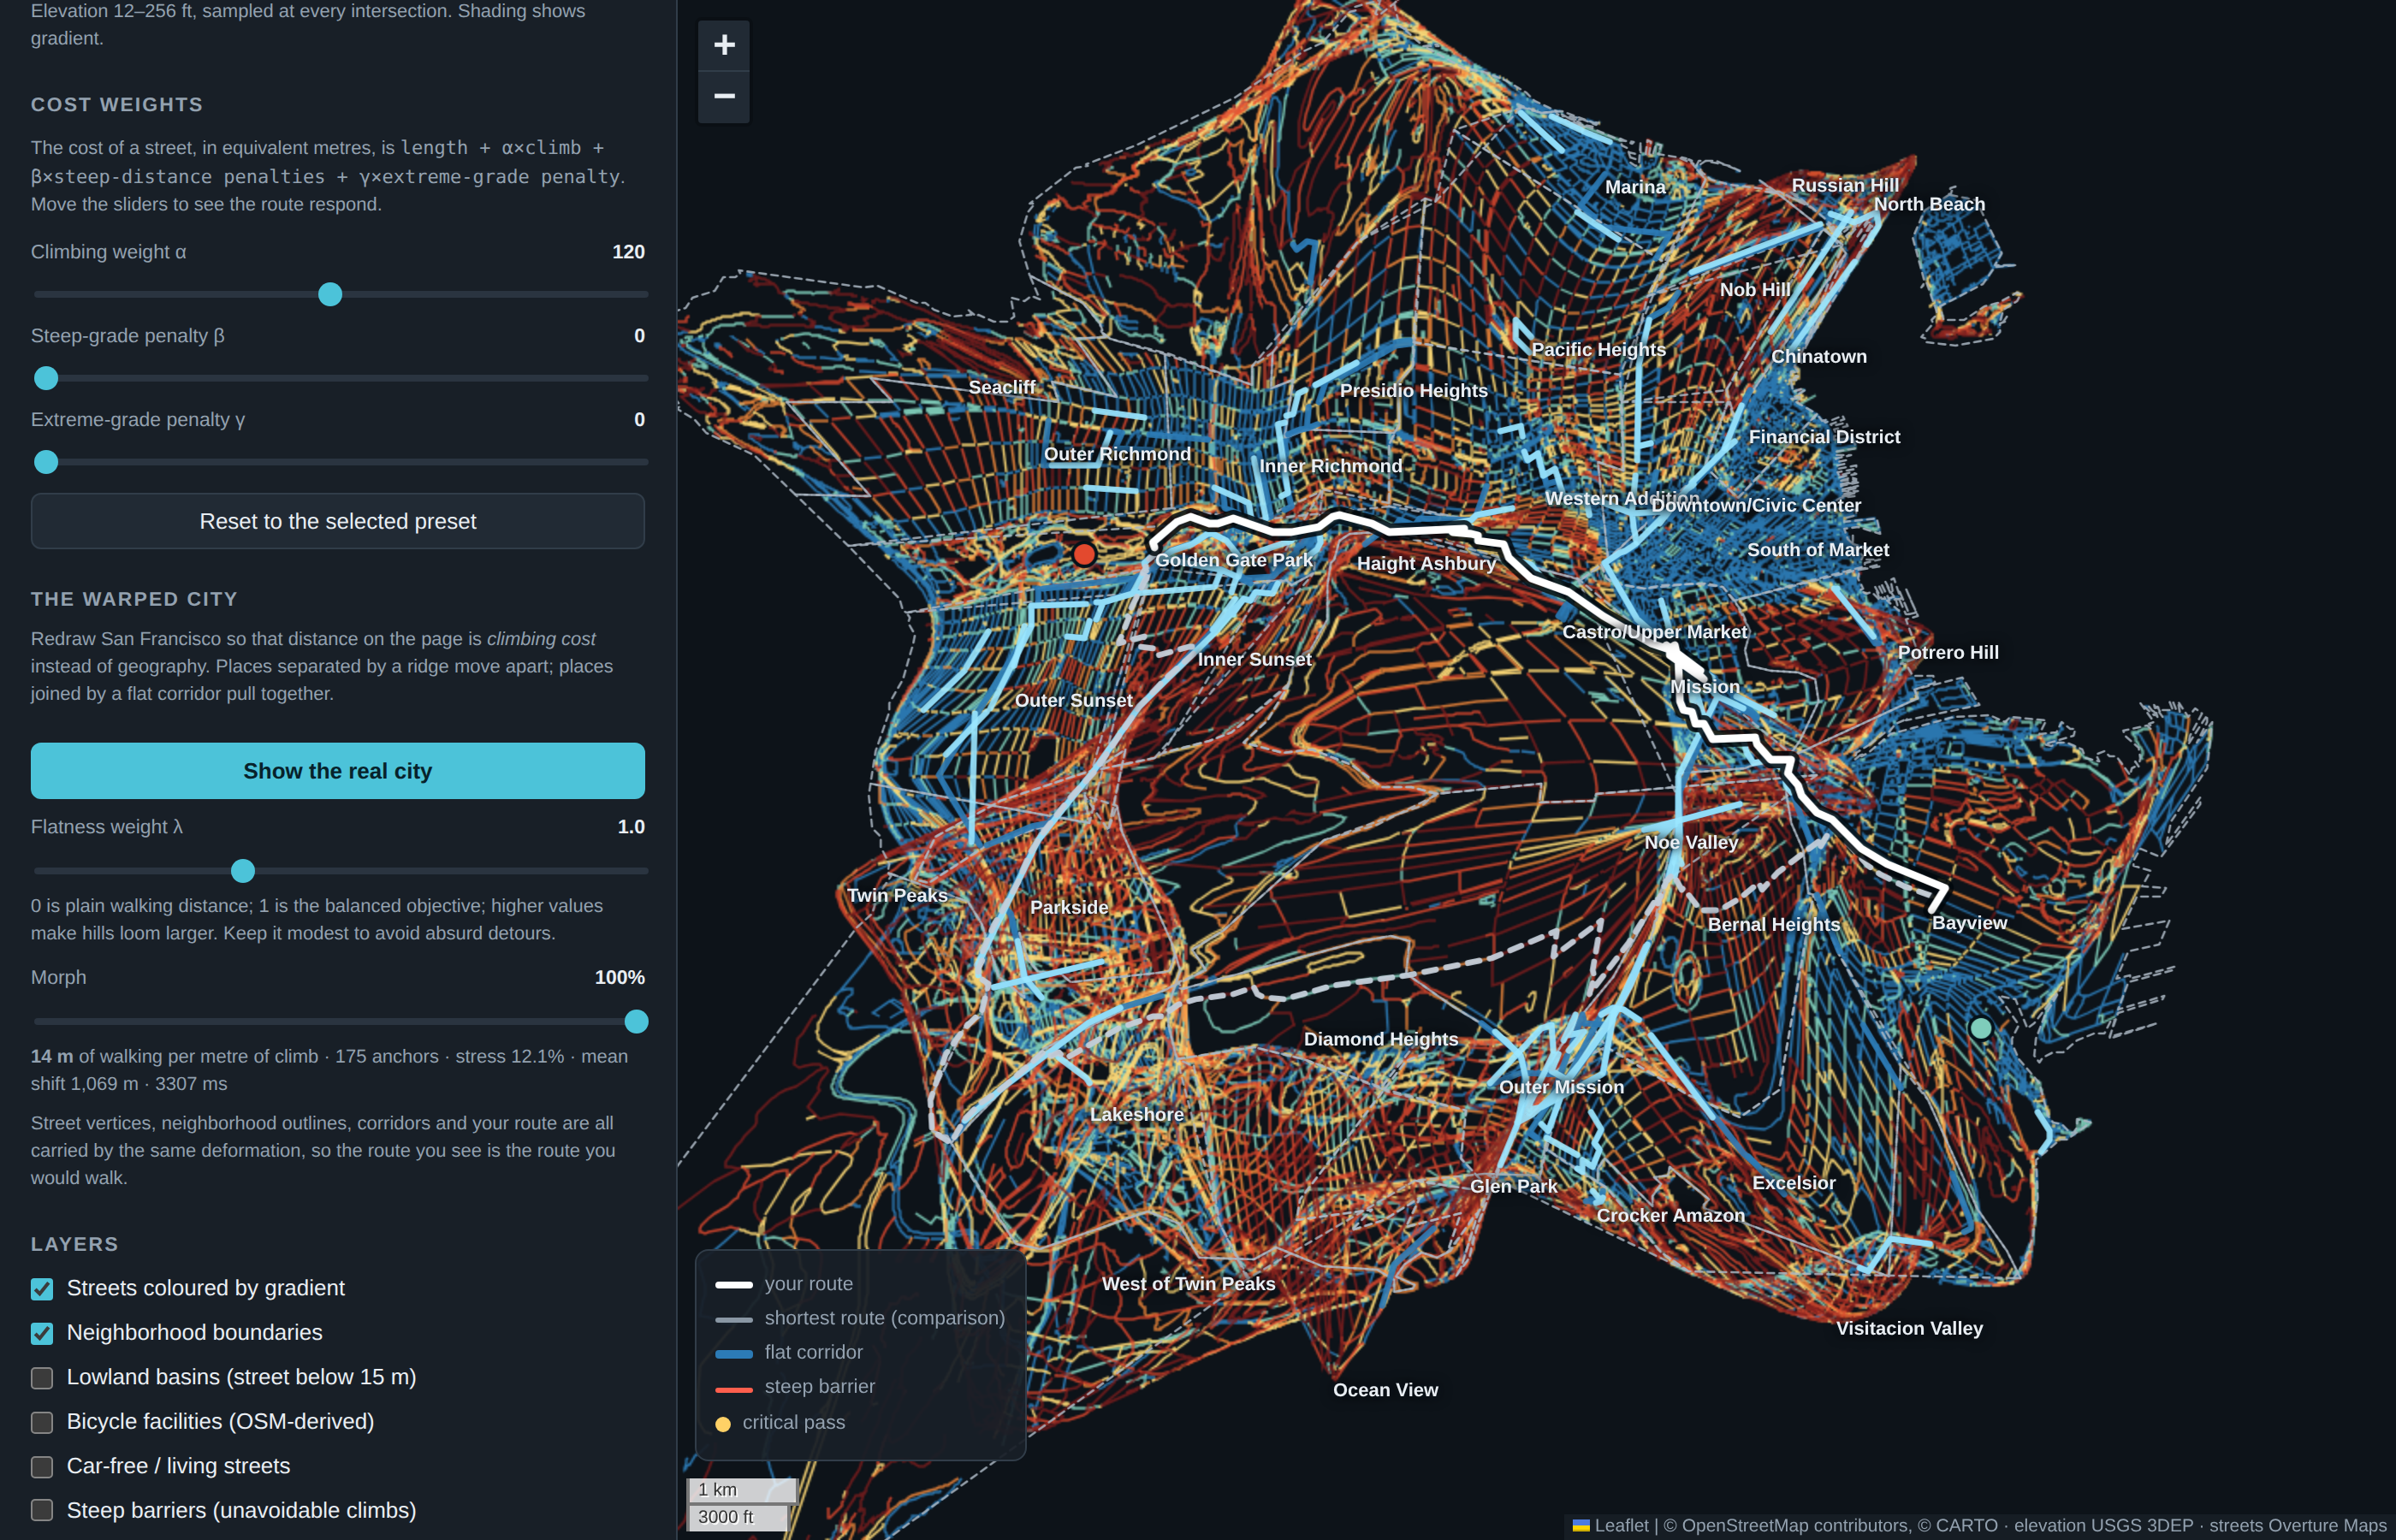
The map can also redraw the city so that distance on the page means climbing cost rather than geography. Places separated by a ridge move apart; places joined by a flat corridor pull together. Twin Peaks drifts almost 5 km from where it sits, West of Twin Peaks 3 km, Glen Park 2 km, while Bernal Heights and Nob Hill barely move: they are hilly, but they are hilly next to the flats.
The deformation is driven by the same cost model as the routes, with one knob: how many metres of walking a metre of climb is worth. At λ = 0 the page shows plain network distance (even then the Bay and the park bend things), λ = 1 is the balanced objective, and higher values make the hills loom larger; keeping it modest is what stops the routes becoming absurd. A morph slider runs the real city into the warped one.
Method: about 175 anchor intersections (every neighborhood's access point plus a 1 km lattice snapped to routable nodes) get a full cost matrix from the in-page router; stress majorisation (SMACOF, unit weights) lays them out so page distance matches cost, starting from their true positions so the result is the least deformation that fits; a Procrustes fit turns and scales the layout back onto geography so north stays up; and a thin-plate spline through the anchors' displacements carries every street vertex, neighborhood outline, corridor and route along with it. The whole thing takes about three seconds in the browser, so the weight can be changed live.
This was prompted by a friend's piece that redraws cities by travel time; the idea of warping a city by a non-geographic metric is theirs, the metric and the construction here are different.
What it produces
| Output | What it is |
|---|---|
outputs/sf_flat_route_finder.html | The route finder: origin, destination, walk or bike, and a slider from the shortest route to the flattest, with offline place search. Self-contained — Leaflet, the whole 160,000-arc graph, the place index and a lidar hillshade are embedded. This is the page to share. |
site/ | The route finder as a static site (the same page with the graph and hillshade as separate cacheable files), deployed to GitHub Pages by .github/workflows/pages.yml. |
outputs/sf_flat_routes_map.html | The explorer: every analysis layer, the four objectives with live α/β/γ sliders, Pareto readout and the warped city. Routes in the browser over the same graph. |
outputs/sf_flat_backbone.png / .pdf | Publication-quality static map of the low-elevation backbone, over a hillshade computed from the same lidar the analysis uses. |
outputs/sf_street_grades.png | Citywide street-gradient map. |
outputs/screenshot_route_finder.png, screenshot_interactive.png | Screenshots of the two pages, for anywhere the HTML cannot be rendered. |
outputs/screenshot_warped.png | Screenshot of the city warped by climbing cost. |
outputs/findings.md | Written analysis of the major findings. Every figure is generated from the outputs, not typed in. |
outputs/validation_report.md | Validation against an independent DEM, documented street gradients and known flat corridors. |
outputs/flat_corridors.geojson / .gpkg / .csv | The discovered low-elevation corridors: street names, endpoints in lon/lat, neighborhoods connected, length, elevation range, gradient and importance metrics. |
outputs/neighborhood_pairs.csv | 10,080 routes: every ordered neighborhood pair × 4 objectives × 2 modes, with full metrics. |
outputs/pareto_frontier.csv | Distance / climbing / peak-gradient trade-off frontiers for every ordered pair. |
outputs/sensitivity.md / .csv | Every finding recomputed under ten perturbations of the elevation parameters and access points. |
outputs/passes.geojson / .csv, outputs/pass_matrix.csv | Critical passes, and the lowest possible crossing elevation for every neighborhood pair. |
outputs/barriers.geojson / .csv | Steep streets that inter-neighborhood traffic cannot avoid. |
outputs/lowland_basins.geojson | The city's flat districts, delineated below 15 m. |
data/processed/sf_street_network.gpkg | Processed street network as a GeoPackage, ready to open in QGIS or ArcGIS: 87,776 edges with gradient, climbing and access attributes. |
data/processed/edges_metrics.parquet, edges_directed.parquet | The same network as Parquet, plus the full per-direction metric table (175,552 directed edges). |
Headline findings
- Two spines carry the city. The Mission valley floor (Valencia–Guerrero– Market–16th, 6.9 km at 1.3% mean gradient) runs north–south; the Wiggle–Panhandle–Golden Gate Park chain (7.6 km) runs east–west. The analysis was not told either existed.
- The Wiggle emerges unprompted. Asked for a flat bicycle route from Market at Duboce to Haight at Masonic, the model returns the Wiggle. Both routes must gain the same unavoidable 47 m; the shortest one throws away a further 19.2 m of climbing getting there, the Wiggle only 5.9 m — for 0.4% more distance.
- One pass dominates the city. An unnamed path in Golden Gate Park at ~255 ft is the binding constraint for 119 of 630 neighborhood pairs — the lowest point on the ridge dividing the eastern flats from the ocean side. Crossing San Francisco east–west costs that 255 ft whatever you do.
- Twin Peaks has no cheap way over it. The lowest crossings into West of Twin Peaks and Diamond Heights are Lansdale Avenue (696 ft) and Panorama Drive (635 ft). These neighborhoods are the ones the flat network cannot reach.
- Total climbing and peak steepness are different objectives. The grade-averse route climbs more in total than the flattest route (325 ft vs 281 ft) while holding the steepest pitch to 10.8% instead of 17.2%. No single definition of "flat" serves both.
Methodology
Elevation
Elevation accuracy drives everything else, so the method is deliberate.
- Source. USGS 3DEP 1 m bare-earth lidar, project
CA_SanFrancisco_B23— four cloud-optimised GeoTIFF tiles in EPSG:26910 (NAD83 / UTM 10N), which is also the CRS used for every length and slope computation. No raster reprojection is ever performed. - Noise suppression, spatially. A Gaussian filter of σ = 3 m is applied to the DEM before sampling. Bare-earth lidar still contains decimetre-scale artefacts from curbs, parked vehicles, vegetation misclassification and interpolation over occlusions. σ = 3 m is far narrower than a San Francisco street (15–25 m kerb to kerb) and far narrower than the ~100 m block scale on which real street gradient varies.
- Sampling at 5 m. Chosen empirically. At 10 m spacing the short steep pitches that give the city its reputation were measurably clipped — Bradford Street read 36.8% against a documented 41%, Prentiss Street 32.9% against 37% — while sampling at 5 m returns 41.4% and 36.9% respectively before smoothing.
- Structures. Where an edge is flagged
is_bridgeoris_tunnelthe DEM describes the ground or water under the deck. Such edges get a linear ramp between their endpoints; endpoints that are themselves unreliable (mid-viaduct nodes) are recovered by solving a discrete Laplace problem over the structure sub-graph with the reliable nodes as boundary conditions — the deck is modelled as the smoothest ramp consistent with where it meets the ground. - Smoothing per street segment, not per edge. A Savitzky–Golay filter (order 2, ~50 m window) is applied to the concatenated profile of each contiguous run of a street segment. Smoothing edges in isolation gave the two edges either side of an intersection different elevations for the same corner, and in San Francisco that happens every 80 m.
- One elevation per intersection. Each node is reconciled to a single elevation and every profile is rubber-sheeted onto it with a linear correction (0.02 m on average). This makes per-edge climbing sum exactly to the difference between a route's endpoints.
- Dead-band on cumulative gain. Cumulative gain and loss are computed after pruning every elevation reversal smaller than 0.5 m. Pruning replaces a run by its monotone envelope clamped to the run's endpoints, so an oscillation below the dead-band contributes no gain at all, while a genuine sustained climb is preserved to the millimetre and the shape within the run is preserved — which is what makes per-edge figures additive along a route.
The last two points matter more than they sound. Two earlier implementations were measurably wrong and are kept as regression tests: a backlash-operator dead-band charged one dead-band per edge and lost 17 m of real climbing on a route over Twin Peaks, and a linear-interpolation rectifier redistributed climbing within a segment with errors reaching 51 m.
Validation (full report in
outputs/validation_report.md):
- Against the independent USGS 1/3 arc-second DEM at 4,000 random points: mean difference −0.02 m, RMS 0.68 m, 98.5% within 2 m.
- Against documented street gradients: 6 of 8 within 5 percentage points
(Filbert 32.9% vs 31.5%, 22nd Street 32.6% vs 31.5%, Jones 31.1% vs 29.0%,
Prentiss 32.9% vs 37%, Baden 34.5% vs 32%, Duboce 28.8% vs 27.5%). Of the
two that miss, Nevada Street is a classification issue — its published
35% pitch is tagged
stepsin OpenStreetMap and measures 34.6% as a stairway — and Bradford Street is smoothing attenuation, discussed under Limitations. The model was not changed to fit either. - The Embarcadero and the Great Highway, the city's two genuinely level corridors, come out at 1.07 and 1.16 m of climbing per km. Jones Street comes out at 39.5 m/km — a 37-fold separation.
- Internal invariants asserted in the test suite: per-edge
gain − loss == net_changeholds to 0.0 for all 175,552 directed edges, and no node has an inconsistent elevation.
Sensitivity (python -m sf_flat_routes sensitivity; tables in
outputs/sensitivity.md). The whole pipeline was
rebuilt under ten one-at-a-time changes to the elevation parameters (sample
spacing 2.5/10 m, smoothing window 12.5/50 m, dead-band 0.25/1 m, spatial
pre-filter 0/6 m) and to which intersection stands in for each neighborhood
(second- and third-nearest). The headline moves from +14% / 39% to at most
+15% / 40%; the dominant pass is the same Golden Gate Park crossing at 255 ft
in all eleven runs; the Wiggle wins in all eleven. The corridors are the least
rigid part: the street that qualifies as corridor material is 71–99% the same
by length, and 8–12 of the top twelve lead streets keep their place, but
where each corridor is cut, and so what it is called, shifts — most under the
smoothing window — and a handful of borderline streets (Market, Divisadero,
24th, Greenwich among them) drift in and out of the top twelve. They should be
read as a tier, not a ranking.
Street network
Overture Maps' transportation theme (OpenStreetMap-derived, ODbL). Topology comes from Overture connectors: every segment lists the connector IDs it touches with the fractional position along its own geometry, so splitting at those positions and keying nodes by connector ID gives exact topology with no snapping tolerance, and grade-separated crossings correctly stay unconnected.
Reading it is cheap despite the theme being ~64 GB: Parquet row-group
statistics on the bbox column mean only 7 of 16,384 global row groups
intersect San Francisco, so the extract takes seconds and ~10 MB.
Access is derived from Overture access_restrictions, whose rule shapes in
San Francisco are denied + heading=backward (one-way, 7,034 segments),
per-mode denied/allowed/designated, and as_private /
at_destination conditional access. One-way is enforced for bicycles and
ignored for pedestrians, since OSM oneway describes vehicle movement;
contraflow bicycle lanes are honoured.
Two classification facts shaped the mode filters, both verified against the data rather than assumed:
trunkincludes Van Ness Avenue, 19th Avenue, Lombard Street and part of Mission Street — ordinary surface streets with sidewalks.trunktherefore cannot be excluded from walking or cycling.motorwayis true grade-separated freeway and is excluded.steps(2,652 edges, 35 km) is a real part of the pedestrian network and is excluded outright for bicycles. A route suitable for a pedestrian is emphatically not necessarily rideable.sidewalkandcrosswalksubclasses are excluded for both modes: travel is modelled along street centrelines, because including the sidewalk network would represent every street two or three times and wreck corridor aggregation.
Routing model
Edge cost, in "equivalent metres" — the distance a traveller would consider as bad as this edge:
cost = length × mode_multiplier(class)
     + α × cumulative_gain
     + β × Σₖ penaltyₖ × distance_above_thresholdₖ
     + γ × extreme_extra × distance_above_highest_threshold
The threshold terms are cumulative: 100 m at 12% incurs the 3%, 5%, 8%
and 10% penalties simultaneously, so the marginal cost of steepness rises
super-linearly rather than staying flat. α is the substitution rate between
climbing and distance — Naismith's rule for walking implies about 8 m of flat
walking per metre climbed.
Only cumulative_gain ever enters the cost, never net elevation change. A
route that climbs 120 m and descends 120 m has zero net change and is not
flat; that is the analytical point of the project, and it is asserted in the
test suite.
Four objectives, all configured in sf_flat_routes/config.py:
| Objective | α | β | γ | Intent |
|---|---|---|---|---|
shortest | 0 | 0 | 0 | distance only (comfort multipliers off, so it is a true baseline) |
min_climb | 120 | 0 | 0 | near-lexicographic preference for avoiding ascent |
grade_averse | 4 | 12 | 6 | steep segments dominate; total ascent secondary |
balanced | 14 | 2 | 2 | flat but without absurd detours |
Bicycle costs additionally carry stress weights (protected cycleway 0.85,
19th Avenue and Van Ness 1.9) and respect one-way restrictions. These are
switched off for shortest, so that every distance-penalty and
elevation-saved figure is measured against a genuine shortest path.
Corridor detection
A street earns corridor status by being used, repeatedly, by good flat routes between different parts of the city, and by saving climbing when used. For each edge the analysis accumulates, over every ordered neighborhood pair and every climb-averse objective: the number of distinct pairs served, the number of distinct neighborhoods at either end (which separates a citywide corridor from a street busy between one pair of districts), and the climbing avoided versus the shortest path, apportioned by the edge's share of route length. Edges whose own gradient disqualifies them as flat are excluded regardless of usage, so the unavoidable climbs out of a corridor do not get absorbed into it. Contiguous high-scoring edges are then merged, short gaps are closed, and the result is labelled by its constituent street names.
Routing in the browser
Both pages ship the graph, not a set of answers. Earlier it carried ~10,000 precomputed routes, which meant it could only speak about the 36 neighborhood access points; embedding the graph itself turned out to be both smaller and far more useful.
The packing is in sf_flat_routes/webgraph.py:
69,864 nodes, 160,608 directed arcs, 87,776 edge geometries and the vector
overlays are quantised into typed arrays, concatenated into one buffer,
gzipped and base64-encoded once. The browser inflates it with
DecompressionStream and takes TypedArray views straight onto the result —
no JSON number parsing. 18.4 MB of raw arrays compress to 4.6 MB, so the
whole self-contained page is 6.5 MB and interactive in under four
seconds, against 19.3 MB for the precomputed version.
Routing is a Dijkstra over a CSR adjacency with a flat binary heap and a
visit-stamp array, so nothing is reallocated between searches. It settles a
cross-city route in about 9 ms (61 ms worst case observed), which is what
makes the weight sliders feel live. The cost function is a line-for-line
mirror of routing.edge_costs, including the per-class comfort multipliers
and the flag that disables them for the shortest objective.
The street network is painted directly onto a canvas from the packed arrays, with viewport culling and a zoom-dependent minimum edge length. 88,000 individual Leaflet polylines would not have been usable; one canvas pass is.
The route finder's slider is a family of routes: the whole frontier of distance against climbing between the two points, every route that no other route beats on both counts, sorted from shortest to flattest. The first version swept a weighted sum, length + α × climbing, over values of α. That finds only the frontier's convex hull: a route that is a good compromise but sits in a dent of the curve never wins for any α, and on some trips the dent holds most of the interesting routes (California & Kearny to the Marina jumped straight from the direct route over Russian Hill to the Embarcadero loop, with nothing in between). The frontier is now found by a bi-objective search, BOA* (bi-objective A* with lazy dominance checks, Hernández et al. 2020): labels carry (length, climbing), expand in order of bounded length, and a label is dropped on reaching a node with no less climbing than a label that got there earlier, which by the expansion order was also no longer. The bounds are exact reverse Dijkstras on each objective; the search is capped at the length of the flattest weighted route (α = 200, beyond which the router walks miles to save a few feet) and the climbing of the shortest, and frontier points within 0.5 m of climbing are merged. It takes 0.1–0.6 s in the browser for trips across the city, during which the shortest route is already shown; the slider then runs evenly over up to thirty routes spread along the frontier. Along a frontier sorted by distance, climbing can only fall, so sliding right never shortens the route and never adds climbing, which is what the end labels promise. A genuinely continuous morph between two street routes is not meaningful — a path halfway between Valencia and Church Street runs through buildings — so the continuity is in the trade-off, not the geometry.
Place search runs on an index packed into the page: intersections are
derived in the browser from the graph's own street names; parks, schools,
stations, piers, peaks and beaches come from Overture's base theme (mapped
OpenStreetMap outlines, which are reliable); landmarks, shops and cafes
come from Overture's places feed, which is not — the same name recurs at
several spots, some nowhere near the real thing — so a POI record is kept
only where neighbouring records corroborate it and is dropped when a
mapped feature already carries its name
(sf_flat_routes/places.py). Addresses are
230,000 (street, number) points in 10 bytes each.
Passes and barriers
"How much climbing is unavoidable between these two parts of the city?" is a minimax (bottleneck) path problem, not a shortest-path problem:
pass_height(s,t) = min over paths P from s to t of ( max elevation on P )
This has an exact solution. Sorting every edge by its crest and adding edges
to a union-find structure in increasing crest order builds a minimum
bottleneck spanning tree; the crest of the edge that first connects s to
t is pass_height(s,t), and the lowest common ancestor in the resulting
merge tree answers every pair from one construction. The result was checked
against the routing: the maximum elevation reached on the minimum-climbing
route is at or above the computed pass height for all 1,260 pairs, with
zero violations.
Barriers are the complementary view: steep edges carrying heavy shortest-path traffic. One that keeps its traffic under the climb-averse objectives has no alternative; one that loses it does.
Neighborhood access points
A polygon centroid can land in a park, on a cliff, in the water, or outside a concave neighborhood entirely. Instead, each neighborhood's representative point is the street-length-weighted centre of its network nodes — street length being a far better proxy for where journeys start than polygon area — snapped to the nearest qualifying intersection (degree ≥ 3, named street, of an ordinary urban class). The offset from the geometric centroid is recorded for audit: across both modes only two points exceed 400 m — Lakeshore at 453 m, because most of that neighborhood is Lake Merced, and the Presidio at 444 m for cycling, because its centroid sits in woodland off the rideable network.
Data sources
All URLs verified 2026-09-16 (the three search-only Overture themes on
2026-10-04). python -m sf_flat_routes sources prints the full table with
limitations.
| Dataset | Publisher | Resolution / vintage | Licence | Role |
|---|---|---|---|---|
Overture Maps transportation segments & connectors, release 2026-08-19.0 | Overture Maps Foundation (derived from OpenStreetMap) | Vector; OSM-equivalent accuracy (~1–5 m) | ODbL 1.0; schema CDLA-Permissive 2.0 | Routable street network: geometry, class, per-mode access, bridge/tunnel flags, topology |
USGS 3DEP 1 m bare-earth DEM, project CA_SanFrancisco_B23 | USGS 3D Elevation Program | 1 m GSD, EPSG:26910, metres above NAVD88 | Public domain | Primary elevation source |
USGS 3DEP 1/3 arc-second DEM, tile n38w123 | USGS 3D Elevation Program | ~10 m, EPSG:4269 | Public domain | Independent cross-check only |
| San Francisco neighborhoods (37-unit planning set) | SF Planning / DataSF, mirrored by Code for America | 37 polygons | Open data | Neighborhood boundaries |
| Bicycle facilities / low-stress streets | Derived from Overture/OSM attributes | Vector | ODbL 1.0 | Bicycle overlay (see limitations) |
Overture Maps base theme (land use, infrastructure, land), release 2026-08-19.0 | Overture Maps Foundation (derived from OpenStreetMap) | Mapped outlines and points | ODbL 1.0 | Route finder search only: parks, schools, stations, piers, peaks, beaches |
Overture Maps places, release 2026-08-19.0 | Overture Maps Foundation (Meta / Microsoft POI data) | Points with names, categories, confidence | CDLA-Permissive 2.0 | Route finder search only: landmarks, shops, cafes (noisy; see places.py) |
Overture Maps addresses, release 2026-08-19.0 | Overture Maps Foundation (OpenAddresses / City of San Francisco) | Address points | Open (public domain source) | Route finder search only: street addresses |
Two substitutions, and why
data.sfgov.org and sfgov.org are blocked by the build environment's
network egress policy, so two datasets could not be fetched from their
authoritative source:
- Neighborhood boundaries. The official 41-unit Analysis Neighborhoods
product could not be downloaded. This project uses the long-standing
37-unit San Francisco planning neighborhood set via the Code for America
click_that_hoodmirror — a real, widely used SF boundary set whose union is 122.0 km² against the city's ~121 km² land area. The two products differ mainly in how the Sunset, Richmond and Twin Peaks areas are subdivided, which affects representative-point placement but not the street model. The mirror does not state its boundary vintage. - SFMTA bikeway network and Slow Streets. Not retrievable. The bicycle
and low-stress layers are instead derived from Overture/OSM attributes
(
class=cycleway,living_street,pedestrian, bicycle-designated paths). OSM bicycle tagging in San Francisco is largely conflated with SFMTA data by local mappers, so this is a good proxy — but it is not authoritative, and it carries no SFMTA facility class (I/II/III/IV) and no official Slow Streets designation.
Both substitutions are recorded in the dataset registry and flagged
[SUBSTITUTED] by python -m sf_flat_routes sources.
Installation
Python 3.10+.
git clone https://github.com/almostimplemented/flattensf && cd flattensf
python -m venv .venv && source .venv/bin/activate
pip install -r requirements.txt        # or: pip install -e ".[dev]"
The geospatial stack (GeoPandas, rasterio, pyproj, shapely, scipy, networkx, pyarrow) installs from wheels; no system GDAL is required.
Reproducing the analysis
python -m sf_flat_routes all # everything, in order
Or stage by stage — each caches its output, so re-running is cheap:
python -m sf_flat_routes sources        # dataset provenance table
python -m sf_flat_routes download       # fetch and cache source data (~750 MB)
python -m sf_flat_routes build-network  # street graph, elevation, edge metrics
python -m sf_flat_routes analyze        # pairs, Pareto, corridors, passes
python -m sf_flat_routes validate       # checks against known ground truth
python -m sf_flat_routes map            # interactive + static maps, and site/
python -m sf_flat_routes report         # written analysis
Deploying the route finder
site/ is committed already built, because building it needs the cached
lidar and Overture data that CI does not have. The workflow in
.github/workflows/pages.yml publishes that
directory to GitHub Pages on every push that touches it. One-time setup in
the repository: Settings → Pages → Source: GitHub Actions, then under
Custom domain enter www.flattensf.com and tick "Enforce HTTPS" once the
certificate is issued. At the registrar, add a CNAME from www to
almostimplemented.github.io, and point the apex at GitHub Pages too
(A records 185.199.108.153, 185.199.109.153, 185.199.110.153,
185.199.111.153) so that flattensf.com redirects to www. Any other
static host works the same way: upload site/ and nothing else. The host
and the page URL used for the canonical link and the social-preview tags
are SITE_DOMAIN and SITE_URL in config.py;
the preview card itself is site/preview.jpg, a 1200×630 JPEG regenerated
by the screenshot step after every build.
Add --force to recompute a stage instead of using its cache. Ad-hoc
routing:
python -m sf_flat_routes route --from Mission --to "Outer Sunset"
python -m sf_flat_routes route --from "Inner Richmond" --to Downtown/Civic\ Center --mode bike
Mission  ->  Outer Sunset   [walk]
objective        miles  climb ft  loss ft  max %   >5% m   >8% m            vs shortest
shortest          5.10      1130      955   59.9    2677    1303
min_climb         6.22       333      158    9.2     211       1   +22% dist,   +797 ft climb
grade_averse      6.38       349      174    7.0       3       0   +25% dist,   +781 ft climb
balanced          6.20       345      170    7.0      29       0   +21% dist,   +785 ft climb
A full clean run takes about 4.5 minutes on 4 cores and completes with no warnings at all: ~55 s to download and cache 725 MB of source data, ~1 m 40 s to build the street graph and sample 1.6 M elevation points, ~30 s for the routing analysis (10,080 routes), ~15 s to validate, and ~1 m 15 s to render the maps. Re-running any stage from cache is near-instant.
Tests
python -m pytest tests/ -q # 109 tests
Covering grade computation, cumulative elevation gain (dead-band behaviour, additivity, exact directional symmetry), directional edge costs, the routing cost model, access-rule interpretation, the minimax pass algorithm, corridor scoring, payload quantisation and bundling, and hillshade/geometry helpers — plus integration tests that assert the model's invariants against the real processed data.
tests/test_webmap.py goes further and drives the built map in headless
Chromium, handing the JavaScript router the exact arc sequences Python chose.
It asserts that the browser's metrics match Python's on an identical path,
and that the route the browser finds for itself is never more expensive under
its own cost model. It skips itself unless Playwright, a Chromium build and a
built map are all present:
pip install -e ".[dev]" && playwright install chromium
python -m sf_flat_routes map && python -m pytest tests/test_webmap.py -q
Project structure
sf_flat_routes/
  config.py           all tunable parameters: CRS, weights, thresholds, modes
  sources.py          dataset registry: URLs, dates, licences, limitations
  download.py         cached acquisition; Parquet row-group bbox pruning
  network.py          street graph from Overture segments + connectors
  elevation.py        DEM mosaic, sampling, smoothing, structure handling
  metrics.py          per-directed-edge metrics: grades, gain, steep distance
  routing.py          cost model and scipy-backed shortest paths
  neighborhoods.py    boundaries and representative access points
  pairs.py            neighborhood-pair matrix and Pareto frontiers
  corridors.py        corridor importance scoring and merging
  passes.py           minimax passes, lowland basins, barriers
  validate.py         checks against known ground truth
  viz_static.py       publication maps (matplotlib + lidar hillshade)
  webgraph.py         packs the graph into a compressed browser payload
  places.py           offline place index for the route finder, and the
                      hillshade base image
  viz_interactive.py  assembles the two self-contained web pages
  web/                their HTML, CSS and JavaScript: the shared router
                      (engine.js), the route finder (simple.js), the
                      explorer (app.js) and the warped city (warp.js)
site/                 flattensf.com as a static site (built; deployed
                      to GitHub Pages by .github/workflows/pages.yml)
  sensitivity.py      rebuilds the pipeline under perturbed parameters
  report.py           generates outputs/findings.md from the outputs
  pipeline.py         stage orchestration
  __main__.py         CLI
  vendor/             Leaflet 1.9.4 (BSD-2-Clause), inlined into the map
notebooks/            exploration only; the analysis runs from the CLI
tests/                139 tests
data/raw/             cached source data (never modified)
data/processed/       cached intermediate products
outputs/              deliverables
Raw data is never written to; every expensive product is cached and
recomputed only with --force. Output is byte-reproducible: rebuilding the
maps and reports from the same cached data produces identical files, so the
repository does not churn on every run.
Limitations
Beyond the two dataset substitutions above:
- Elevation is the ground, not the road surface. Bridges and tunnels are interpolated; a handful of piers over water are solved from neighbours.
- Travel is on street centrelines. Pedestrian distances are block-scale, not door-to-door, and sidewalk-level detail is deliberately unused.
- Maximum gradient on short edges is unreliable. Over a 5 m stub a single decimetre of artefact reads as 20%; the worst real case found was a 5 m connector at Market and 5th reporting 41%. Edges under 15 m are flagged and excluded from maximum-gradient tests, which fall back to average gradient. 41,330 of 87,776 edges are long enough to carry a reliable maximum.
- One access point per neighborhood. Large or awkward neighborhoods (Bayview, Lakeshore, the Presidio) are served worse than compact ones.
- No traffic, signals, surface quality or safety. The bicycle stress weights are a proxy for road class, not a level-of-traffic-stress model.
- Gradients are attenuated at the extremes. Published "steepest street" figures are measured over the single steepest pitch, sometimes only 15–20 m long, and the smoothing chain costs roughly eight percentage points there. Bradford Street shows the whole chain: 41.4% sampled raw at 5 m against a published 41%, 36.8% raw at 10 m, 36.9% with the 50 m window applied within the edge, and 33.1% as the pipeline computes it (smoothed across whole segments and reconciled at intersections). The trade is deliberate: with less smoothing, lidar artefacts pushed 22nd Street and Baden Street to the 60% plausibility ceiling. For a project about flat routes, clipping the peak of a 41% wall is a much cheaper error than inventing gradient on flat ground.
- The place search is only as good as its sources. Intersections and
addresses are solid; Overture's places feed puts some well-known names in
the wrong place, and the corroboration rules in
places.pyremove the worst of it rather than all of it. Check the pin. - The web pages quantise the graph to keep the file small:
lengths and steep distances to 5 cm, climbing to 1 cm, gradients to 0.01%.
Route totals therefore drift from the Python figures by a few tens of
centimetres over a long route, and where two routes tie on cost the browser
may pick the other one.
tests/test_webmap.pyasserts both that the browser's metrics match Python's on an identical path and that its own route is never more expensive. - Treasure Island / Yerba Buena Island are excluded from pair routing: they are part of San Francisco but have no pedestrian access across the western span of the Bay Bridge.
Licence and attribution
Analysis code in this repository is available under the MIT licence. The data
it consumes is not: street geometry is © OpenStreetMap contributors,
ODbL 1.0 (via Overture Maps), and any redistribution of derived street
geometry — including outputs/flat_corridors.geojson,
data/processed/edges_*.parquet and the interactive map — carries ODbL
share-alike obligations. USGS 3DEP elevation is public domain. Leaflet is
bundled under BSD-2-Clause; see
sf_flat_routes/vendor/README.md.
Similar repos





See what people are saying
README
flattensf
flattensf.com: the flattest route between any two places in San Francisco, and every route between it and the shortest.
Behind it, an analysis of the city's hidden network of relatively flat streets: the routes that connect San Francisco's neighborhoods while climbing as little as possible.
San Francisco is famously hilly, but it is hilly in a structured way. Its hills are separated by valleys, saddles and old dune flats, and those low places join up into a network that is far more continuous than the city's reputation suggests. This project models that network from authoritative elevation and street data, routes across it under several competing definitions of "flat", and then works out which streets the city's geography forces low-gradient traffic onto.
The central result: about 14% more walking buys about 39% less climbing. Averaged over all 1,260 ordered neighborhood pairs, the minimum-climbing pedestrian route is only 14% longer than the shortest one, yet avoids 39% of the ascent and drops the typical steepest pitch from 27% to 17%.
The full write-up is in outputs/findings.md, and
the checks against known ground truth are in
outputs/validation_report.md.
The route finder
Live: flattensf.com
Type where you are and where you are going, then drag the slider from shortest to flattest and watch the route change. Every position is a real route, solved in your browser over the full street graph with the same cost model the analysis uses; the slider scales how much a foot of climbing costs relative to a foot of walking, from nothing to enough that the route avoids every avoidable hill. The numbers and the elevation profile follow along, and the faint lines are the other members of the family, so you can see where the routes agree and where they part.
Place search is offline: street intersections ("24th & Mission"), addresses ("1234 Valencia") and about 10,000 parks, landmarks, stations, schools, shops and cafes are built into the page from the street graph and Overture's places, addresses and base themes. No geocoding API, so no key to leak and nothing to pay for. You can also click the map, or drag either pin. "Copy link" gives a URL that reopens the exact trip.
The site is static: site/ holds the page, its CSS and JS, the
whole street graph as one 4.8 MB gzipped file and the hillshade as a PNG,
and GitHub Pages serves it as is. Loading it cold takes a couple of seconds
on a decent connection; after that every route is solved locally. The same
page is also written as one self-contained 6.8 MB file,
outputs/sf_flat_route_finder.html,
which opens straight from disk.
The explorer
outputs/sf_flat_routes_map.html is the
working view of the analysis: the network coloured by gradient, the
discovered corridors, passes, barriers and basins as toggleable layers, the
four objectives with live α/β/γ sliders, a Pareto readout, and the warped
city below. It is dense by design.
Here it is showing the flattest walking route from the Bayview to Golden Gate Park: 7.67 miles and 353 ft of climbing, against 7.01 miles and 1,076 ft for the shortest one. The red arcs are the streets steeper than 10% — they trace the city's hills like contours — and the thick pale blue lines are the flat corridors the analysis discovered. The route threads between them.
The warped city
The map can also redraw the city so that distance on the page means climbing cost rather than geography. Places separated by a ridge move apart; places joined by a flat corridor pull together. Twin Peaks drifts almost 5 km from where it sits, West of Twin Peaks 3 km, Glen Park 2 km, while Bernal Heights and Nob Hill barely move: they are hilly, but they are hilly next to the flats.
The deformation is driven by the same cost model as the routes, with one knob: how many metres of walking a metre of climb is worth. At λ = 0 the page shows plain network distance (even then the Bay and the park bend things), λ = 1 is the balanced objective, and higher values make the hills loom larger; keeping it modest is what stops the routes becoming absurd. A morph slider runs the real city into the warped one.
Method: about 175 anchor intersections (every neighborhood's access point plus a 1 km lattice snapped to routable nodes) get a full cost matrix from the in-page router; stress majorisation (SMACOF, unit weights) lays them out so page distance matches cost, starting from their true positions so the result is the least deformation that fits; a Procrustes fit turns and scales the layout back onto geography so north stays up; and a thin-plate spline through the anchors' displacements carries every street vertex, neighborhood outline, corridor and route along with it. The whole thing takes about three seconds in the browser, so the weight can be changed live.
This was prompted by a friend's piece that redraws cities by travel time; the idea of warping a city by a non-geographic metric is theirs, the metric and the construction here are different.
What it produces
| Output | What it is |
|---|---|
outputs/sf_flat_route_finder.html | The route finder: origin, destination, walk or bike, and a slider from the shortest route to the flattest, with offline place search. Self-contained — Leaflet, the whole 160,000-arc graph, the place index and a lidar hillshade are embedded. This is the page to share. |
site/ | The route finder as a static site (the same page with the graph and hillshade as separate cacheable files), deployed to GitHub Pages by .github/workflows/pages.yml. |
outputs/sf_flat_routes_map.html | The explorer: every analysis layer, the four objectives with live α/β/γ sliders, Pareto readout and the warped city. Routes in the browser over the same graph. |
outputs/sf_flat_backbone.png / .pdf | Publication-quality static map of the low-elevation backbone, over a hillshade computed from the same lidar the analysis uses. |
outputs/sf_street_grades.png | Citywide street-gradient map. |
outputs/screenshot_route_finder.png, screenshot_interactive.png | Screenshots of the two pages, for anywhere the HTML cannot be rendered. |
outputs/screenshot_warped.png | Screenshot of the city warped by climbing cost. |
outputs/findings.md | Written analysis of the major findings. Every figure is generated from the outputs, not typed in. |
outputs/validation_report.md | Validation against an independent DEM, documented street gradients and known flat corridors. |
outputs/flat_corridors.geojson / .gpkg / .csv | The discovered low-elevation corridors: street names, endpoints in lon/lat, neighborhoods connected, length, elevation range, gradient and importance metrics. |
outputs/neighborhood_pairs.csv | 10,080 routes: every ordered neighborhood pair × 4 objectives × 2 modes, with full metrics. |
outputs/pareto_frontier.csv | Distance / climbing / peak-gradient trade-off frontiers for every ordered pair. |
outputs/sensitivity.md / .csv | Every finding recomputed under ten perturbations of the elevation parameters and access points. |
outputs/passes.geojson / .csv, outputs/pass_matrix.csv | Critical passes, and the lowest possible crossing elevation for every neighborhood pair. |
outputs/barriers.geojson / .csv | Steep streets that inter-neighborhood traffic cannot avoid. |
outputs/lowland_basins.geojson | The city's flat districts, delineated below 15 m. |
data/processed/sf_street_network.gpkg | Processed street network as a GeoPackage, ready to open in QGIS or ArcGIS: 87,776 edges with gradient, climbing and access attributes. |
data/processed/edges_metrics.parquet, edges_directed.parquet | The same network as Parquet, plus the full per-direction metric table (175,552 directed edges). |
Headline findings
- Two spines carry the city. The Mission valley floor (Valencia–Guerrero– Market–16th, 6.9 km at 1.3% mean gradient) runs north–south; the Wiggle–Panhandle–Golden Gate Park chain (7.6 km) runs east–west. The analysis was not told either existed.
- The Wiggle emerges unprompted. Asked for a flat bicycle route from Market at Duboce to Haight at Masonic, the model returns the Wiggle. Both routes must gain the same unavoidable 47 m; the shortest one throws away a further 19.2 m of climbing getting there, the Wiggle only 5.9 m — for 0.4% more distance.
- One pass dominates the city. An unnamed path in Golden Gate Park at ~255 ft is the binding constraint for 119 of 630 neighborhood pairs — the lowest point on the ridge dividing the eastern flats from the ocean side. Crossing San Francisco east–west costs that 255 ft whatever you do.
- Twin Peaks has no cheap way over it. The lowest crossings into West of Twin Peaks and Diamond Heights are Lansdale Avenue (696 ft) and Panorama Drive (635 ft). These neighborhoods are the ones the flat network cannot reach.
- Total climbing and peak steepness are different objectives. The grade-averse route climbs more in total than the flattest route (325 ft vs 281 ft) while holding the steepest pitch to 10.8% instead of 17.2%. No single definition of "flat" serves both.
Methodology
Elevation
Elevation accuracy drives everything else, so the method is deliberate.
- Source. USGS 3DEP 1 m bare-earth lidar, project
CA_SanFrancisco_B23— four cloud-optimised GeoTIFF tiles in EPSG:26910 (NAD83 / UTM 10N), which is also the CRS used for every length and slope computation. No raster reprojection is ever performed. - Noise suppression, spatially. A Gaussian filter of σ = 3 m is applied to the DEM before sampling. Bare-earth lidar still contains decimetre-scale artefacts from curbs, parked vehicles, vegetation misclassification and interpolation over occlusions. σ = 3 m is far narrower than a San Francisco street (15–25 m kerb to kerb) and far narrower than the ~100 m block scale on which real street gradient varies.
- Sampling at 5 m. Chosen empirically. At 10 m spacing the short steep pitches that give the city its reputation were measurably clipped — Bradford Street read 36.8% against a documented 41%, Prentiss Street 32.9% against 37% — while sampling at 5 m returns 41.4% and 36.9% respectively before smoothing.
- Structures. Where an edge is flagged
is_bridgeoris_tunnelthe DEM describes the ground or water under the deck. Such edges get a linear ramp between their endpoints; endpoints that are themselves unreliable (mid-viaduct nodes) are recovered by solving a discrete Laplace problem over the structure sub-graph with the reliable nodes as boundary conditions — the deck is modelled as the smoothest ramp consistent with where it meets the ground. - Smoothing per street segment, not per edge. A Savitzky–Golay filter (order 2, ~50 m window) is applied to the concatenated profile of each contiguous run of a street segment. Smoothing edges in isolation gave the two edges either side of an intersection different elevations for the same corner, and in San Francisco that happens every 80 m.
- One elevation per intersection. Each node is reconciled to a single elevation and every profile is rubber-sheeted onto it with a linear correction (0.02 m on average). This makes per-edge climbing sum exactly to the difference between a route's endpoints.
- Dead-band on cumulative gain. Cumulative gain and loss are computed after pruning every elevation reversal smaller than 0.5 m. Pruning replaces a run by its monotone envelope clamped to the run's endpoints, so an oscillation below the dead-band contributes no gain at all, while a genuine sustained climb is preserved to the millimetre and the shape within the run is preserved — which is what makes per-edge figures additive along a route.
The last two points matter more than they sound. Two earlier implementations were measurably wrong and are kept as regression tests: a backlash-operator dead-band charged one dead-band per edge and lost 17 m of real climbing on a route over Twin Peaks, and a linear-interpolation rectifier redistributed climbing within a segment with errors reaching 51 m.
Validation (full report in
outputs/validation_report.md):
- Against the independent USGS 1/3 arc-second DEM at 4,000 random points: mean difference −0.02 m, RMS 0.68 m, 98.5% within 2 m.
- Against documented street gradients: 6 of 8 within 5 percentage points
(Filbert 32.9% vs 31.5%, 22nd Street 32.6% vs 31.5%, Jones 31.1% vs 29.0%,
Prentiss 32.9% vs 37%, Baden 34.5% vs 32%, Duboce 28.8% vs 27.5%). Of the
two that miss, Nevada Street is a classification issue — its published
35% pitch is tagged
stepsin OpenStreetMap and measures 34.6% as a stairway — and Bradford Street is smoothing attenuation, discussed under Limitations. The model was not changed to fit either. - The Embarcadero and the Great Highway, the city's two genuinely level corridors, come out at 1.07 and 1.16 m of climbing per km. Jones Street comes out at 39.5 m/km — a 37-fold separation.
- Internal invariants asserted in the test suite: per-edge
gain − loss == net_changeholds to 0.0 for all 175,552 directed edges, and no node has an inconsistent elevation.
Sensitivity (python -m sf_flat_routes sensitivity; tables in
outputs/sensitivity.md). The whole pipeline was
rebuilt under ten one-at-a-time changes to the elevation parameters (sample
spacing 2.5/10 m, smoothing window 12.5/50 m, dead-band 0.25/1 m, spatial
pre-filter 0/6 m) and to which intersection stands in for each neighborhood
(second- and third-nearest). The headline moves from +14% / 39% to at most
+15% / 40%; the dominant pass is the same Golden Gate Park crossing at 255 ft
in all eleven runs; the Wiggle wins in all eleven. The corridors are the least
rigid part: the street that qualifies as corridor material is 71–99% the same
by length, and 8–12 of the top twelve lead streets keep their place, but
where each corridor is cut, and so what it is called, shifts — most under the
smoothing window — and a handful of borderline streets (Market, Divisadero,
24th, Greenwich among them) drift in and out of the top twelve. They should be
read as a tier, not a ranking.
Street network
Overture Maps' transportation theme (OpenStreetMap-derived, ODbL). Topology comes from Overture connectors: every segment lists the connector IDs it touches with the fractional position along its own geometry, so splitting at those positions and keying nodes by connector ID gives exact topology with no snapping tolerance, and grade-separated crossings correctly stay unconnected.
Reading it is cheap despite the theme being ~64 GB: Parquet row-group
statistics on the bbox column mean only 7 of 16,384 global row groups
intersect San Francisco, so the extract takes seconds and ~10 MB.
Access is derived from Overture access_restrictions, whose rule shapes in
San Francisco are denied + heading=backward (one-way, 7,034 segments),
per-mode denied/allowed/designated, and as_private /
at_destination conditional access. One-way is enforced for bicycles and
ignored for pedestrians, since OSM oneway describes vehicle movement;
contraflow bicycle lanes are honoured.
Two classification facts shaped the mode filters, both verified against the data rather than assumed:
trunkincludes Van Ness Avenue, 19th Avenue, Lombard Street and part of Mission Street — ordinary surface streets with sidewalks.trunktherefore cannot be excluded from walking or cycling.motorwayis true grade-separated freeway and is excluded.steps(2,652 edges, 35 km) is a real part of the pedestrian network and is excluded outright for bicycles. A route suitable for a pedestrian is emphatically not necessarily rideable.sidewalkandcrosswalksubclasses are excluded for both modes: travel is modelled along street centrelines, because including the sidewalk network would represent every street two or three times and wreck corridor aggregation.
Routing model
Edge cost, in "equivalent metres" — the distance a traveller would consider as bad as this edge:
cost = length × mode_multiplier(class)
     + α × cumulative_gain
     + β × Σₖ penaltyₖ × distance_above_thresholdₖ
     + γ × extreme_extra × distance_above_highest_threshold
The threshold terms are cumulative: 100 m at 12% incurs the 3%, 5%, 8%
and 10% penalties simultaneously, so the marginal cost of steepness rises
super-linearly rather than staying flat. α is the substitution rate between
climbing and distance — Naismith's rule for walking implies about 8 m of flat
walking per metre climbed.
Only cumulative_gain ever enters the cost, never net elevation change. A
route that climbs 120 m and descends 120 m has zero net change and is not
flat; that is the analytical point of the project, and it is asserted in the
test suite.
Four objectives, all configured in sf_flat_routes/config.py:
| Objective | α | β | γ | Intent |
|---|---|---|---|---|
shortest | 0 | 0 | 0 | distance only (comfort multipliers off, so it is a true baseline) |
min_climb | 120 | 0 | 0 | near-lexicographic preference for avoiding ascent |
grade_averse | 4 | 12 | 6 | steep segments dominate; total ascent secondary |
balanced | 14 | 2 | 2 | flat but without absurd detours |
Bicycle costs additionally carry stress weights (protected cycleway 0.85,
19th Avenue and Van Ness 1.9) and respect one-way restrictions. These are
switched off for shortest, so that every distance-penalty and
elevation-saved figure is measured against a genuine shortest path.
Corridor detection
A street earns corridor status by being used, repeatedly, by good flat routes between different parts of the city, and by saving climbing when used. For each edge the analysis accumulates, over every ordered neighborhood pair and every climb-averse objective: the number of distinct pairs served, the number of distinct neighborhoods at either end (which separates a citywide corridor from a street busy between one pair of districts), and the climbing avoided versus the shortest path, apportioned by the edge's share of route length. Edges whose own gradient disqualifies them as flat are excluded regardless of usage, so the unavoidable climbs out of a corridor do not get absorbed into it. Contiguous high-scoring edges are then merged, short gaps are closed, and the result is labelled by its constituent street names.
Routing in the browser
Both pages ship the graph, not a set of answers. Earlier it carried ~10,000 precomputed routes, which meant it could only speak about the 36 neighborhood access points; embedding the graph itself turned out to be both smaller and far more useful.
The packing is in sf_flat_routes/webgraph.py:
69,864 nodes, 160,608 directed arcs, 87,776 edge geometries and the vector
overlays are quantised into typed arrays, concatenated into one buffer,
gzipped and base64-encoded once. The browser inflates it with
DecompressionStream and takes TypedArray views straight onto the result —
no JSON number parsing. 18.4 MB of raw arrays compress to 4.6 MB, so the
whole self-contained page is 6.5 MB and interactive in under four
seconds, against 19.3 MB for the precomputed version.
Routing is a Dijkstra over a CSR adjacency with a flat binary heap and a
visit-stamp array, so nothing is reallocated between searches. It settles a
cross-city route in about 9 ms (61 ms worst case observed), which is what
makes the weight sliders feel live. The cost function is a line-for-line
mirror of routing.edge_costs, including the per-class comfort multipliers
and the flag that disables them for the shortest objective.
The street network is painted directly onto a canvas from the packed arrays, with viewport culling and a zoom-dependent minimum edge length. 88,000 individual Leaflet polylines would not have been usable; one canvas pass is.
The route finder's slider is a family of routes: the whole frontier of distance against climbing between the two points, every route that no other route beats on both counts, sorted from shortest to flattest. The first version swept a weighted sum, length + α × climbing, over values of α. That finds only the frontier's convex hull: a route that is a good compromise but sits in a dent of the curve never wins for any α, and on some trips the dent holds most of the interesting routes (California & Kearny to the Marina jumped straight from the direct route over Russian Hill to the Embarcadero loop, with nothing in between). The frontier is now found by a bi-objective search, BOA* (bi-objective A* with lazy dominance checks, Hernández et al. 2020): labels carry (length, climbing), expand in order of bounded length, and a label is dropped on reaching a node with no less climbing than a label that got there earlier, which by the expansion order was also no longer. The bounds are exact reverse Dijkstras on each objective; the search is capped at the length of the flattest weighted route (α = 200, beyond which the router walks miles to save a few feet) and the climbing of the shortest, and frontier points within 0.5 m of climbing are merged. It takes 0.1–0.6 s in the browser for trips across the city, during which the shortest route is already shown; the slider then runs evenly over up to thirty routes spread along the frontier. Along a frontier sorted by distance, climbing can only fall, so sliding right never shortens the route and never adds climbing, which is what the end labels promise. A genuinely continuous morph between two street routes is not meaningful — a path halfway between Valencia and Church Street runs through buildings — so the continuity is in the trade-off, not the geometry.
Place search runs on an index packed into the page: intersections are
derived in the browser from the graph's own street names; parks, schools,
stations, piers, peaks and beaches come from Overture's base theme (mapped
OpenStreetMap outlines, which are reliable); landmarks, shops and cafes
come from Overture's places feed, which is not — the same name recurs at
several spots, some nowhere near the real thing — so a POI record is kept
only where neighbouring records corroborate it and is dropped when a
mapped feature already carries its name
(sf_flat_routes/places.py). Addresses are
230,000 (street, number) points in 10 bytes each.
Passes and barriers
"How much climbing is unavoidable between these two parts of the city?" is a minimax (bottleneck) path problem, not a shortest-path problem:
pass_height(s,t) = min over paths P from s to t of ( max elevation on P )
This has an exact solution. Sorting every edge by its crest and adding edges
to a union-find structure in increasing crest order builds a minimum
bottleneck spanning tree; the crest of the edge that first connects s to
t is pass_height(s,t), and the lowest common ancestor in the resulting
merge tree answers every pair from one construction. The result was checked
against the routing: the maximum elevation reached on the minimum-climbing
route is at or above the computed pass height for all 1,260 pairs, with
zero violations.
Barriers are the complementary view: steep edges carrying heavy shortest-path traffic. One that keeps its traffic under the climb-averse objectives has no alternative; one that loses it does.
Neighborhood access points
A polygon centroid can land in a park, on a cliff, in the water, or outside a concave neighborhood entirely. Instead, each neighborhood's representative point is the street-length-weighted centre of its network nodes — street length being a far better proxy for where journeys start than polygon area — snapped to the nearest qualifying intersection (degree ≥ 3, named street, of an ordinary urban class). The offset from the geometric centroid is recorded for audit: across both modes only two points exceed 400 m — Lakeshore at 453 m, because most of that neighborhood is Lake Merced, and the Presidio at 444 m for cycling, because its centroid sits in woodland off the rideable network.
Data sources
All URLs verified 2026-09-16 (the three search-only Overture themes on
2026-10-04). python -m sf_flat_routes sources prints the full table with
limitations.
| Dataset | Publisher | Resolution / vintage | Licence | Role |
|---|---|---|---|---|
Overture Maps transportation segments & connectors, release 2026-08-19.0 | Overture Maps Foundation (derived from OpenStreetMap) | Vector; OSM-equivalent accuracy (~1–5 m) | ODbL 1.0; schema CDLA-Permissive 2.0 | Routable street network: geometry, class, per-mode access, bridge/tunnel flags, topology |
USGS 3DEP 1 m bare-earth DEM, project CA_SanFrancisco_B23 | USGS 3D Elevation Program | 1 m GSD, EPSG:26910, metres above NAVD88 | Public domain | Primary elevation source |
USGS 3DEP 1/3 arc-second DEM, tile n38w123 | USGS 3D Elevation Program | ~10 m, EPSG:4269 | Public domain | Independent cross-check only |
| San Francisco neighborhoods (37-unit planning set) | SF Planning / DataSF, mirrored by Code for America | 37 polygons | Open data | Neighborhood boundaries |
| Bicycle facilities / low-stress streets | Derived from Overture/OSM attributes | Vector | ODbL 1.0 | Bicycle overlay (see limitations) |
Overture Maps base theme (land use, infrastructure, land), release 2026-08-19.0 | Overture Maps Foundation (derived from OpenStreetMap) | Mapped outlines and points | ODbL 1.0 | Route finder search only: parks, schools, stations, piers, peaks, beaches |
Overture Maps places, release 2026-08-19.0 | Overture Maps Foundation (Meta / Microsoft POI data) | Points with names, categories, confidence | CDLA-Permissive 2.0 | Route finder search only: landmarks, shops, cafes (noisy; see places.py) |
Overture Maps addresses, release 2026-08-19.0 | Overture Maps Foundation (OpenAddresses / City of San Francisco) | Address points | Open (public domain source) | Route finder search only: street addresses |
Two substitutions, and why
data.sfgov.org and sfgov.org are blocked by the build environment's
network egress policy, so two datasets could not be fetched from their
authoritative source:
- Neighborhood boundaries. The official 41-unit Analysis Neighborhoods
product could not be downloaded. This project uses the long-standing
37-unit San Francisco planning neighborhood set via the Code for America
click_that_hoodmirror — a real, widely used SF boundary set whose union is 122.0 km² against the city's ~121 km² land area. The two products differ mainly in how the Sunset, Richmond and Twin Peaks areas are subdivided, which affects representative-point placement but not the street model. The mirror does not state its boundary vintage. - SFMTA bikeway network and Slow Streets. Not retrievable. The bicycle
and low-stress layers are instead derived from Overture/OSM attributes
(
class=cycleway,living_street,pedestrian, bicycle-designated paths). OSM bicycle tagging in San Francisco is largely conflated with SFMTA data by local mappers, so this is a good proxy — but it is not authoritative, and it carries no SFMTA facility class (I/II/III/IV) and no official Slow Streets designation.
Both substitutions are recorded in the dataset registry and flagged
[SUBSTITUTED] by python -m sf_flat_routes sources.
Installation
Python 3.10+.
git clone https://github.com/almostimplemented/flattensf && cd flattensf
python -m venv .venv && source .venv/bin/activate
pip install -r requirements.txt        # or: pip install -e ".[dev]"
The geospatial stack (GeoPandas, rasterio, pyproj, shapely, scipy, networkx, pyarrow) installs from wheels; no system GDAL is required.
Reproducing the analysis
python -m sf_flat_routes all # everything, in order
Or stage by stage — each caches its output, so re-running is cheap:
python -m sf_flat_routes sources        # dataset provenance table
python -m sf_flat_routes download       # fetch and cache source data (~750 MB)
python -m sf_flat_routes build-network  # street graph, elevation, edge metrics
python -m sf_flat_routes analyze        # pairs, Pareto, corridors, passes
python -m sf_flat_routes validate       # checks against known ground truth
python -m sf_flat_routes map            # interactive + static maps, and site/
python -m sf_flat_routes report         # written analysis
Deploying the route finder
site/ is committed already built, because building it needs the cached
lidar and Overture data that CI does not have. The workflow in
.github/workflows/pages.yml publishes that
directory to GitHub Pages on every push that touches it. One-time setup in
the repository: Settings → Pages → Source: GitHub Actions, then under
Custom domain enter www.flattensf.com and tick "Enforce HTTPS" once the
certificate is issued. At the registrar, add a CNAME from www to
almostimplemented.github.io, and point the apex at GitHub Pages too
(A records 185.199.108.153, 185.199.109.153, 185.199.110.153,
185.199.111.153) so that flattensf.com redirects to www. Any other
static host works the same way: upload site/ and nothing else. The host
and the page URL used for the canonical link and the social-preview tags
are SITE_DOMAIN and SITE_URL in config.py;
the preview card itself is site/preview.jpg, a 1200×630 JPEG regenerated
by the screenshot step after every build.
Add --force to recompute a stage instead of using its cache. Ad-hoc
routing:
python -m sf_flat_routes route --from Mission --to "Outer Sunset"
python -m sf_flat_routes route --from "Inner Richmond" --to Downtown/Civic\ Center --mode bike
Mission  ->  Outer Sunset   [walk]
objective        miles  climb ft  loss ft  max %   >5% m   >8% m            vs shortest
shortest          5.10      1130      955   59.9    2677    1303
min_climb         6.22       333      158    9.2     211       1   +22% dist,   +797 ft climb
grade_averse      6.38       349      174    7.0       3       0   +25% dist,   +781 ft climb
balanced          6.20       345      170    7.0      29       0   +21% dist,   +785 ft climb
A full clean run takes about 4.5 minutes on 4 cores and completes with no warnings at all: ~55 s to download and cache 725 MB of source data, ~1 m 40 s to build the street graph and sample 1.6 M elevation points, ~30 s for the routing analysis (10,080 routes), ~15 s to validate, and ~1 m 15 s to render the maps. Re-running any stage from cache is near-instant.
Tests
python -m pytest tests/ -q # 109 tests
Covering grade computation, cumulative elevation gain (dead-band behaviour, additivity, exact directional symmetry), directional edge costs, the routing cost model, access-rule interpretation, the minimax pass algorithm, corridor scoring, payload quantisation and bundling, and hillshade/geometry helpers — plus integration tests that assert the model's invariants against the real processed data.
tests/test_webmap.py goes further and drives the built map in headless
Chromium, handing the JavaScript router the exact arc sequences Python chose.
It asserts that the browser's metrics match Python's on an identical path,
and that the route the browser finds for itself is never more expensive under
its own cost model. It skips itself unless Playwright, a Chromium build and a
built map are all present:
pip install -e ".[dev]" && playwright install chromium
python -m sf_flat_routes map && python -m pytest tests/test_webmap.py -q
Project structure
sf_flat_routes/
  config.py           all tunable parameters: CRS, weights, thresholds, modes
  sources.py          dataset registry: URLs, dates, licences, limitations
  download.py         cached acquisition; Parquet row-group bbox pruning
  network.py          street graph from Overture segments + connectors
  elevation.py        DEM mosaic, sampling, smoothing, structure handling
  metrics.py          per-directed-edge metrics: grades, gain, steep distance
  routing.py          cost model and scipy-backed shortest paths
  neighborhoods.py    boundaries and representative access points
  pairs.py            neighborhood-pair matrix and Pareto frontiers
  corridors.py        corridor importance scoring and merging
  passes.py           minimax passes, lowland basins, barriers
  validate.py         checks against known ground truth
  viz_static.py       publication maps (matplotlib + lidar hillshade)
  webgraph.py         packs the graph into a compressed browser payload
  places.py           offline place index for the route finder, and the
                      hillshade base image
  viz_interactive.py  assembles the two self-contained web pages
  web/                their HTML, CSS and JavaScript: the shared router
                      (engine.js), the route finder (simple.js), the
                      explorer (app.js) and the warped city (warp.js)
site/                 flattensf.com as a static site (built; deployed
                      to GitHub Pages by .github/workflows/pages.yml)
  sensitivity.py      rebuilds the pipeline under perturbed parameters
  report.py           generates outputs/findings.md from the outputs
  pipeline.py         stage orchestration
  __main__.py         CLI
  vendor/             Leaflet 1.9.4 (BSD-2-Clause), inlined into the map
notebooks/            exploration only; the analysis runs from the CLI
tests/                139 tests
data/raw/             cached source data (never modified)
data/processed/       cached intermediate products
outputs/              deliverables
Raw data is never written to; every expensive product is cached and
recomputed only with --force. Output is byte-reproducible: rebuilding the
maps and reports from the same cached data produces identical files, so the
repository does not churn on every run.
Limitations
Beyond the two dataset substitutions above:
- Elevation is the ground, not the road surface. Bridges and tunnels are interpolated; a handful of piers over water are solved from neighbours.
- Travel is on street centrelines. Pedestrian distances are block-scale, not door-to-door, and sidewalk-level detail is deliberately unused.
- Maximum gradient on short edges is unreliable. Over a 5 m stub a single decimetre of artefact reads as 20%; the worst real case found was a 5 m connector at Market and 5th reporting 41%. Edges under 15 m are flagged and excluded from maximum-gradient tests, which fall back to average gradient. 41,330 of 87,776 edges are long enough to carry a reliable maximum.
- One access point per neighborhood. Large or awkward neighborhoods (Bayview, Lakeshore, the Presidio) are served worse than compact ones.
- No traffic, signals, surface quality or safety. The bicycle stress weights are a proxy for road class, not a level-of-traffic-stress model.
- Gradients are attenuated at the extremes. Published "steepest street" figures are measured over the single steepest pitch, sometimes only 15–20 m long, and the smoothing chain costs roughly eight percentage points there. Bradford Street shows the whole chain: 41.4% sampled raw at 5 m against a published 41%, 36.8% raw at 10 m, 36.9% with the 50 m window applied within the edge, and 33.1% as the pipeline computes it (smoothed across whole segments and reconciled at intersections). The trade is deliberate: with less smoothing, lidar artefacts pushed 22nd Street and Baden Street to the 60% plausibility ceiling. For a project about flat routes, clipping the peak of a 41% wall is a much cheaper error than inventing gradient on flat ground.
- The place search is only as good as its sources. Intersections and
addresses are solid; Overture's places feed puts some well-known names in
the wrong place, and the corroboration rules in
places.pyremove the worst of it rather than all of it. Check the pin. - The web pages quantise the graph to keep the file small:
lengths and steep distances to 5 cm, climbing to 1 cm, gradients to 0.01%.
Route totals therefore drift from the Python figures by a few tens of
centimetres over a long route, and where two routes tie on cost the browser
may pick the other one.
tests/test_webmap.pyasserts both that the browser's metrics match Python's on an identical path and that its own route is never more expensive. - Treasure Island / Yerba Buena Island are excluded from pair routing: they are part of San Francisco but have no pedestrian access across the western span of the Bay Bridge.
Licence and attribution
Analysis code in this repository is available under the MIT licence. The data
it consumes is not: street geometry is © OpenStreetMap contributors,
ODbL 1.0 (via Overture Maps), and any redistribution of derived street
geometry — including outputs/flat_corridors.geojson,
data/processed/edges_*.parquet and the interactive map — carries ODbL
share-alike obligations. USGS 3DEP elevation is public domain. Leaflet is
bundled under BSD-2-Clause; see
sf_flat_routes/vendor/README.md.