Evidence-driven qualification and validation of local LLM deployments.
Python
3
167 commits
updated Oct 11, 2026
From local hardware to evidence-backed LLM deployment decisions.

Jaull is an explainable local-AI qualification toolkit. It reads your machine, selects candidate language models, resolves the exact artifact you would actually run, verifies it, checks whether a local runtime and compute backend can execute it, runs it, benchmarks it, and compares what it predicted against what really happened.
The question it is built around:
Can this exact model, artifact, runtime and configuration satisfy the workload we want to run on this infrastructure?
A recommendation is only the beginning of that answer. Everything after it — the artifact, the revision, the runtime, the backend, the execution, the measurement — is what turns a plausible suggestion into a decision you can defend.
predict → acquire → verify → execute → benchmark → compare → qualify → deploy
Jaull implements predict → compare today. qualify and deploy are the direction the
project is heading in; see Where Jaull is going for what is real
and what is not.
Jaull is an active open-source engineering project developed as an undergraduate end-of-degree project (TFG) on local-AI infrastructure. It is usable, it is tested, and it is not finished.
Requirements: Python 3.12+ and uv.
git clone https://github.com/Ton-Llop/Jaull.git
cd Jaull
uv sync
uv run jaull ui
uv sync creates the virtual environment and installs the runtime dependencies plus the
dev dependency group. Pass --no-dev if you only want the runtime dependencies.
Optional but useful:
vulkaninfo for non-NVIDIA accelerator and backend detection;llama.cpp build (llama-cli, llama-bench) for GGUF execution and benchmarks;HF_TOKEN in the environment for gated or private repositories.uv run jaull # opens the TUI when run in a terminal
uv run jaull scan # local hardware and compute backends
uv run jaull doctor # environment, runtime and readiness checks
uv run jaull inspect <repo-id-or-url> # analyse a model repository
uv run jaull estimate <repo-id-or-url> # memory footprint + compatibility
uv run jaull run --model <repo> --prompt "Hello" # download, verify and execute a GGUF
Full option reference: docs/cli.md.
Everything in this section exists in the code and is covered by the test suite.
Hardware and backends. Detects OS, CPU, RAM and storage; NVIDIA GPUs with VRAM and
driver versions through NVML; and non-NVIDIA adapters through a vulkaninfo probe that
records per-backend availability (CUDA / Vulkan / HIP / CPU) and flags software renderers
such as llvmpipe instead of treating them as usable accelerators. On Linux, a discrete
Vulkan device can additionally obtain physical and, when the driver exposes it, available
VRAM from DRM sysfs. That enables AMD/Vulkan planning without treating VRAM and system RAM
as one pool. Runtime execution still requires a compatible local binary, verified separately
through llama-cli --list-devices; Intel and Apple memory discovery remain outside this path.
Model inspection. Normalises any Hugging Face URL form to a repo_id, classifies the
repository (transformers / gguf / diffusers / onnx / adapter / unknown) and
reports files, GGUF quantization variants and configuration — downloading only small
metadata files, never weights.
Explainable memory estimation. Weights, KV cache, runtime overhead, device reserve and
safety margin are estimated separately, each row carrying its provenance (exact,
metadata, derived, assumed, unknown) and a confidence reduced by the weakest link.
For GGUF repositories without a config.json, the base model is resolved from card
metadata and the GGUF header is read over HTTP Range (≤ 8 MiB, streamed and abandoned once
the header is in hand) instead of downloading the file.
→ docs/estimation.md
Guided requirements and recommendation. Six or seven plain-language questions, depending
on whether the document-context question applies — no model names, quantizations or dtypes —
become a UserRequirements object that records every assumption it made. Discovery queries
the Hub API, deduplicates and filters candidates, then shortlists
them for deep inspection using a coarse hardware placement hint, so GPU-resident, offload and
CPU-RAM candidates all stay in play instead of one size class taking every slot.
Ranking then runs over execution plans, not repositories, and produces no global score: each plan is assessed on separate axes — task suitability, capability, hardware feasibility, technical executability, measured performance evidence and confidence — and ordered by a lexicographic key whose axis order is chosen by the user's priority. Hard incompatibilities remove a plan outright; a diversifier then keeps one slot per logical model. Every reason and warning is generated by explicit rules. No language model is involved in ranking or in writing the explanations.
The wizard records model task and workload mode separately. Optional workload SLOs are requested objectives; benchmark measurements remain separate observations.
The ranking is also independent of what happens to be installed: a missing llama-cli
changes readiness, not the Top 5, and that invariant is pinned by a test.
→ docs/recommendation.md
Execution plans. A recommendation is resolved into a logical model identity, the artifact variants that represent it (GGUF quantizations, safetensors precisions) and the concrete execution plans built from those variants — each with its runtime, backend selection, readiness and memory prediction.
Artifact resolution, download and verification. Resolves a repository plus quantization to a single-file GGUF artifact at a concrete revision, downloads it into a per-user artifact store with path-traversal protection, and verifies file size and SHA-256 against a sidecar (with optional full re-hashing). A known expected digest must match the downloaded file and cannot be replaced by a conflicting local sidecar.
Runtime and backend readiness. Discovers local llama.cpp builds (explicit path,
registry, PATH, conventional build directories) and the PyTorch/Transformers environment,
probes which backends each one actually exposes, selects a compute backend for the detected
hardware, and produces an ExecutionReadiness preflight decision before anything is run.
Real execution. jaull run executes single-file GGUF artifacts through llama-cli.
When its capability probe confirms a non-CPU device, the prepared launch pins the
runtime to the reported device identifier (for example Vulkan0 or HIP0) instead of
guessing from the host GPU name. The TUI additionally executes Transformers repositories
through an isolated Python worker.
Every execution produces an ExecutionObservation — success, duration, exit status, peak
sampled process RSS and, when NVML can attribute it to the PID, peak process VRAM — kept
strictly separate from the prediction.
Persisted experiments. A validation run is stored as an immutable ExperimentRecord
(one JSON file per experiment, with a schema version) linking the hardware profile, the
artifact, the runtime, the prediction, the preflight, the observation and the comparison.
A failed execution is still a valid experiment: failures are evidence too.
Benchmark evidence. llama.cpp benchmarks run through llama-bench (prefill and
generation throughput at several token counts, with repetitions and standard deviations);
Transformers benchmarks run through an isolated worker; PyTorch ROCm is represented by its
normal cuda device namespace and is accepted only when the runtime probe confirms HIP.
The current Transformers methodology is transformers_isolated_inference_v3: GPU
timings synchronize device work, and steady-state decode excludes the initial prefill.
The worker also reports model load time and time to first token. Historical v2 records
remain readable but are not current recommendation performance evidence.
Results are persisted as BenchmarkRecord JSON files, and
benchmarks of the same logical model can be compared as complete execution plans rather
than as disembodied numbers. Failed runs retain diagnostics but do not replace earlier
successful performance evidence.
Optional quality diagnostics. jaull quality run explicitly invokes the pinned
local GGUF/container pilot, evaluates artifacts sequentially and saves completed,
HTTP-validated records. jaull quality compare compares stored per-task metrics
offline and withholds comparisons when protocols differ. Execution currently needs
a trusted Jaull checkout, exact verified local GGUFs, the pinned runtime/dataset and an already-built
evaluator image; it performs no model downloads or automatic builds. Results are plumbing or
limited diagnostics, not a general-quality score, and never alter ranking.
The TUI exposes the same opt-in pilot in Advanced tools → Evaluate local GGUF quality
and Results/Paths → Evaluation. The TUI prepares the selected GGUF
manifest automatically, with full verification and explicit download permission.
Prepare evaluator checks the pinned runtime, dataset and image. The dataset
has a managed default location and can be downloaded with separate explicit
permission; jaull quality setup --allow-dataset-download offers the same flow
from the CLI. Shared settings are remembered after successful setup; download
permissions are not. Opening Jaull never starts a download or evaluator.
Results -> Evaluate candidates proposes up to three exact GGUFs from the
inspected search pool, not just the displayed top five. Review the selection,
download sizes and omissions, then start sequential diagnostics. This does not
find a general-quality winner or change the recommendation order.
→ CLI quality pilot
Prediction vs observation. compare_prediction puts a MemoryEstimate next to an
ExecutionObservation and reports the signed error under a single convention
(measured − predicted), plus whether the compatibility verdict was a correct
success/failure or a false positive/negative. Where the methodology does not support a
comparison — VRAM attribution, or RAM under GPU offload — it says so explicitly instead of
inventing a number.
→ docs/evidence.md
Two front-ends over the same services. A Typer CLI with stable --json output, and a
Textual TUI that shows the equivalent CLI command for what it just did. Both go through the
same AdvisorService; neither contains business logic.
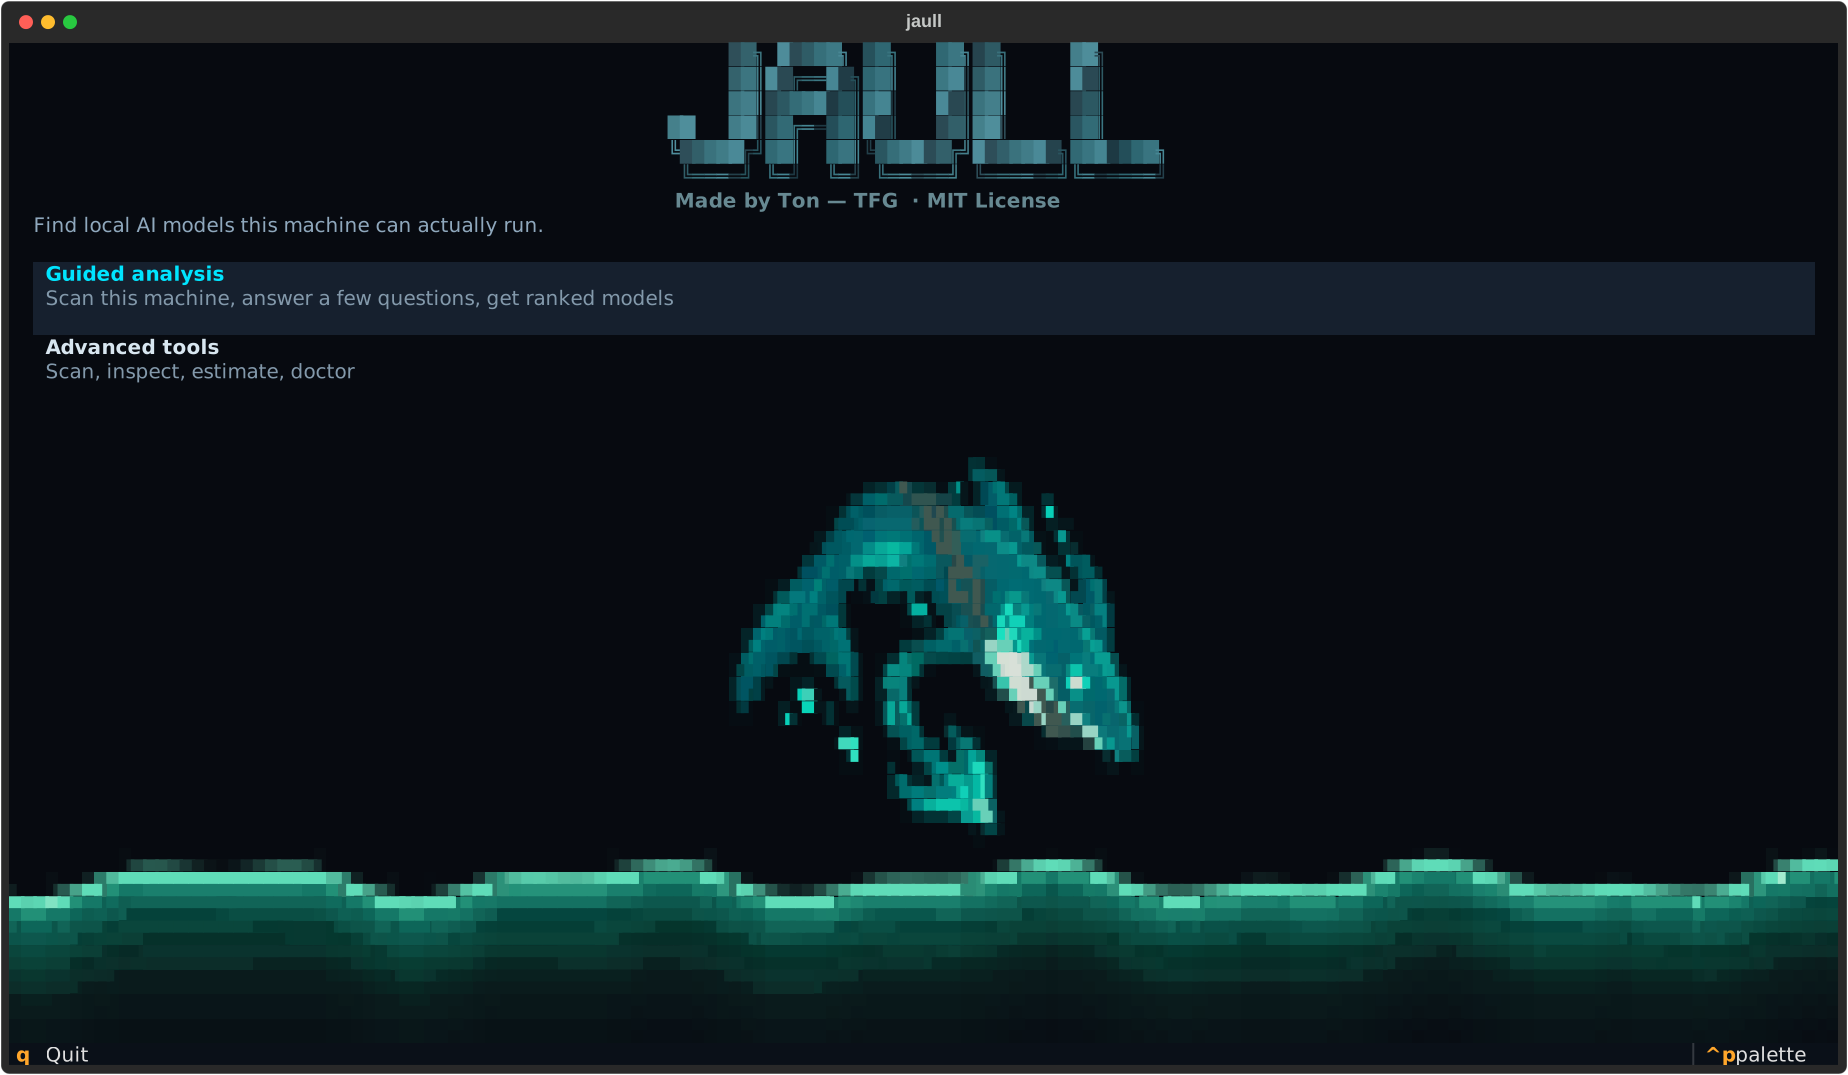
The TUI opens on a choice between a guided analysis and the individual tools:
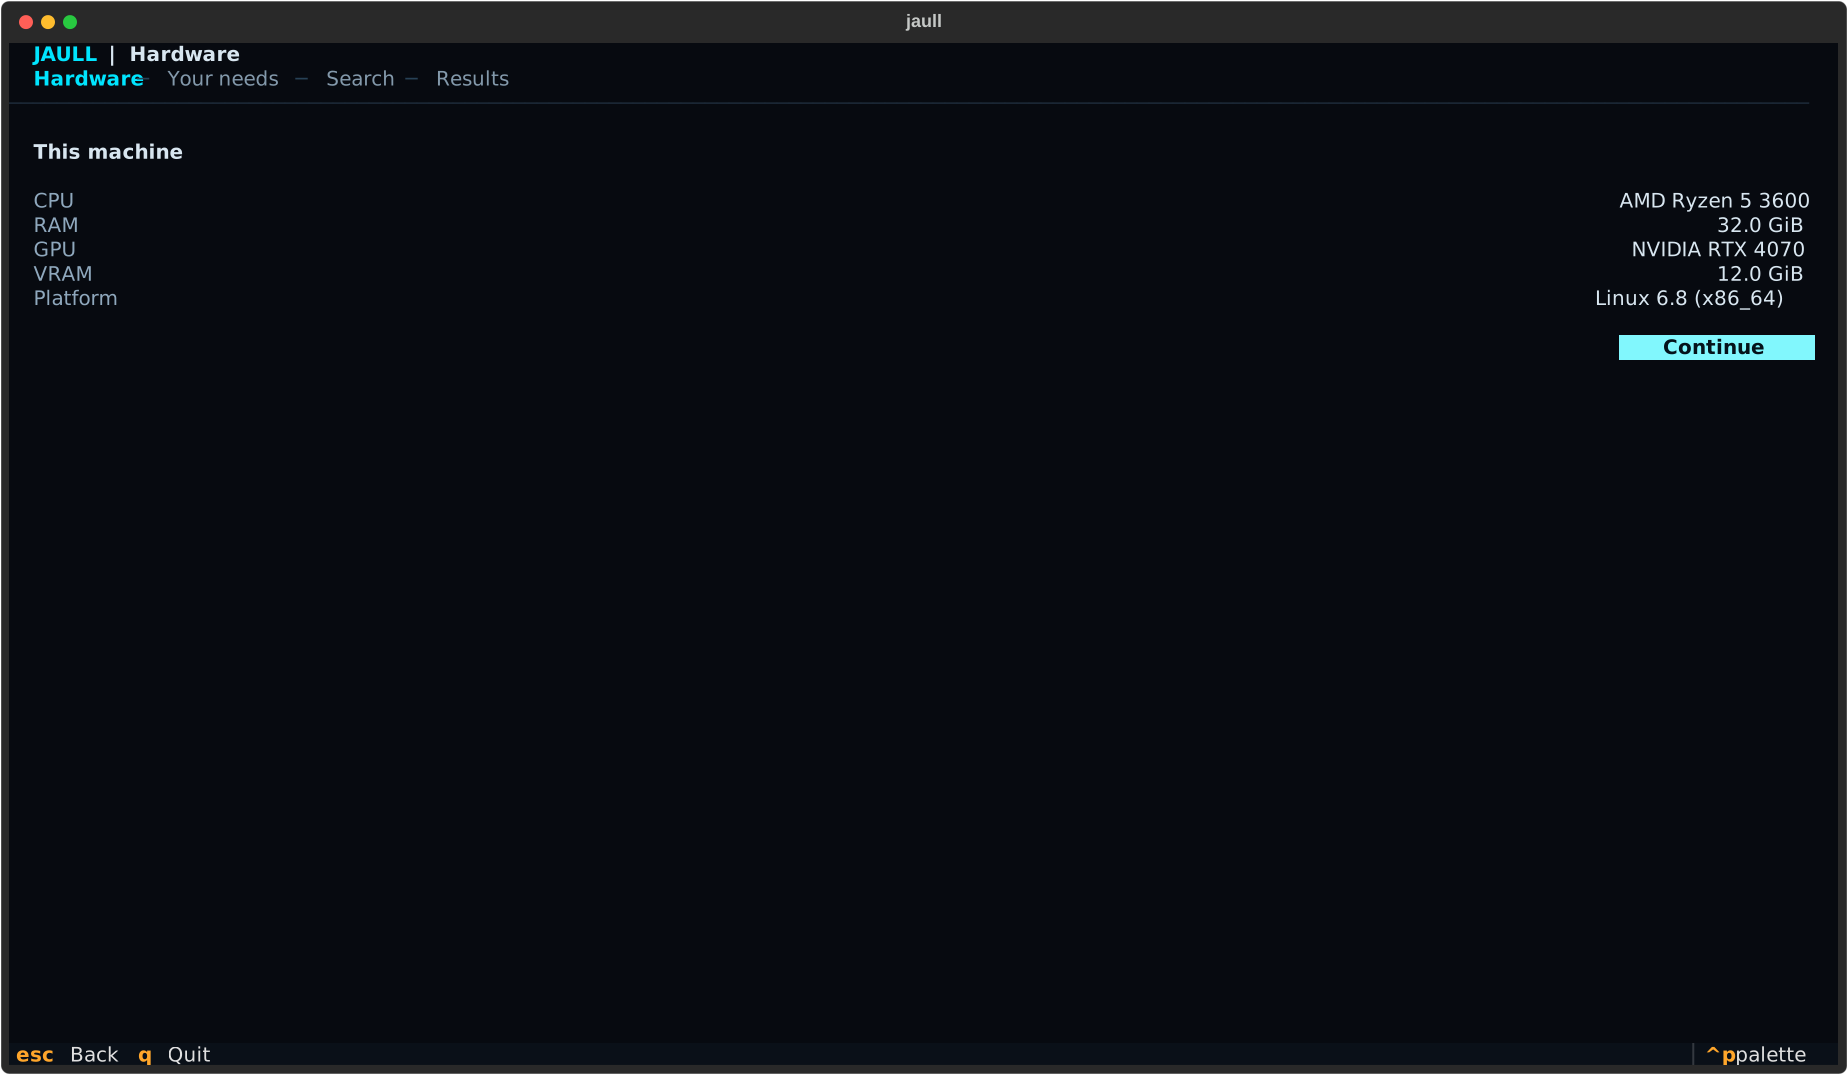
Guided mode starts with a hardware scan. Each checklist line turns green when its probe actually returns — there is no fake progress — and the detected profile replaces the checklist in place when the scan finishes:
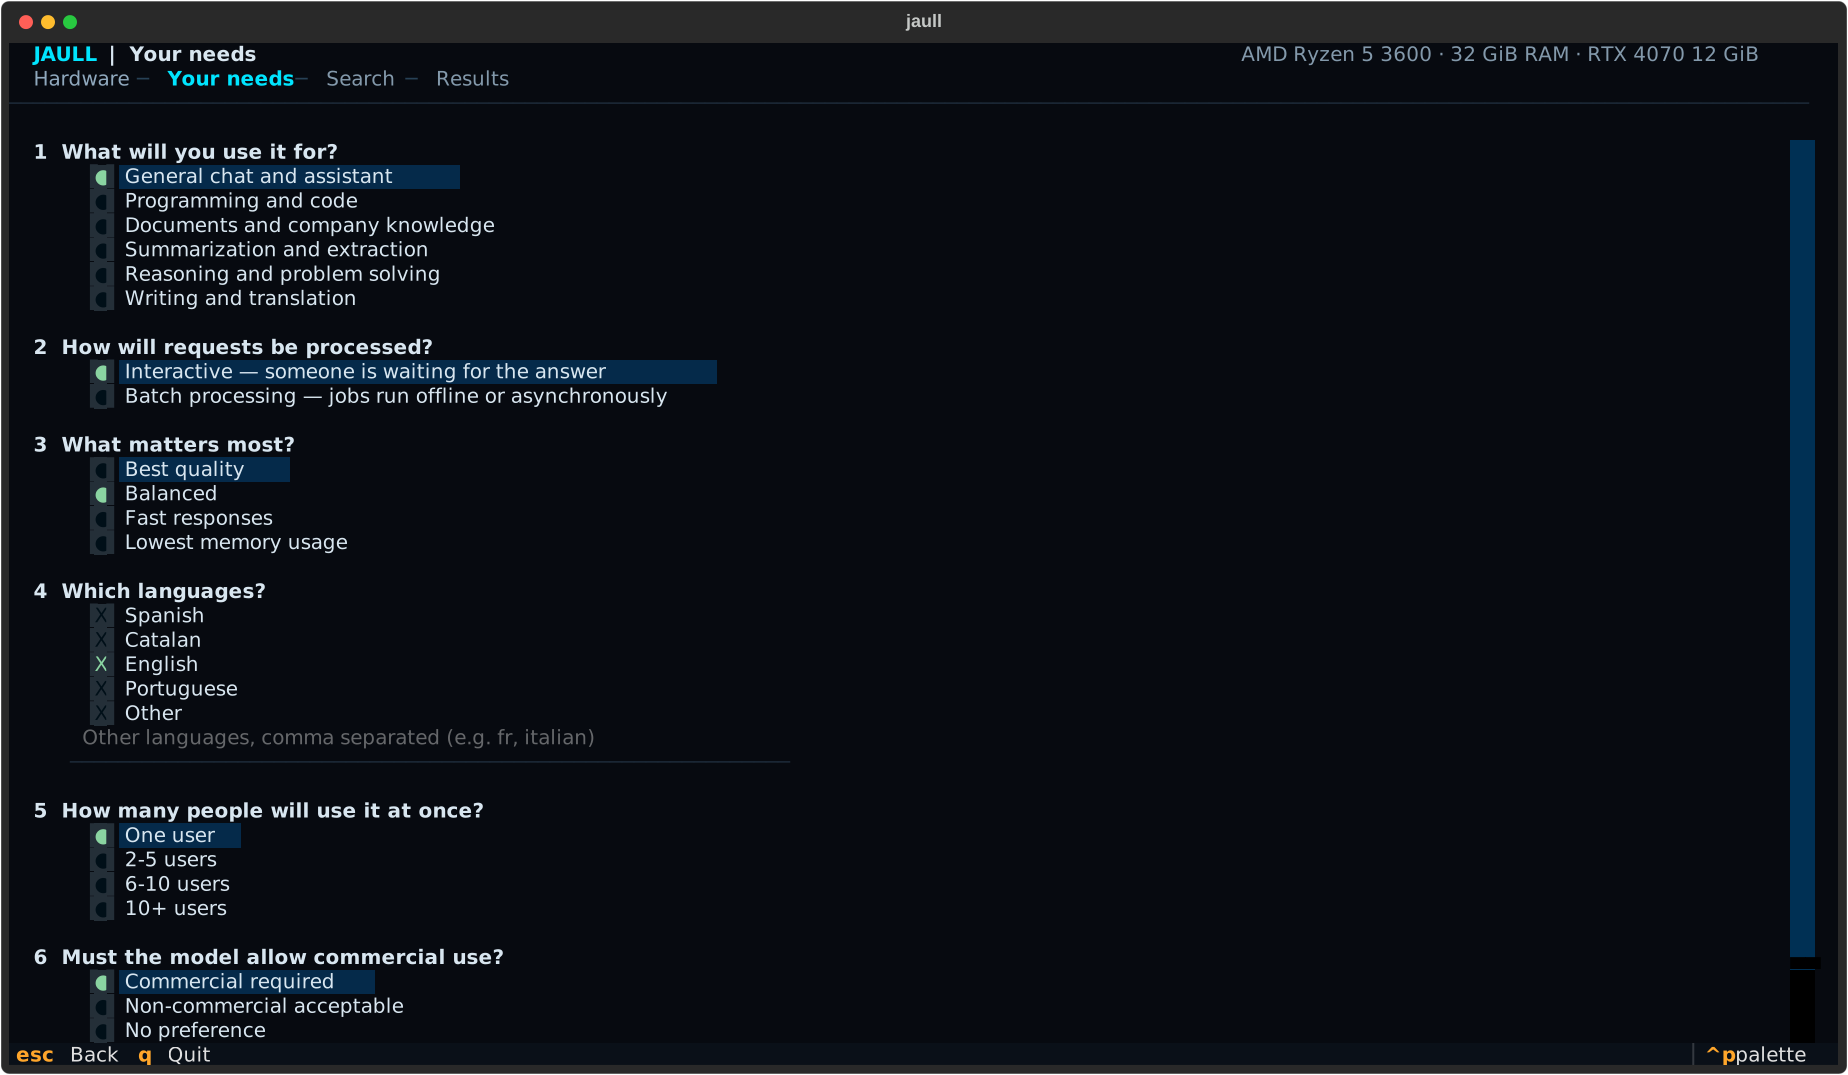
Then six or seven plain-language questions, depending on the selected task:
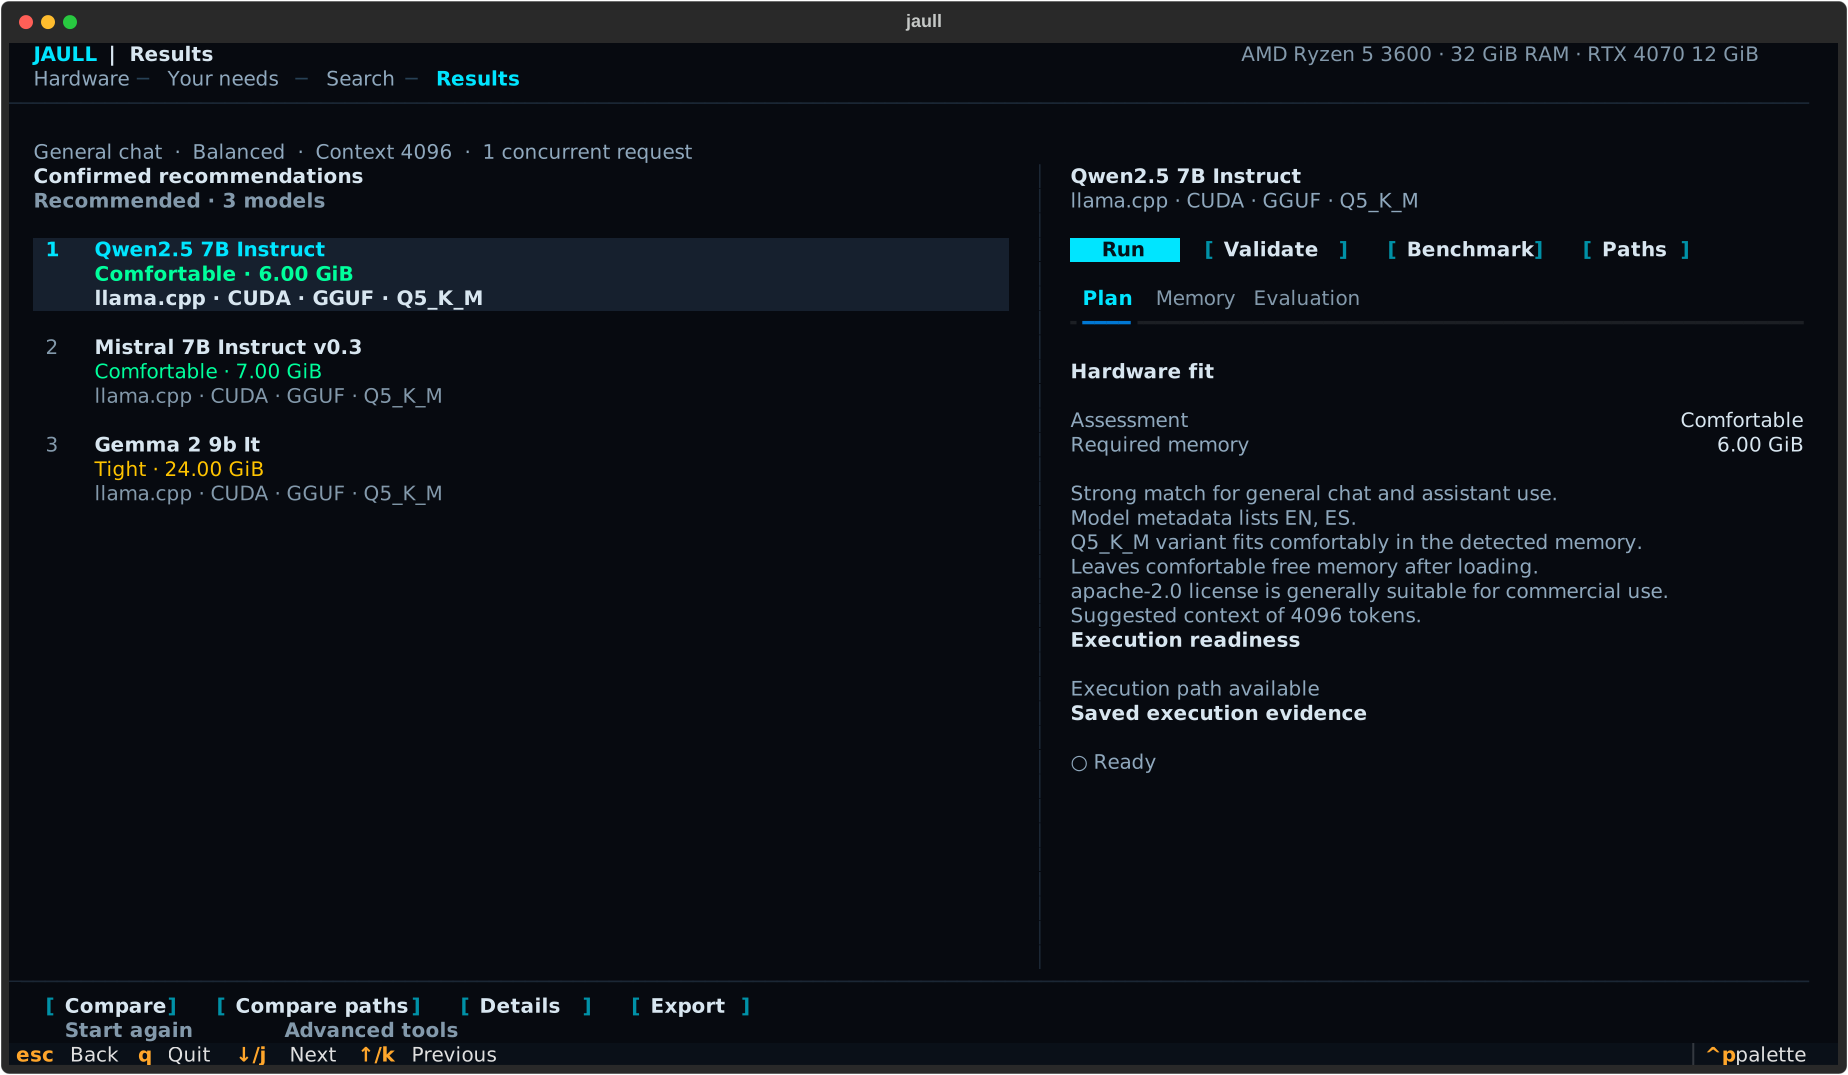
The best match leads, with the alternatives compressed to one line each:
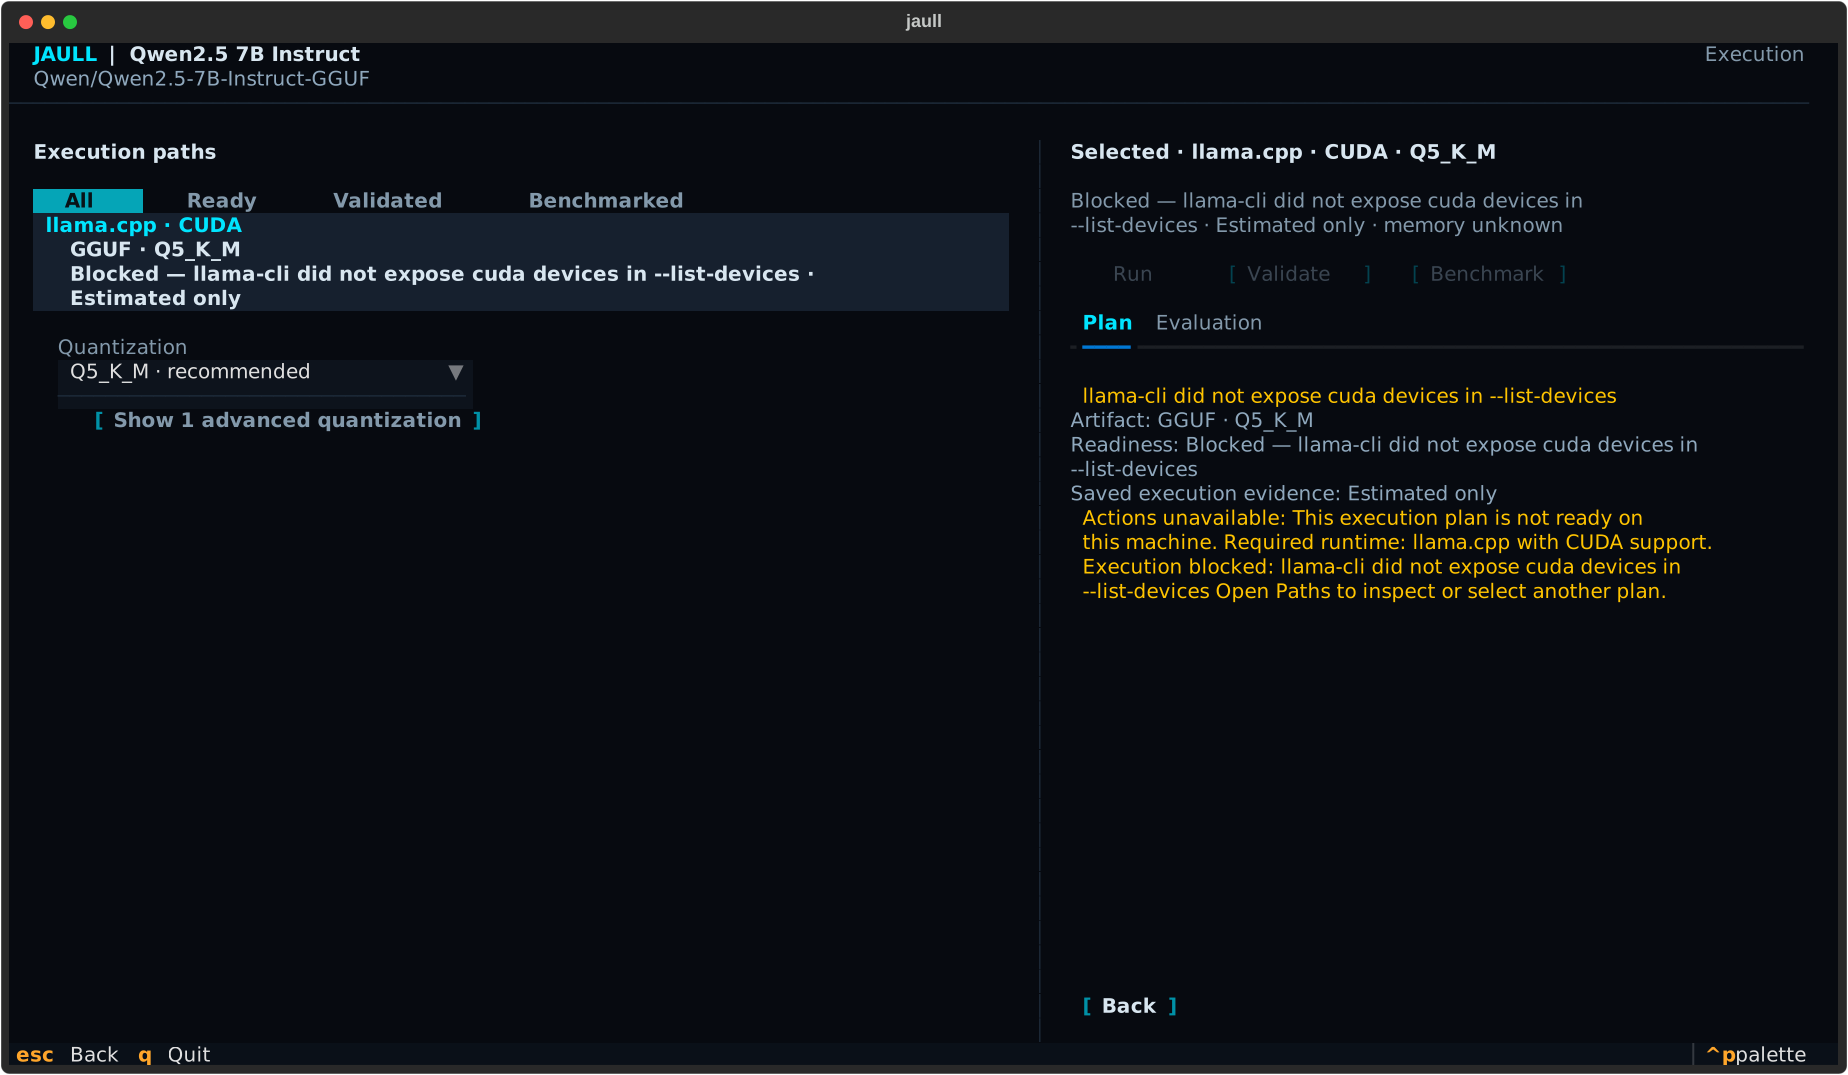
From a recommendation you reach its execution paths: the artifact variants and runtimes that could actually run it, each labelled with how much evidence stands behind it — estimated, ready, validated or benchmarked:
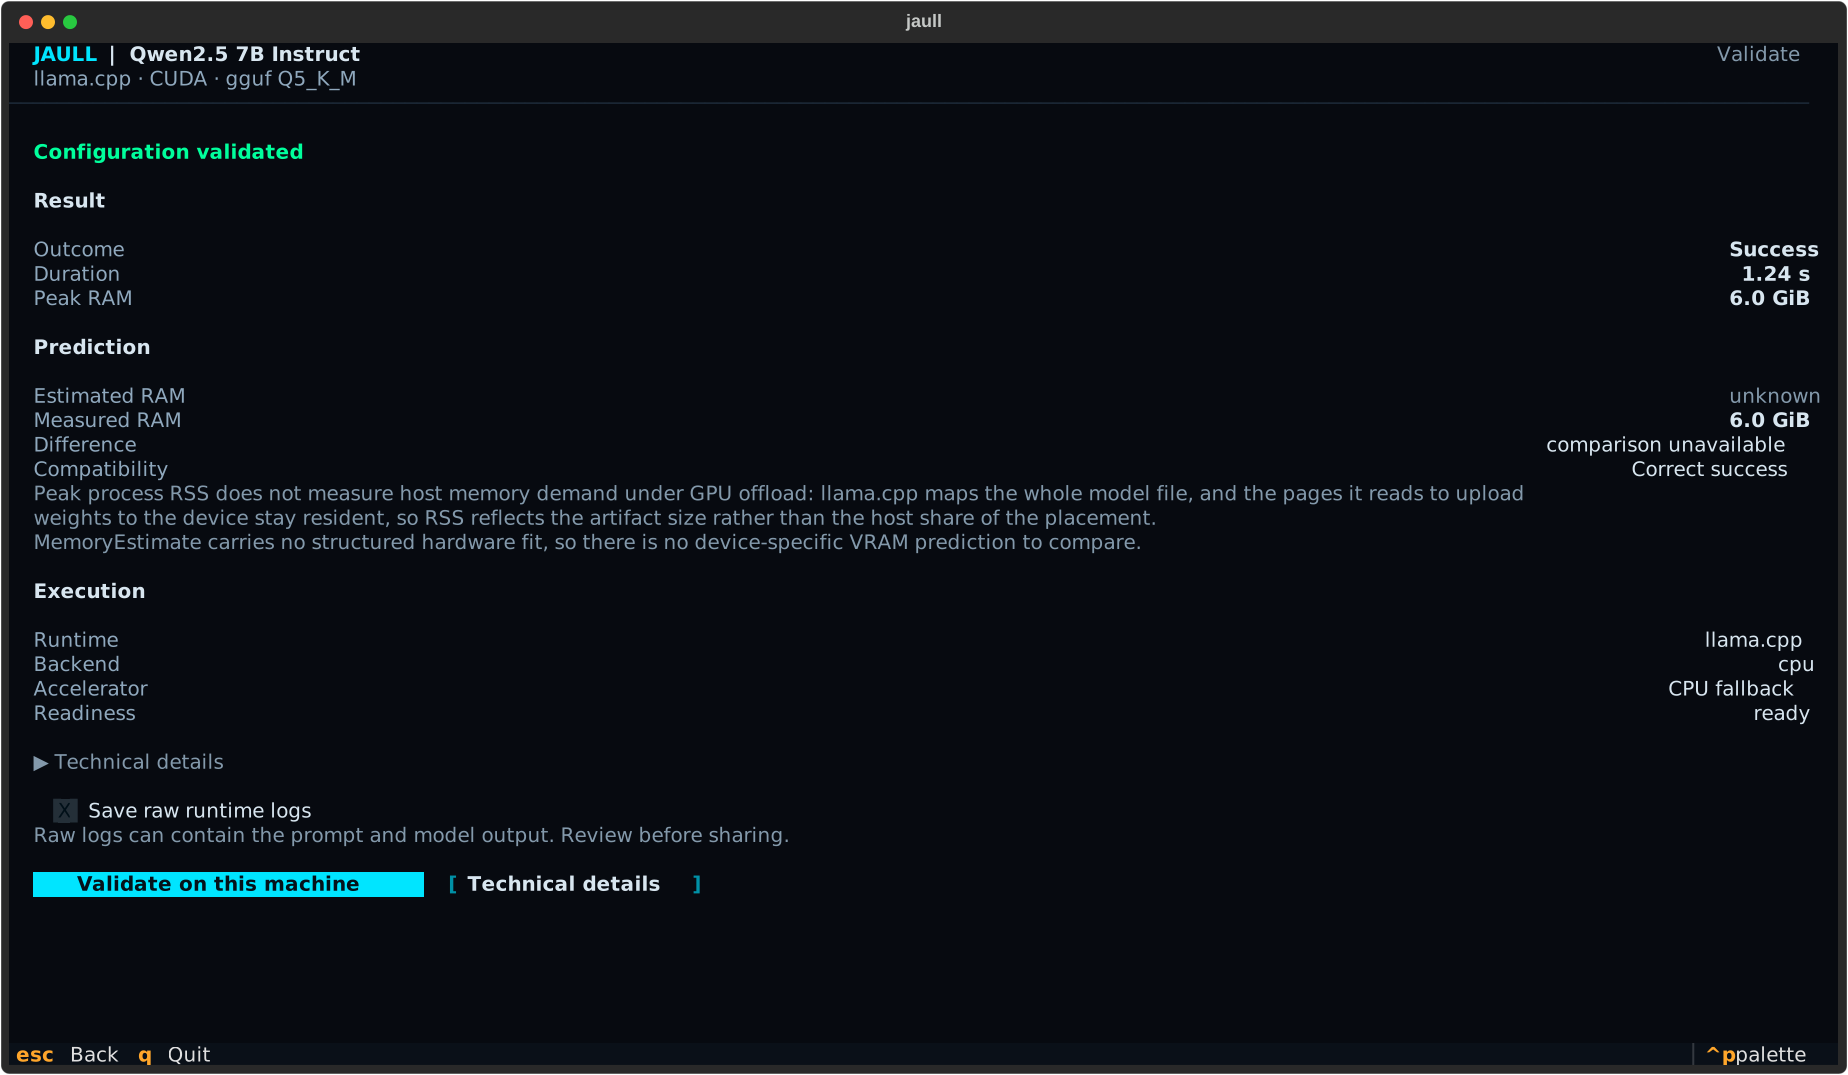
Validation runs the plan for real and compares the prediction against the observation:
More screens — search, run history, failure states, the memory estimate view — in docs/ui.md.
Screenshots are regenerated with
uv run python scripts/capture_screenshots.py --size 150x42(headless, no network, no llama.cpp).
The workload contract is available; qualification and capacity measurement are not. The sections below describe the intended direction, not a current verdict.
Jaull can record task separately from interactive or batch mode, plus context, concurrent users and optional input/output lengths, minimum generation throughput and maximum time-to-first-token. These are requested objectives, not measured results or a qualification verdict. The wizard only asks for task and mode; SLOs are optional API data.
Running real load rather than single prompts: concurrency sweeps, throughput and TTFT under load, RAM and VRAM behaviour, degradation curves, and an estimate of the concurrency a machine can actually sustain.
The next planned step is small: one loaded llama.cpp server with 1, 2 and 4 simultaneous users. Loading and warm-up stay separate from request measurements. Multiple model processes would measure a different workload. This experiment is not implemented yet; see the current status.
Turning the accumulated evidence into an explicit verdict:
QUALIFIED
CONDITIONALLY QUALIFIED
NOT QUALIFIED
backed by the experiments and benchmarks that produced it, and by the policy gates it was evaluated against.
A validated configuration should be pinnable to something like a jaull.lock: exact
repository, revision, artifact and SHA-256; runtime, version and backend; context and
runtime parameters; the hardware it was validated on; the measurements obtained; and the
workload it was qualified for — and then exportable as a reproducible deployment.
implemented  hardware → requirements → candidates → prediction → artifact → verification
             → runtime/backend readiness → execution → benchmark → prediction vs observation
             + workload profile and optional SLO data (not measured qualification)

planned      load & capacity experiments → sustainable concurrency
             → deployment qualification → jaull.lock → reproducible deployment
Jaull is a modular Python monolith. There are no workers, no containers and no remote executors — the boundaries exist so those can be added later without a rewrite.
The dependency direction is one-way:
Presentation    cli/ · tui/ · presentation/ · reporting/ · diagnostics/
      ↓
Advisor         advisor/          the single facade both front-ends talk to
      ↓
Application     application/ · workflow/     use cases and guided orchestration
      ↓
Domain / Ports  domain/ · ports/  frozen models, pure heuristics, boundary protocols
      ↑
Adapters        adapters/ and the infrastructure packages, composed by bootstrap/
src/jaull/
├── domain/           # frozen Pydantic models, enums, policies, pure heuristics
├── ports/            # boundary protocols for replaceable infrastructure
├── application/      # use cases: requirements, model references, variant discovery,
│                     #   recommendation service, policies, execution-plan assembly
├── adapters/         # concrete implementations behind the ports (model-analysis cache)
├── bootstrap/        # production composition root (`ServiceContainer`)
├── advisor/          # application facade used by both front-ends
├── hardware/         # CPU/RAM/storage probes, NVML, Vulkan backend detection
├── huggingface/      # Hub client, URL parser, repository classifier, artifact resolver
├── analyzers/        # per-repository-type analyzers behind a Protocol
├── metadata/         # GGUF header reader over HTTP Range, base-model resolver, config merge
├── estimator/        # weights, KV cache, overhead, compatibility, policies
├── discovery/        # Hub search, query building, filtering, enrichment, series grouping
├── recommendation/   # plan assessment, ranking, diversity, tiers, explanations
├── execution_plans/  # logical model identity and pure execution-plan construction
├── workflow/         # guided-run orchestrator, progress/state, per-run cache
├── artifacts/        # artifact resolution, download, storage layout, SHA-256 verification
├── runtime/          # runtime discovery, capability probes, backend selection, runners
├── execution/        # process execution contracts + host backend
├── experiments/      # experiment runner and JSON record store
├── benchmarks/       # benchmark matrix runner and JSON record store
├── evaluation/       # prediction vs observation, and benchmark vs benchmark, comparison
├── observability/    # performance telemetry
├── reporting/        # JSON + Markdown serialisation
├── presentation/     # Rich rendering
├── diagnostics/      # environment, runtime and readiness checks (`doctor`)
├── cli/              # thin Typer commands
└── tui/              # Textual screens and widgets
Recommendation policy, requirements normalisation, budgets and variant discovery live in
application/; telemetry lives in observability/; service construction lives in
bootstrap/. workflow/ contains the guided-run orchestrator, progress and state DTOs, and
the per-run memoisation cache. Old Python import paths for moved modules have been removed.
execution_plans/ is likewise reduced to logical model identity and pure plan construction;
anything that needs recommendation DTOs, search or caching lives in application/.
The boundaries enforced by tests/test_architecture_dependencies.py:
domain/ imports nothing from the layers above it, and no infrastructure library.application/ never imports adapters, presentation, advisor, workflow/ or Hugging Face
clients — it depends on domain models and ports.ports/ never imports adapters or presentation.execution_plans/ never imports workflow/ or recommendation/.recommendation/ never imports workflow/, the advisor or a front-end.presentation/ and TUI screens never import Hugging Face adapters.That test scans imports with ast; its exception list is exact and currently empty. The
complete layer map and additional convention checks live in
ARCHITECTURE.md.
Beyond the import graph:
application/, workflow/, discovery/ and recommendation/ are pure Python — the whole
guided pipeline runs, and is tested, without a terminal.MemoryEstimate), observation (ExecutionObservation) and their comparison
(PredictionComparison) are three separate objects. Measurement never edits a prediction.Protocol, so tests inject fakes.policies.py module.Layer diagram, current package map and dependency rules: ARCHITECTURE.md.
Implemented and covered by tests:
llama-cli; Transformers through an isolated worker in the TUI)llama-bench, Transformers worker) with persisted recordsNot implemented:
jaull.lock)run pathVulkan and ROCm/HIP support is currently experimental: backend detection and runtime readiness are implemented, but AMD hardware validation is still required before treating the results as production-qualified. Vulkan is currently a llama.cpp/GGUF path; it is not presented as a Transformers backend.
Start with STATUS.md for what works and what comes next, or Jaull explained simply for a Spanish introduction. The references below describe the current implementation.
| Document | Contents | Language |
|---|---|---|
| docs/cli.md | Command and option reference | English |
| ARCHITECTURE.md | Current layers, dependency rules, AdvisorService | English |
| docs/estimation.md | Memory model, GGUF enrichment, compatibility | English |
| docs/recommendation.md | Guided mode, discovery, scoring, licenses | English |
| docs/evidence.md | Artifacts, runtimes, execution, experiments, benchmarks | English |
| docs/experimental-validation.md | Reproducible cross-machine validation procedure | English |
| docs/limitations.md | What Jaull deliberately does not do | English |
| docs/ui.md | TUI screen gallery | English |
| docs/llamacpp.md | Building and wiring up llama.cpp | English |
| validation/README.md | Index of retained experimental evidence | English |
| scripts/README.md | Manual script catalogue and effects | English |
TFG material is separate from operating instructions: glossary, development log, and the dated workflow walkthrough and technical audit.
Some documents are in Catalan or Spanish because they belong to the academic project this tool grew out of. Everything written for contributors is in English.
The short version — the full list is in docs/limitations.md:
run,
validation and benchmarking do, and only when you ask for them.run path is limited to single-file GGUF artifacts.sliding_window as the only refinement; MoE,
MLA and multimodal composites return unknown rather than a fabricated number.ASSUMED. Per-block offloading is modelled, but as a runtime-agnostic placement, not as
a measured runtime layer cost — gpu_transformer_blocks is not the same unit as
llama.cpp's --n-gpu-layers.Jaull is under active development and contributions are welcome — bug reports, tests, runtime integrations, benchmark methodology, documentation and UX fixes.
The most valuable thing you can contribute is a run on hardware we do not have. Jaull makes claims about hardware detection, backend availability, runtime compatibility and memory behaviour, and those claims have only been exercised on a narrow set of machines. An AMD, Intel, Apple Silicon or CPU-only report — even one that only says "detection got this wrong" — is directly useful.
See CONTRIBUTING.md for how to set up the environment, run the checks and open a pull request, and SECURITY.md for reporting security issues.
MIT. See LICENSE.
License information reported for models comes from their metadata and is not legal advice. Check a model's license yourself before commercial use.
Evidence-driven qualification and validation of local LLM deployments.
Python
3
167 commits
updated Oct 11, 2026
From local hardware to evidence-backed LLM deployment decisions.
Jaull is an explainable local-AI qualification toolkit. It reads your machine, selects candidate language models, resolves the exact artifact you would actually run, verifies it, checks whether a local runtime and compute backend can execute it, runs it, benchmarks it, and compares what it predicted against what really happened.
The question it is built around:
Can this exact model, artifact, runtime and configuration satisfy the workload we want to run on this infrastructure?
A recommendation is only the beginning of that answer. Everything after it — the artifact, the revision, the runtime, the backend, the execution, the measurement — is what turns a plausible suggestion into a decision you can defend.
predict → acquire → verify → execute → benchmark → compare → qualify → deploy
Jaull implements predict → compare today. qualify and deploy are the direction the
project is heading in; see Where Jaull is going for what is real
and what is not.
Jaull is an active open-source engineering project developed as an undergraduate end-of-degree project (TFG) on local-AI infrastructure. It is usable, it is tested, and it is not finished.
Requirements: Python 3.12+ and uv.
git clone https://github.com/Ton-Llop/Jaull.git
cd Jaull
uv sync
uv run jaull ui
uv sync creates the virtual environment and installs the runtime dependencies plus the
dev dependency group. Pass --no-dev if you only want the runtime dependencies.
Optional but useful:
vulkaninfo for non-NVIDIA accelerator and backend detection;llama.cpp build (llama-cli, llama-bench) for GGUF execution and benchmarks;HF_TOKEN in the environment for gated or private repositories.uv run jaull # opens the TUI when run in a terminal
uv run jaull scan # local hardware and compute backends
uv run jaull doctor # environment, runtime and readiness checks
uv run jaull inspect <repo-id-or-url> # analyse a model repository
uv run jaull estimate <repo-id-or-url> # memory footprint + compatibility
uv run jaull run --model <repo> --prompt "Hello" # download, verify and execute a GGUF
Full option reference: docs/cli.md.
Everything in this section exists in the code and is covered by the test suite.
Hardware and backends. Detects OS, CPU, RAM and storage; NVIDIA GPUs with VRAM and
driver versions through NVML; and non-NVIDIA adapters through a vulkaninfo probe that
records per-backend availability (CUDA / Vulkan / HIP / CPU) and flags software renderers
such as llvmpipe instead of treating them as usable accelerators. On Linux, a discrete
Vulkan device can additionally obtain physical and, when the driver exposes it, available
VRAM from DRM sysfs. That enables AMD/Vulkan planning without treating VRAM and system RAM
as one pool. Runtime execution still requires a compatible local binary, verified separately
through llama-cli --list-devices; Intel and Apple memory discovery remain outside this path.
Model inspection. Normalises any Hugging Face URL form to a repo_id, classifies the
repository (transformers / gguf / diffusers / onnx / adapter / unknown) and
reports files, GGUF quantization variants and configuration — downloading only small
metadata files, never weights.
Explainable memory estimation. Weights, KV cache, runtime overhead, device reserve and
safety margin are estimated separately, each row carrying its provenance (exact,
metadata, derived, assumed, unknown) and a confidence reduced by the weakest link.
For GGUF repositories without a config.json, the base model is resolved from card
metadata and the GGUF header is read over HTTP Range (≤ 8 MiB, streamed and abandoned once
the header is in hand) instead of downloading the file.
→ docs/estimation.md
Guided requirements and recommendation. Six or seven plain-language questions, depending
on whether the document-context question applies — no model names, quantizations or dtypes —
become a UserRequirements object that records every assumption it made. Discovery queries
the Hub API, deduplicates and filters candidates, then shortlists
them for deep inspection using a coarse hardware placement hint, so GPU-resident, offload and
CPU-RAM candidates all stay in play instead of one size class taking every slot.
Ranking then runs over execution plans, not repositories, and produces no global score: each plan is assessed on separate axes — task suitability, capability, hardware feasibility, technical executability, measured performance evidence and confidence — and ordered by a lexicographic key whose axis order is chosen by the user's priority. Hard incompatibilities remove a plan outright; a diversifier then keeps one slot per logical model. Every reason and warning is generated by explicit rules. No language model is involved in ranking or in writing the explanations.
The wizard records model task and workload mode separately. Optional workload SLOs are requested objectives; benchmark measurements remain separate observations.
The ranking is also independent of what happens to be installed: a missing llama-cli
changes readiness, not the Top 5, and that invariant is pinned by a test.
→ docs/recommendation.md
Execution plans. A recommendation is resolved into a logical model identity, the artifact variants that represent it (GGUF quantizations, safetensors precisions) and the concrete execution plans built from those variants — each with its runtime, backend selection, readiness and memory prediction.
Artifact resolution, download and verification. Resolves a repository plus quantization to a single-file GGUF artifact at a concrete revision, downloads it into a per-user artifact store with path-traversal protection, and verifies file size and SHA-256 against a sidecar (with optional full re-hashing). A known expected digest must match the downloaded file and cannot be replaced by a conflicting local sidecar.
Runtime and backend readiness. Discovers local llama.cpp builds (explicit path,
registry, PATH, conventional build directories) and the PyTorch/Transformers environment,
probes which backends each one actually exposes, selects a compute backend for the detected
hardware, and produces an ExecutionReadiness preflight decision before anything is run.
Real execution. jaull run executes single-file GGUF artifacts through llama-cli.
When its capability probe confirms a non-CPU device, the prepared launch pins the
runtime to the reported device identifier (for example Vulkan0 or HIP0) instead of
guessing from the host GPU name. The TUI additionally executes Transformers repositories
through an isolated Python worker.
Every execution produces an ExecutionObservation — success, duration, exit status, peak
sampled process RSS and, when NVML can attribute it to the PID, peak process VRAM — kept
strictly separate from the prediction.
Persisted experiments. A validation run is stored as an immutable ExperimentRecord
(one JSON file per experiment, with a schema version) linking the hardware profile, the
artifact, the runtime, the prediction, the preflight, the observation and the comparison.
A failed execution is still a valid experiment: failures are evidence too.
Benchmark evidence. llama.cpp benchmarks run through llama-bench (prefill and
generation throughput at several token counts, with repetitions and standard deviations);
Transformers benchmarks run through an isolated worker; PyTorch ROCm is represented by its
normal cuda device namespace and is accepted only when the runtime probe confirms HIP.
The current Transformers methodology is transformers_isolated_inference_v3: GPU
timings synchronize device work, and steady-state decode excludes the initial prefill.
The worker also reports model load time and time to first token. Historical v2 records
remain readable but are not current recommendation performance evidence.
Results are persisted as BenchmarkRecord JSON files, and
benchmarks of the same logical model can be compared as complete execution plans rather
than as disembodied numbers. Failed runs retain diagnostics but do not replace earlier
successful performance evidence.
Optional quality diagnostics. jaull quality run explicitly invokes the pinned
local GGUF/container pilot, evaluates artifacts sequentially and saves completed,
HTTP-validated records. jaull quality compare compares stored per-task metrics
offline and withholds comparisons when protocols differ. Execution currently needs
a trusted Jaull checkout, exact verified local GGUFs, the pinned runtime/dataset and an already-built
evaluator image; it performs no model downloads or automatic builds. Results are plumbing or
limited diagnostics, not a general-quality score, and never alter ranking.
The TUI exposes the same opt-in pilot in Advanced tools → Evaluate local GGUF quality
and Results/Paths → Evaluation. The TUI prepares the selected GGUF
manifest automatically, with full verification and explicit download permission.
Prepare evaluator checks the pinned runtime, dataset and image. The dataset
has a managed default location and can be downloaded with separate explicit
permission; jaull quality setup --allow-dataset-download offers the same flow
from the CLI. Shared settings are remembered after successful setup; download
permissions are not. Opening Jaull never starts a download or evaluator.
Results -> Evaluate candidates proposes up to three exact GGUFs from the
inspected search pool, not just the displayed top five. Review the selection,
download sizes and omissions, then start sequential diagnostics. This does not
find a general-quality winner or change the recommendation order.
→ CLI quality pilot
Prediction vs observation. compare_prediction puts a MemoryEstimate next to an
ExecutionObservation and reports the signed error under a single convention
(measured − predicted), plus whether the compatibility verdict was a correct
success/failure or a false positive/negative. Where the methodology does not support a
comparison — VRAM attribution, or RAM under GPU offload — it says so explicitly instead of
inventing a number.
→ docs/evidence.md
Two front-ends over the same services. A Typer CLI with stable --json output, and a
Textual TUI that shows the equivalent CLI command for what it just did. Both go through the
same AdvisorService; neither contains business logic.
The TUI opens on a choice between a guided analysis and the individual tools:
Guided mode starts with a hardware scan. Each checklist line turns green when its probe actually returns — there is no fake progress — and the detected profile replaces the checklist in place when the scan finishes:
Then six or seven plain-language questions, depending on the selected task:
The best match leads, with the alternatives compressed to one line each:
From a recommendation you reach its execution paths: the artifact variants and runtimes that could actually run it, each labelled with how much evidence stands behind it — estimated, ready, validated or benchmarked:
Validation runs the plan for real and compares the prediction against the observation:
More screens — search, run history, failure states, the memory estimate view — in docs/ui.md.
Screenshots are regenerated with
uv run python scripts/capture_screenshots.py --size 150x42(headless, no network, no llama.cpp).
The workload contract is available; qualification and capacity measurement are not. The sections below describe the intended direction, not a current verdict.
Jaull can record task separately from interactive or batch mode, plus context, concurrent users and optional input/output lengths, minimum generation throughput and maximum time-to-first-token. These are requested objectives, not measured results or a qualification verdict. The wizard only asks for task and mode; SLOs are optional API data.
Running real load rather than single prompts: concurrency sweeps, throughput and TTFT under load, RAM and VRAM behaviour, degradation curves, and an estimate of the concurrency a machine can actually sustain.
The next planned step is small: one loaded llama.cpp server with 1, 2 and 4 simultaneous users. Loading and warm-up stay separate from request measurements. Multiple model processes would measure a different workload. This experiment is not implemented yet; see the current status.
Turning the accumulated evidence into an explicit verdict:
QUALIFIED
CONDITIONALLY QUALIFIED
NOT QUALIFIED
backed by the experiments and benchmarks that produced it, and by the policy gates it was evaluated against.
A validated configuration should be pinnable to something like a jaull.lock: exact
repository, revision, artifact and SHA-256; runtime, version and backend; context and
runtime parameters; the hardware it was validated on; the measurements obtained; and the
workload it was qualified for — and then exportable as a reproducible deployment.
implemented  hardware → requirements → candidates → prediction → artifact → verification
             → runtime/backend readiness → execution → benchmark → prediction vs observation
             + workload profile and optional SLO data (not measured qualification)

planned      load & capacity experiments → sustainable concurrency
             → deployment qualification → jaull.lock → reproducible deployment
Jaull is a modular Python monolith. There are no workers, no containers and no remote executors — the boundaries exist so those can be added later without a rewrite.
The dependency direction is one-way:
Presentation    cli/ · tui/ · presentation/ · reporting/ · diagnostics/
      ↓
Advisor         advisor/          the single facade both front-ends talk to
      ↓
Application     application/ · workflow/     use cases and guided orchestration
      ↓
Domain / Ports  domain/ · ports/  frozen models, pure heuristics, boundary protocols
      ↑
Adapters        adapters/ and the infrastructure packages, composed by bootstrap/
src/jaull/
├── domain/           # frozen Pydantic models, enums, policies, pure heuristics
├── ports/            # boundary protocols for replaceable infrastructure
├── application/      # use cases: requirements, model references, variant discovery,
│                     #   recommendation service, policies, execution-plan assembly
├── adapters/         # concrete implementations behind the ports (model-analysis cache)
├── bootstrap/        # production composition root (`ServiceContainer`)
├── advisor/          # application facade used by both front-ends
├── hardware/         # CPU/RAM/storage probes, NVML, Vulkan backend detection
├── huggingface/      # Hub client, URL parser, repository classifier, artifact resolver
├── analyzers/        # per-repository-type analyzers behind a Protocol
├── metadata/         # GGUF header reader over HTTP Range, base-model resolver, config merge
├── estimator/        # weights, KV cache, overhead, compatibility, policies
├── discovery/        # Hub search, query building, filtering, enrichment, series grouping
├── recommendation/   # plan assessment, ranking, diversity, tiers, explanations
├── execution_plans/  # logical model identity and pure execution-plan construction
├── workflow/         # guided-run orchestrator, progress/state, per-run cache
├── artifacts/        # artifact resolution, download, storage layout, SHA-256 verification
├── runtime/          # runtime discovery, capability probes, backend selection, runners
├── execution/        # process execution contracts + host backend
├── experiments/      # experiment runner and JSON record store
├── benchmarks/       # benchmark matrix runner and JSON record store
├── evaluation/       # prediction vs observation, and benchmark vs benchmark, comparison
├── observability/    # performance telemetry
├── reporting/        # JSON + Markdown serialisation
├── presentation/     # Rich rendering
├── diagnostics/      # environment, runtime and readiness checks (`doctor`)
├── cli/              # thin Typer commands
└── tui/              # Textual screens and widgets
Recommendation policy, requirements normalisation, budgets and variant discovery live in
application/; telemetry lives in observability/; service construction lives in
bootstrap/. workflow/ contains the guided-run orchestrator, progress and state DTOs, and
the per-run memoisation cache. Old Python import paths for moved modules have been removed.
execution_plans/ is likewise reduced to logical model identity and pure plan construction;
anything that needs recommendation DTOs, search or caching lives in application/.
The boundaries enforced by tests/test_architecture_dependencies.py:
domain/ imports nothing from the layers above it, and no infrastructure library.application/ never imports adapters, presentation, advisor, workflow/ or Hugging Face
clients — it depends on domain models and ports.ports/ never imports adapters or presentation.execution_plans/ never imports workflow/ or recommendation/.recommendation/ never imports workflow/, the advisor or a front-end.presentation/ and TUI screens never import Hugging Face adapters.That test scans imports with ast; its exception list is exact and currently empty. The
complete layer map and additional convention checks live in
ARCHITECTURE.md.
Beyond the import graph:
application/, workflow/, discovery/ and recommendation/ are pure Python — the whole
guided pipeline runs, and is tested, without a terminal.MemoryEstimate), observation (ExecutionObservation) and their comparison
(PredictionComparison) are three separate objects. Measurement never edits a prediction.Protocol, so tests inject fakes.policies.py module.Layer diagram, current package map and dependency rules: ARCHITECTURE.md.
Implemented and covered by tests:
llama-cli; Transformers through an isolated worker in the TUI)llama-bench, Transformers worker) with persisted recordsNot implemented:
jaull.lock)run pathVulkan and ROCm/HIP support is currently experimental: backend detection and runtime readiness are implemented, but AMD hardware validation is still required before treating the results as production-qualified. Vulkan is currently a llama.cpp/GGUF path; it is not presented as a Transformers backend.
Start with STATUS.md for what works and what comes next, or Jaull explained simply for a Spanish introduction. The references below describe the current implementation.
| Document | Contents | Language |
|---|---|---|
| docs/cli.md | Command and option reference | English |
| ARCHITECTURE.md | Current layers, dependency rules, AdvisorService | English |
| docs/estimation.md | Memory model, GGUF enrichment, compatibility | English |
| docs/recommendation.md | Guided mode, discovery, scoring, licenses | English |
| docs/evidence.md | Artifacts, runtimes, execution, experiments, benchmarks | English |
| docs/experimental-validation.md | Reproducible cross-machine validation procedure | English |
| docs/limitations.md | What Jaull deliberately does not do | English |
| docs/ui.md | TUI screen gallery | English |
| docs/llamacpp.md | Building and wiring up llama.cpp | English |
| validation/README.md | Index of retained experimental evidence | English |
| scripts/README.md | Manual script catalogue and effects | English |
TFG material is separate from operating instructions: glossary, development log, and the dated workflow walkthrough and technical audit.
Some documents are in Catalan or Spanish because they belong to the academic project this tool grew out of. Everything written for contributors is in English.
The short version — the full list is in docs/limitations.md:
run,
validation and benchmarking do, and only when you ask for them.run path is limited to single-file GGUF artifacts.sliding_window as the only refinement; MoE,
MLA and multimodal composites return unknown rather than a fabricated number.ASSUMED. Per-block offloading is modelled, but as a runtime-agnostic placement, not as
a measured runtime layer cost — gpu_transformer_blocks is not the same unit as
llama.cpp's --n-gpu-layers.Jaull is under active development and contributions are welcome — bug reports, tests, runtime integrations, benchmark methodology, documentation and UX fixes.
The most valuable thing you can contribute is a run on hardware we do not have. Jaull makes claims about hardware detection, backend availability, runtime compatibility and memory behaviour, and those claims have only been exercised on a narrow set of machines. An AMD, Intel, Apple Silicon or CPU-only report — even one that only says "detection got this wrong" — is directly useful.
See CONTRIBUTING.md for how to set up the environment, run the checks and open a pull request, and SECURITY.md for reporting security issues.
MIT. See LICENSE.
License information reported for models comes from their metadata and is not legal advice. Check a model's license yourself before commercial use.



