
A modern, secure, dashboard-first reverse proxy built in Rust. Single binary, embedded control plane, optional WAF. Powered by Pingora.
Rust
36
744 commits
updated Sep 23, 2026
README

Lorica
A modern, secure, dashboard-first reverse proxy built in Rust





Lorica is a production-ready reverse proxy with a built-in web dashboard, WAF, SLA monitoring, and HTTP caching. One binary, zero external dependencies. Install it, open your browser, and manage everything from the UI - routes, backends, certificates, security rules, and performance metrics. Since 1.7.0 the same binary runs as a fleet: one control plane pushes configuration and certificates to any number of followers over mutual TLS, and their logs, WAF events and audit trails fan back in. Since 1.8.0 a CI pipeline can bind a review app's hostname, backends and certificate in one call on a separate automation listener, and an operator can capture the full exchange for the one request in twenty that fails.
Built on Cloudflare Pingora, the engine that powers a significant portion of Cloudflare's CDN traffic.
Key Features
:shield: Proxy & Routing
- HTTP/HTTPS reverse proxy with host-based and path-prefix routing
- Path rules - ordered sub-path overrides within a route for backends, cache, headers, rate limits, or direct HTTP status responses
- Header-based routing - per-route rules that pick a backend group by request header value (Exact / Prefix / Regex). A/B testing (
X-Version: beta), multi-tenant isolation (X-Tenant: acme), no upstream URL changes - Canary traffic split - send
X%of requests to an alternate backend group with sticky-per-IP deterministic bucketing. Multiple splits per route; weights capped at 100 cumulative - Response body rewriting - ordered search-and-replace rules (literal or regex with capture groups) applied to upstream response bodies. Configurable content-type filter, max body cap, streams verbatim over the cap
- TLS termination via rustls (no OpenSSL dependency)
- SNI-based certificate selection with wildcard domain support (
*.example.com) - Path rewriting (strip/add prefix, regex with capture groups), hostname aliases, HTTP-to-HTTPS redirect
- Catch-all hostname (
_) as last-resort fallback,redirect_tofor domain redirects,return_statusfor direct responses - gRPC-Web bridge - transparently converts HTTP/1.1 gRPC-web requests to HTTP/2 gRPC for upstream backends
- Maintenance mode - per-route 503 with Retry-After header and custom HTML error page
- Custom error pages - configurable HTML for upstream errors (502/504) with
{{status}}and{{message}}placeholders - Configurable proxy headers, per-route timeouts, WebSocket passthrough, X-Forwarded-Proto via TLS session detection
- Connection pooling with health-aware backend filtering
:lock: Security
- WAF engine - 49 OWASP CRS-inspired rules (SQLi, XSS, path traversal, command injection, SSRF, Log4Shell, XXE, CRLF). Request bodies are buffered only when the engine can actually parse them, decided on the declared
Content-Typebefore the first chunk (v1.7.2), so a route fronting multi-gigabyte uploads keeps the WAF armed instead of choosing between the two. Since v1.8.0 the scan window is per route (waf_body_scan_max_bytes, 4 KiB to 64 MiB) under a node-wide in-flight budget that fails open, because a shared budget failing closed would be a 413 any client could hand to everyone else. Seedocs/security.md - AI / LLM crawler deny-list (v1.6.0) - curated registry of AI crawler User-Agents with per-vendor verification (forward-confirmed rDNS, published IP ranges, or UA-only), per-route policy (off / deny / log), auto-served
/robots.txtadvertising the active deny-list, spoofed-UA fallback policy, custom crawler rules,lorica_ai_bot_totalcounter. Seedocs/ai-crawlers.md - Tamper-evident audit log (v1.6.0) - every state-mutating management call records operator, role, action, target, source IP, user agent and before/after payload hashes in a SHA-256 hash chain;
GET /api/v1/audit/verifywalks the chain and localises tampering to the earliest broken row; day-based retention is chain-safe. In a fleet (v1.7.0) every follower's trail fans in to the control plane as its own chain, verified separately - Per-recipient replication (v1.8.0) - a follower receives only the routes it serves: the control plane resolves
node_selectoritself, against the node id the recipient's certificate proves, so a compromised edge no longer discloses the fleet's routing topology (every other node's upstream addresses, IP lists, mTLS configuration and Basic-auth hashes). Drift is judged against a per-node hash while the generation stays fleet-wide; the wire format did not move, so a mixed-version fleet upgrades in the documented order - Management plane over TLS (v1.6.0) - the loopback dashboard/API is served over HTTPS with a self-signed certificate generated on first boot (or an operator-supplied one), so the session cookie is
Secure;/metricsrequires a session or the bearer token inprometheus_scrape_tokenby default since v1.7.0 - Secrets never on argv (v1.7.0) - every management CLI command (
unban,upgrade,cluster token|leave|status|break-glass,automation token create) reads its password from--password-file,--password-stdinorLORICA_ADMIN_PASSWORD, and a join token only from a file, stdin orLORICA_JOIN_TOKEN - mTLS client verification - per-route CA bundle + optional organization allowlist. Chain validated at the TLS handshake (rustls
WebPkiClientVerifier), per-route enforcement returns 496 ("cert required") or 495 ("cert error").requiredand org-allowlist hot-reload; CA edits take effect on restart - Forward authentication - per-route sub-request to Authelia / Authentik / Keycloak / oauth2-proxy before proxying; 2xx injects response headers into upstream, 401/403/3xx forwarded verbatim to the client, timeout = fail-closed 503. Optional opt-in verdict cache (TTL-capped at 60s, Cookie-keyed) to shortcut hot paths. Under
--workers Nthe cache is owned by the supervisor and routed through the pipelined RPC channel, so an Allow verdict cached by one worker is served from every worker, and a session revocation invalidates the cache uniformly (WPAR-2, design § 7) - Connection pre-filter - global IP allow/deny CIDR policy enforced at TCP accept, before the TLS handshake. Deny always wins; non-empty allow switches to default-deny. Hot-reloaded via arc-swap in single-process and worker modes
- IP blocklist - auto-fetched from Data-Shield IPv4 Blocklist (~80,000 entries, O(1) lookup, updated every 6h)
- Rate limiting - per-route, per-client-IP with configurable RPS and burst tolerance (legacy event-rate estimator
rate_limit_rps/rate_limit_burst) - Per-route token-bucket limiter - exact-semantic admission control via
rate_limit: { capacity, refill_per_sec, scope }. Runs ahead of mTLS / forward-auth / WAF so abusive clients are rejected cheaply with429 Too Many Requests+Retry-After.scope: per_ipisolates individual clients;scope: per_routecaps aggregate traffic to a fragile origin. Cross-worker under--workers N: each worker's CAS-basedLocalBucketcache syncs every 100 ms with the supervisor's authoritative state over a dedicated pipelined RPC channel. Aggregate bound:capacity + 100 ms × N_workers × refill_per_sec(documented indocs/architecture/worker-shared-state.md§ 6) - Auto-ban - IPs that repeatedly exceed rate limits (or trip the WAF) are banned automatically (configurable threshold and duration). Under
--workers N, the WAF auto-ban counter lives in an anonymousmemfdshared by all workers (no UDS round-trip per block), and the supervisor is the sole ban issuer, broadcastingBanIpon threshold crossing - Trusted proxies - CIDR list for X-Forwarded-For validation, prevents IP spoofing via header injection
- DDoS protection - per-route max connections, global flood rate tracking
- Slowloris detection - rejects slow-header attacks with configurable threshold
- Security headers - presets (strict/moderate/none) with HSTS, CSP, X-Frame-Options, X-Content-Type-Options
- HTTP Basic Auth - per-route username/password authentication (Argon2id-hashed) with cached verification
- IP allowlist/denylist and CORS configuration per route
- Certificate export (v1.5.0, disabled by default) - mirror issued certificates as PEM files under
/var/lib/lorica/exported-certs/<hostname>/{cert,chain,fullchain,privkey}.pemevery time a cert is issued or renewed. Lets Ansible / HAProxy sidecar / backup jobs read the live bundle straight off disk without hitting the HTTP API. Atomic writes (.tmpstage +fsync+rename, cross-mountEXDEVfallback), per-filechmod+chownwith configurable owner UID / group GID / octal modes (defaults 0o640 files / 0o750 dirs), fail-soft (export error never blocks the ACME renewal). Per-pattern ACL table narrows which hostnames are exported and with which UID / GID (exact match, leading*.wildcard, or bare*). Audit-logged + rate-limitedGET /api/v1/certificates/{id}/downloadcomplements on-disk export for one-off downloads. Threat model:docs/security/cert-export-threat-model.md
:bar_chart: Monitoring & Observability
-
Passive SLA - per-route uptime, latency percentiles (p50/p95/p99), rolling windows (1h/24h/7d/30d)
-
Active SLA - synthetic HTTP probes at configurable intervals, detects outages during low-traffic periods
-
Prometheus metrics -
/metricsendpoint with request counts, latency histograms, backend health, WAF events, cert expiry. Per-feature counters for cache-predictor bypass, header-rule matches, canary split selection, mirror outcomes (spawned / dropped / errored), forward-auth verdict cache hit rate - all bounded by route count. Under--workers Nevery scrape triggers a pull-on-scrape fan-out over the pipelined RPC channel so per-worker counters are sub-second fresh; concurrent scrapes dedup into a single fan-out and stuck workers fall back to cached state within a 500 ms per-worker timeout (WPAR-7) -
Request mirroring (shadow testing) - duplicate every request to one or more secondary backends (deterministic per
X-Request-Idsampling, 256-slot concurrency cap, body mirroring up to a configurable cap). Fire-and-forget: mirror failure can never impact the primary -
Real-time access logs - WebSocket streaming to the dashboard with filtering
-
Load testing - built-in load test engine with SSE streaming, cron scheduling, CPU circuit breaker, and result comparison
-
SLA breach alerts - automatic notifications when SLA drops below target
-
Request capture (v1.8.0) - per-route rules that keep the full request and response for a subset of traffic, evaluated in two phases: request-side predicates (source CIDR, method, path prefix / regex, headers) decide which requests are buffered as they stream through, response-side predicates (status, latency, upstream error) decide which buffered exchange becomes a record, so the 502 one client in twenty gets is kept with the body that caused it. Every rule carries a hard expiry, a total and a per-minute budget, capped bodies and a node-wide in-flight ceiling; credential headers and named query parameters are redacted and no rule can turn that off. A record joins the access-log row on
request_idand reaches the process log, the last-50 ring behind the Capture page, the syslog / OTLP sinks and optionally a per-rule directory; a sink that stalls loses records, never latency. Arming a rule is SuperAdmin, stopping one is Operator.lorica_capture_rules_active,lorica_captures_total{rule_id,outcome},lorica_capture_inflight_bytes. Seedocs/capture.md -
Syslog export (v1.7.0) - ship access logs, WAF events, audit entries and, since v1.8.0, capture records to an existing SIEM as RFC 5424 messages over UDP, TCP (RFC 6587 octet-counting framing) or TCP+TLS (optional mutual TLS towards the collector). Configurable facility, per-event-kind severity mapping, per-kind toggles, and static structured-data parameters (
env=prod,dc=eu-west). Fire-and-forget with a bounded queue: an unreachable collector sheds export rows (lorica_log_sink_dropped_total) and never affects request serving -
OTLP logs export (v1.7.0, needs a build with
--features otel) - the same event kinds, each behind its own switch since v1.8.0, as OTLP log records to the OpenTelemetry collector already configured for tracing, withtrace_id/span_idattached from the request's span context so a log record joins its trace in Grafana / Tempo / Loki-style backends. OptionalAuthorizationheader for authenticated collectors (HTTP transports)Worked examples: SIEM (syslog) and OTLP collector
Syslog towards an rsyslog / SIEM ingest listening in TCP on 6514 with TLS: set Settings → Log export to endpoint
siem.example.com:6514, transporttcp-tls, facility 16 (local0), keep the default severities (access=info, waf=warning, audit=notice), paste the collector CA if it is private. Matching rsyslog receiver:module(load="imtcp" StreamDriver.Name="gtls" StreamDriver.Mode="1") input(type="imtcp" port="6514") template(name="lorica" type="string" string="/var/log/lorica/%APP-NAME%-%$YEAR%%$MONTH%%$DAY%.log") if $app-name == "lorica" then action(type="omfile" dynaFile="lorica")OTLP logs towards an OpenTelemetry collector: enable OTLP logs in the same tab (the collector endpoint and protocol come from the Observability tab). Minimal collector pipeline:
receivers:
  otlp:
    protocols:
      http:
exporters:
  file:
    path: /var/log/otel/lorica-logs.json
service:
  pipelines:
    logs:
      receivers: [otlp]
      exporters: [file]
Both sinks hot-reload on save (no restart) and each has a per-sink test button reporting success, failure reason and round-trip time.
Capacity note: sinks are per-process by design (mode-independent, no cross-process queue). Under
--workers autoan N-core node holds N worker connections plus one supervisor connection to the same collector, each with its own bounded queue - size collector connection limits forcores, not1, per node. Ordering across processes is the collector's concern.
:globe_with_meridians: Management
- Multi-node cluster (v1.7.0) - one control plane, any number of followers over mutual TLS with a fleet CA; short-lived join tokens bound to a node name, explicit activation, two-phase configuration replication with per-node route targeting, fleet-wide certificate issuance with need-to-know key distribution, and access logs / WAF events / bans / audit trail aggregated per node with one verifiable hash chain each. Followers are read-only with an audited break-glass window. See
docs/cluster.md - CI automation API (v1.8.0) - a second listener,
--automation-listen, off by default, so a pipeline can configure Lorica while the management API stays on loopback. A source-CIDR allowlist (automation_allowed_cidrs, mandatory) is enforced at TCP accept before the TLS handshake, followed by the cluster plane's pre-authentication budgets; requests authenticate withAuthorization: Beareronly, there is no session, cookie or CSRF path, and every one is audited. Tokens are scoped (environments:write,environments:read,routes:read,certificates:read), bound to hostname patterns and backend CIDRs, minted once on the management plane (never through the listener) and stored as an HMAC. One idempotentPUT /automation/v1/environments/{name}creates or replaces a route, its backends and a covering certificate in a single transaction and answers with the public URL; a TTL capped by the token and a reaper remove what the pipeline forgot, and the routes and backends it owns are read-only in the dashboard. Runs on a standalone node or the control plane, never on a follower. Optional GitLab OIDC mode (Story 10.5): the job's own ID token, RS256 with a pinned issuer and audience, bound claims on project, ref and environment, and replay protection, replaces the shared secret in CI variables. Seedocs/automation.md - Multi-user RBAC (v1.6.0) - team accounts with three roles:
super_admin(users, settings, config import, upgrades, fleet mutations),operator(full CRUD on routes, backends, certificates, WAF, SLA, probes, load tests, cache, bans; fleet reads) andviewer(read-only, secrets masked, fleet views hidden). Any role change, disable or password reset ends the target's sessions at once - Web dashboard - Svelte 5 UI (~59 KB) embedded in the binary: routes, backends, certs, WAF, SLA, load tests, capture, cluster, team, settings
- REST API - full CRUD for all entities, session-based auth, rate-limited login, a single fail-closed authorization middleware, OpenAPI description in
lorica-api/openapi.yaml; the automation plane has its own,lorica-api/openapi-automation.yaml, because it is a different socket with a different credential - TOML config export/import - with diff preview before applying changes
- Nginx config import - paste an
nginx.confto auto-create routes, backends, certificates, and path rules with cert import support - ACME / Let's Encrypt - automatic TLS provisioning via HTTP-01 and DNS-01 challenges (Cloudflare, Route53, OVH providers), multi-domain SAN and wildcard support, smart auto-renewal, OCSP stapling
- DNS providers - global DNS credentials configured once in Settings and referenced by ID for certificate provisioning (Cloudflare, Route53, OVH)
- Notification channels - stdout, SMTP email, HTTP webhook, Slack with per-channel rate limiting
- Ban list management - view and unban auto-banned IPs from the dashboard
:zap: Performance
- Pingora engine - forked from Cloudflare's production proxy framework
- HTTP cache - in-memory response caching with LRU eviction (128 MiB cap), TinyUFO algorithm, cache lock (thundering herd protection), stale-while-revalidate with background refresh (serves stale immediately, fetches fresh in parallel) and stale-if-error, HTTP PURGE method support
- Cache Vary - per-route
cache_vary_headerspartitions the cache by request-header values (e.g.Accept-Encoding) merged with the origin'sVaryresponse;Vary: *anchors on URI to bound cardinality - Cache predictor - 16-shard LRU (32K keys) remembers deterministically-uncacheable responses and short-circuits the cache state machine on subsequent hits, avoiding cache-lock contention on known-bypass traffic
- Peak EWMA load balancing - latency-aware backend selection alongside Round Robin, Consistent Hash, Random, Least Connections
- DashMap - lock-free concurrent reads for ban list and route connections in the hot path
- Sub-0.5ms WAF evaluation - precompiled regex patterns with zero overhead when disabled
:package: Reliability
- Worker process isolation - fork+exec with socket passing via SCM_RIGHTS
- Protobuf command channel - supervisor-to-worker config reload without traffic interruption. Under
--workers N, reloads run as two-phase Prepare + Commit on a pipelined RPC channel so the divergence window between workers collapses to the UDS RTT (microseconds) instead of the per-worker DB-rebuild time (WPAR-8, design § 7). The same RPC plane carries cross-worker circuit-breaker admission (BreakerDecision::AllowProbefor HalfOpen) so probe slots are allocated atomically across workers and a failure on one trips the breaker for every worker (WPAR-3) - Health checks - TCP and HTTP probes, backends marked degraded (>2s) or down and removed from rotation
- Graceful drain - per-backend active connection tracking with Closing/Closed lifecycle states
- Certificate hot-swap - atomic swap via arc-swap, zero downtime during rotation
- Hot binary upgrade (v1.6.0) -
POST /api/v1/system/upgrade,lorica upgrade --binary <path>or the Settings "Binary upgrade" panel replaces the running binary with no dropped connections and no systemd restart: the new binary and its detached Ed25519 signature are verified against an operator-configured public key, the live listening sockets are handed over on a Unix socket, both supervisors accept during the overlap, and a new binary that fails within 10 s is quarantined while the old one resumes. Opt-in until a signing key is configured. Seedocs/hot-upgrade.md - Encrypted storage - AES-256-GCM encryption for certificate private keys at rest
Quick Start
Install from .deb package
# Download the latest release
wget https://github.com/Rwx-G/Lorica/releases/latest/download/lorica.deb
sudo dpkg -i lorica.deb
The package creates a lorica user, installs a systemd service (enabled by default), and starts Lorica on ports 8080 (HTTP), 8443 (HTTPS), and 9443 (dashboard).
To customize ports, workers, or log level, edit the systemd unit:
sudo systemctl edit lorica
[Service]
ExecStart=
ExecStart=/usr/bin/lorica --data-dir /var/lib/lorica \
  --http-port 80 --https-port 443 --management-port 9443 \
  --workers 4 --log-level info
sudo systemctl restart lorica
Run with Docker
Lorica is Linux-only, and its management API (dashboard) binds to 127.0.0.1
inside the container. Publishing the port with -p 9443:9443 therefore
does not expose the dashboard to the host. The simplest fix on Linux is to
share the host network with the container:
docker build -t lorica .
docker run -d --name lorica --network host \
  -v lorica-data:/var/lib/lorica lorica
With --network host the dashboard is reachable at https://127.0.0.1:9443
(TLS with a self-signed certificate generated on first boot - accept the
browser warning) and the proxy listeners bind straight onto the host -
:8080 (HTTP) and :8443 (HTTPS) - so no -p flags are needed.
Get the first-run admin password (printed to stdout once and persisted to a 0600 file inside the container):
docker exec lorica cat /var/lib/lorica/initial-admin-password
# Fallback only if the file write failed (password printed to stdout instead):
docker logs lorica 2>&1 | grep 'Initial admin password:'
Open https://127.0.0.1:9443 in your browser (accept the self-signed
certificate) and log in with admin + the password. You will be prompted
to change it on first login.
Why not
-p 9443:9443? The management server binds127.0.0.1only (seelorica-api/src/server.rs), so port publishing cannot reach it. Use--network hostfor local dev. For a remote server where host networking is not an option, expose the dashboard via an SSH tunnel or Lorica's own self-proxy - see docs/self-proxy-dashboard.md.
Why the management API is loopback-only
The dashboard and REST API bind to 127.0.0.1 by design, not by accident.
That keeps the management plane off the network so it cannot be exposed to the
web, even through misconfiguration. Binding to 0.0.0.0 is explicitly out of
scope - it would weaken this security boundary.
On a production host, reach the dashboard through an SSH tunnel:
ssh -L 9443:127.0.0.1:9443 user@host
Then open https://127.0.0.1:9443 locally (accept the self-signed
certificate). For exposing the dashboard through the proxy itself (not
recommended for production), see
docs/self-proxy-dashboard.md.
Run directly
lorica --data-dir /var/lib/lorica
Open https://127.0.0.1:9443 in your browser (loopback-only by design,
self-signed certificate - use an SSH tunnel on remote hosts; see above). On
first run, a random admin password is written to
<data-dir>/initial-admin-password (mode 0600).
CLI options
lorica [OPTIONS] [COMMAND]

Options:
  --data-dir <PATH>                 Data directory (default: /var/lib/lorica)
  --management-port <PORT>          Dashboard/API port, loopback only (default: 9443)
  --http-port <PORT>                HTTP proxy port (default: 8080)
  --https-port <PORT>               HTTPS proxy port (default: 8443)
  --workers <N|auto>                Worker processes (default: 0 = single-process)
  --upstream-crl-file <PATH>        CRL checked against upstream server certificates
  --log-level <LEVEL>               Log level (default: info)
  --log-format <FORMAT>             Log format: json (default) or text
  --log-file <PATH>                 Log to file (in addition to stdout)
  --cluster-listen <HOST:PORT>      Serve the cluster plane (makes this node a control plane)
  --cluster-enrollment-listen <H:P> Enrollment listener bind (default: next port on the same host)
  --cluster-advertise <HOST>        Name followers dial, the SAN of the control-plane certificate
  --cluster-listen-any              Allow a wildcard host on the two listeners (never by accident)
  --cluster-auto-activate           Enrolled nodes become Active without operator approval (off)
  --automation-listen <HOST:PORT>   Serve the automation API (opt-in; needs a non-empty allowlist, refused on a follower)
  --automation-listen-any           Allow a wildcard host on the automation listener (never by accident)
  --version                         Print version

Commands:
  rotate-key                        Re-encrypt every stored secret under a new master key
  unban <IP>                        Lift a ban through the local management API
  upgrade --binary <PATH>           Hot binary upgrade (signature-verified, zero downtime)
  cluster init                      Generate the fleet CA on this control plane
  cluster token --node-name <NAME>  Mint a join token (SuperAdmin), printed once
  cluster join --control-plane <H:P> --token-file <PATH>
                                    Redeem a token and persist this node's fleet identity
  cluster status                    This node's fleet role and, with credentials, the live roster
  cluster break-glass [--close]     Re-enable local edits on a follower for a bounded window
  cluster leave                     Wipe this node's fleet identity (SuperAdmin, or proof of revocation)
  automation token create --name <NAME> --scope <SCOPE>... --hostname <PATTERN>...
                                    Mint a scoped automation token (SuperAdmin), printed once
Every command that needs the admin password reads it from --password-file
(mode 0600), --password-stdin or LORICA_ADMIN_PASSWORD; --password on
argv only prints a warning. cluster join accepts a token only from a file,
stdin or LORICA_JOIN_TOKEN. automation token create writes the token
alone on standard output (the public_id and expiry go to stderr), so
> /run/secret or a pipe into a secret store captures exactly the
credential; it has no --token flag, the secret is only ever an output.
The global --data-dir goes before the subcommand.
Dashboard
The dashboard ships inside the binary and is served on the management port (default 9443). No separate frontend server, no npm, no build step - just open your browser.
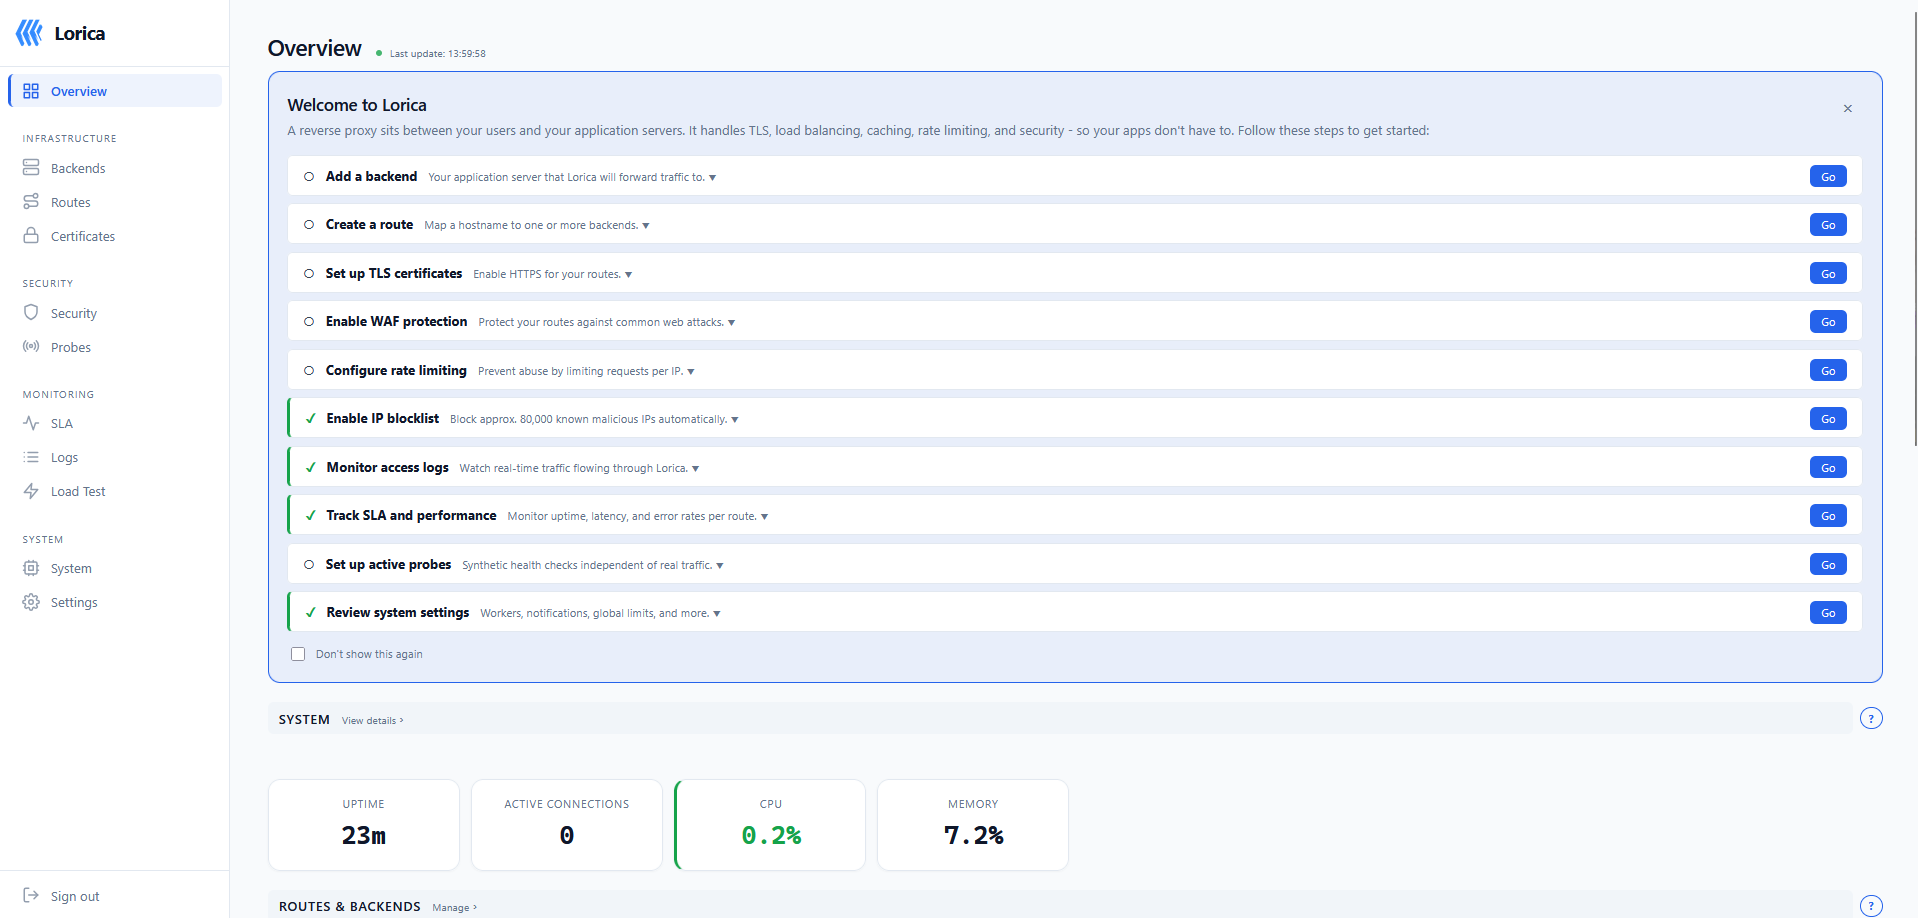
Getting started guide with interactive setup checklist
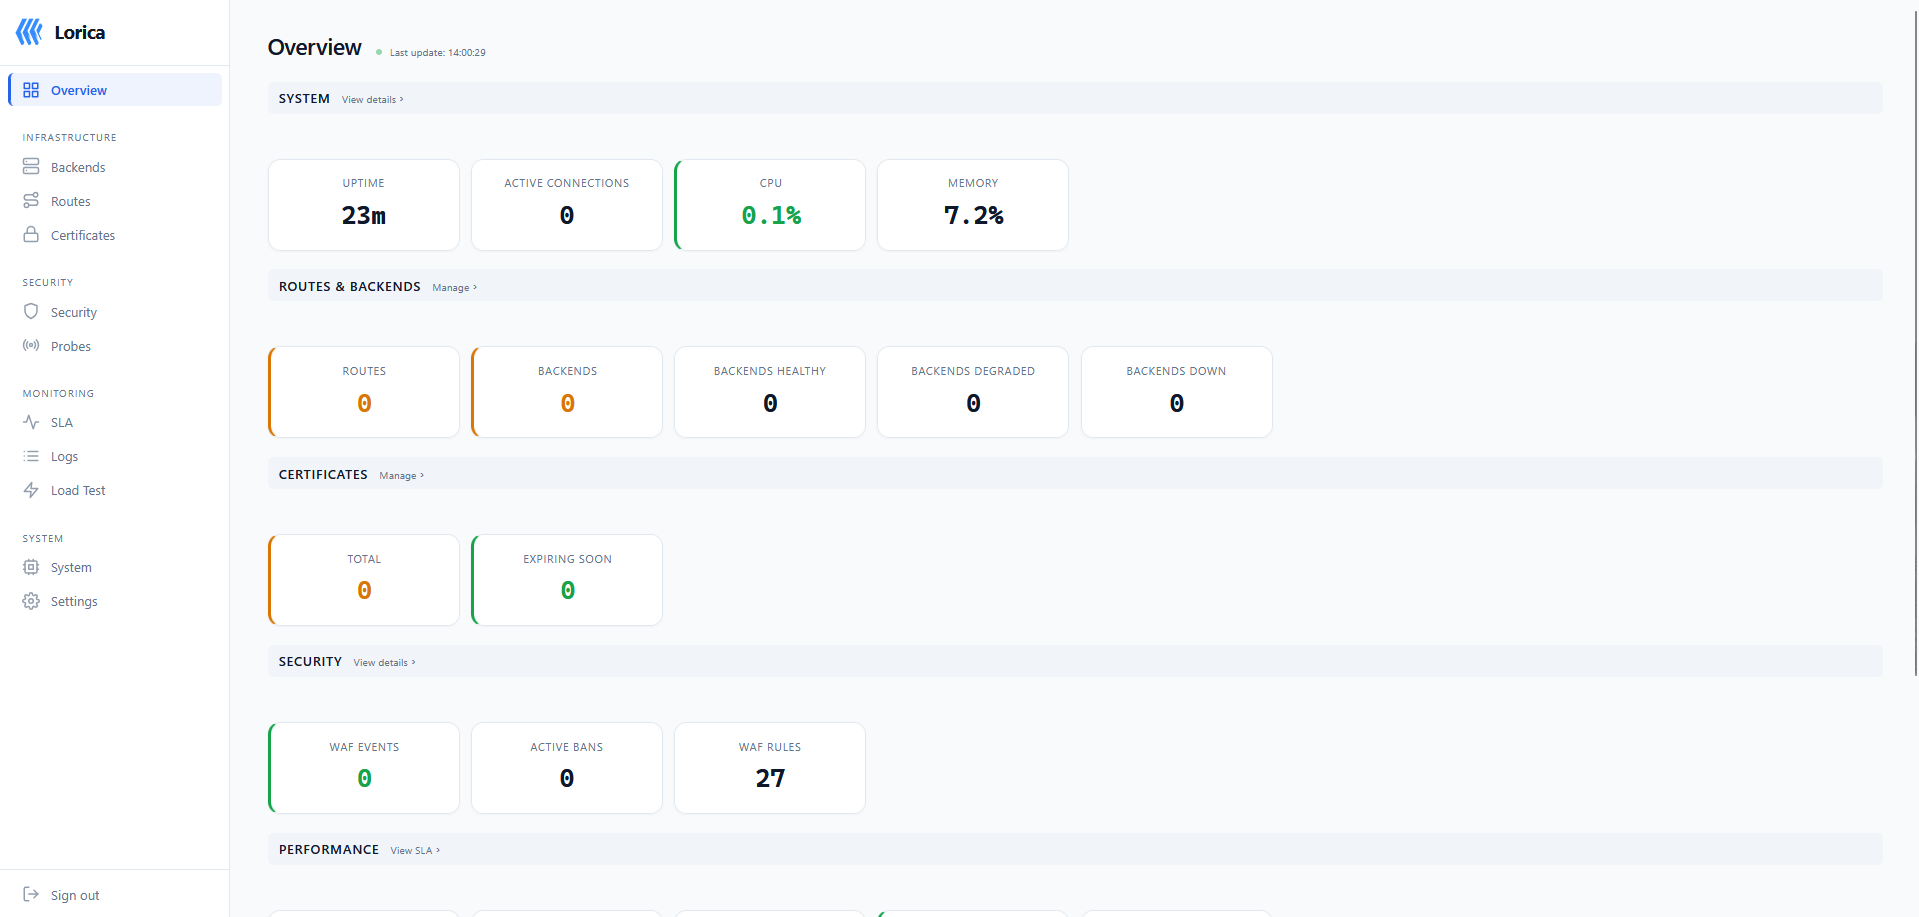
Overview cockpit with system health, routes, security, and performance at a glance
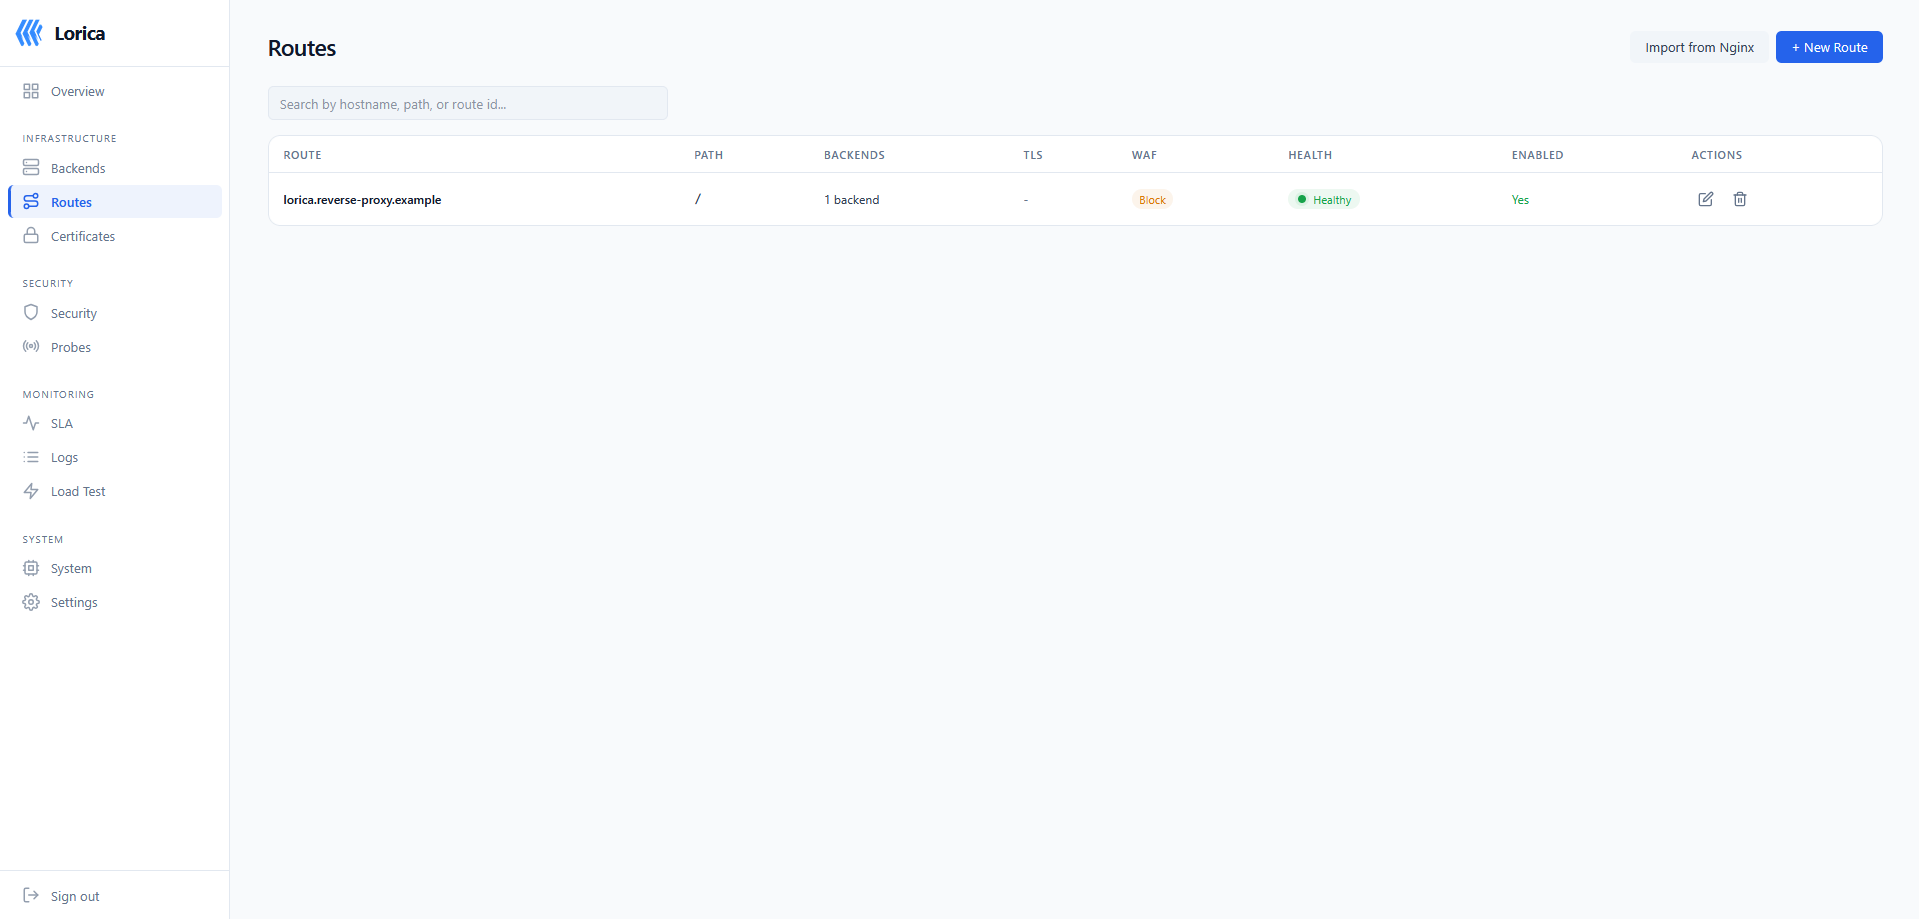
Routes table with hostname, backends, WAF mode, health status, and TLS
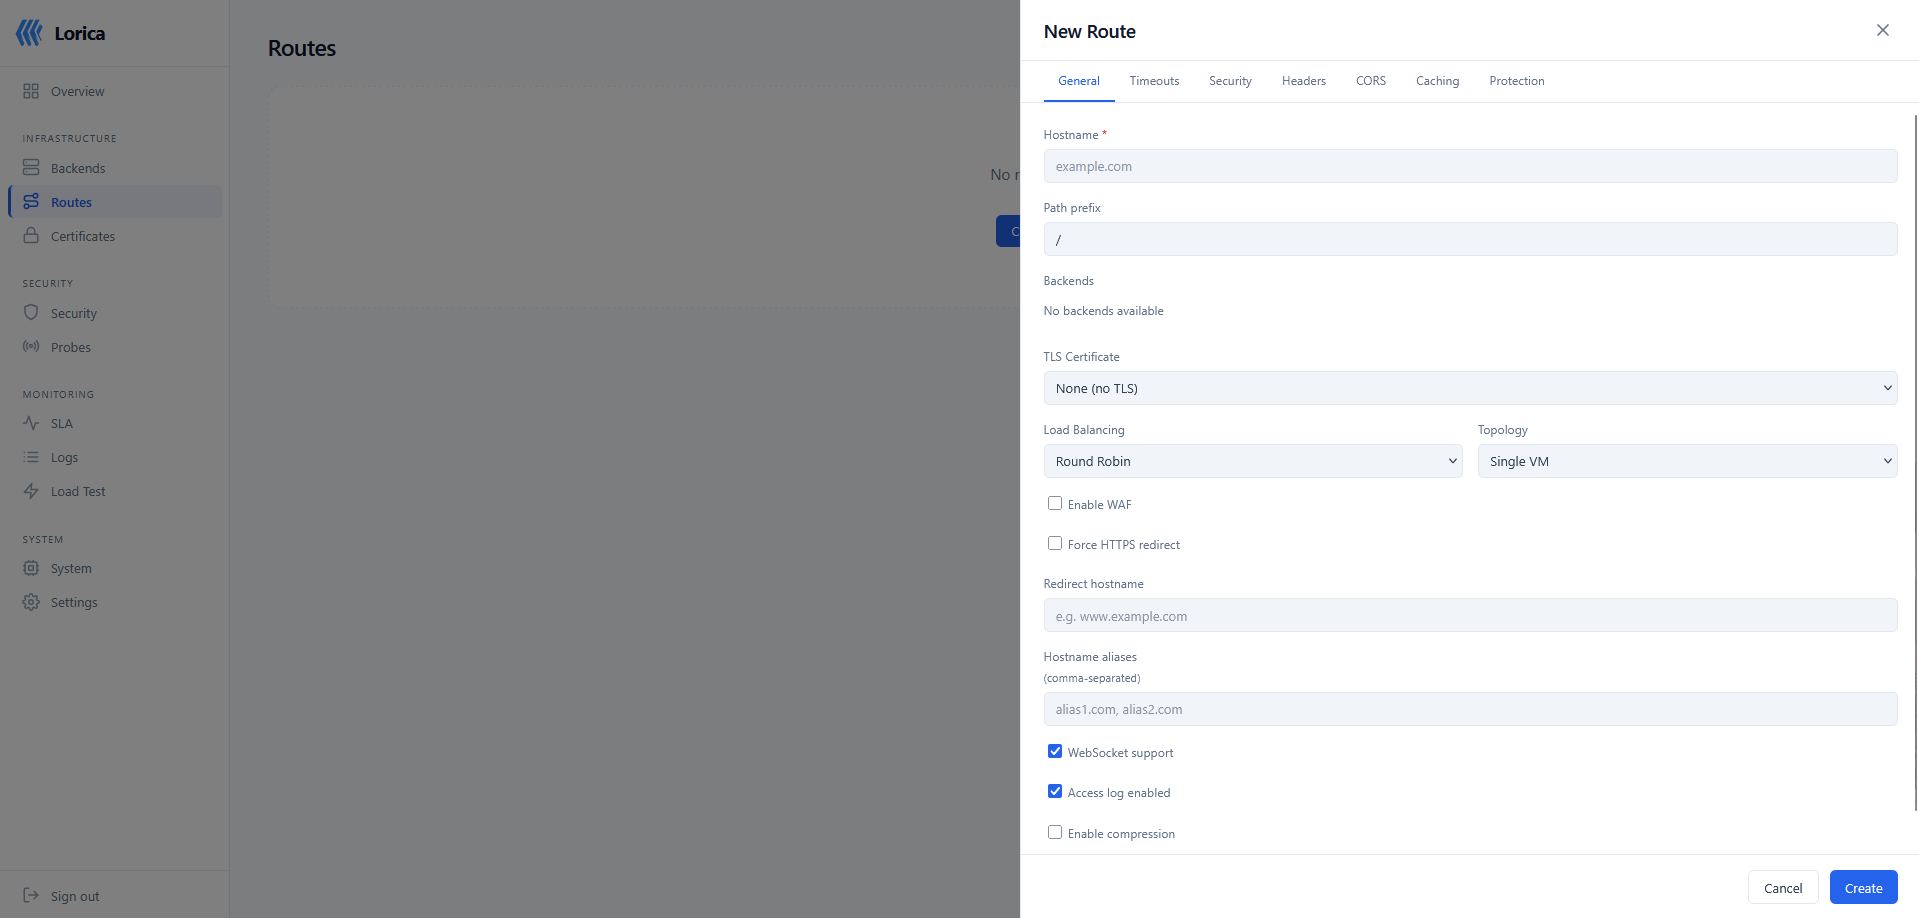
Route editor with 50+ settings across 7 tabs (General, Routing, Transform, Protection, Security, Cache, Upstream)
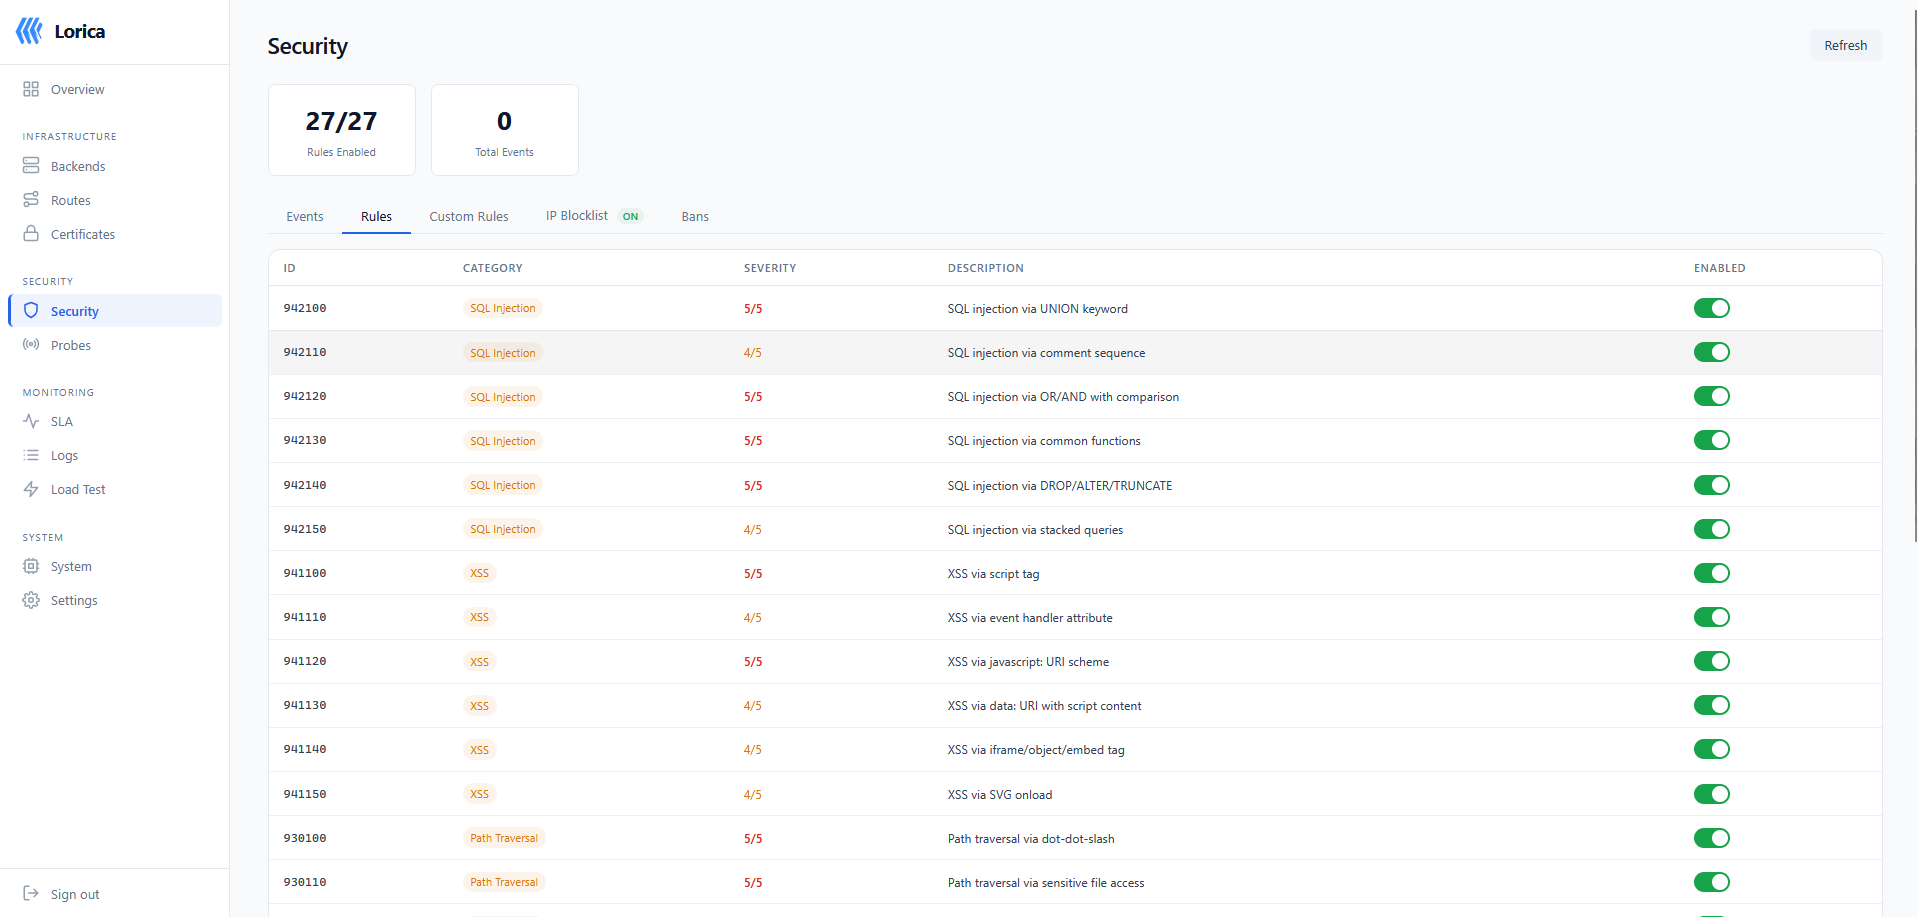
49 WAF rules with per-rule toggle, covering SQLi, XSS, SSRF, Log4Shell, XXE, and more
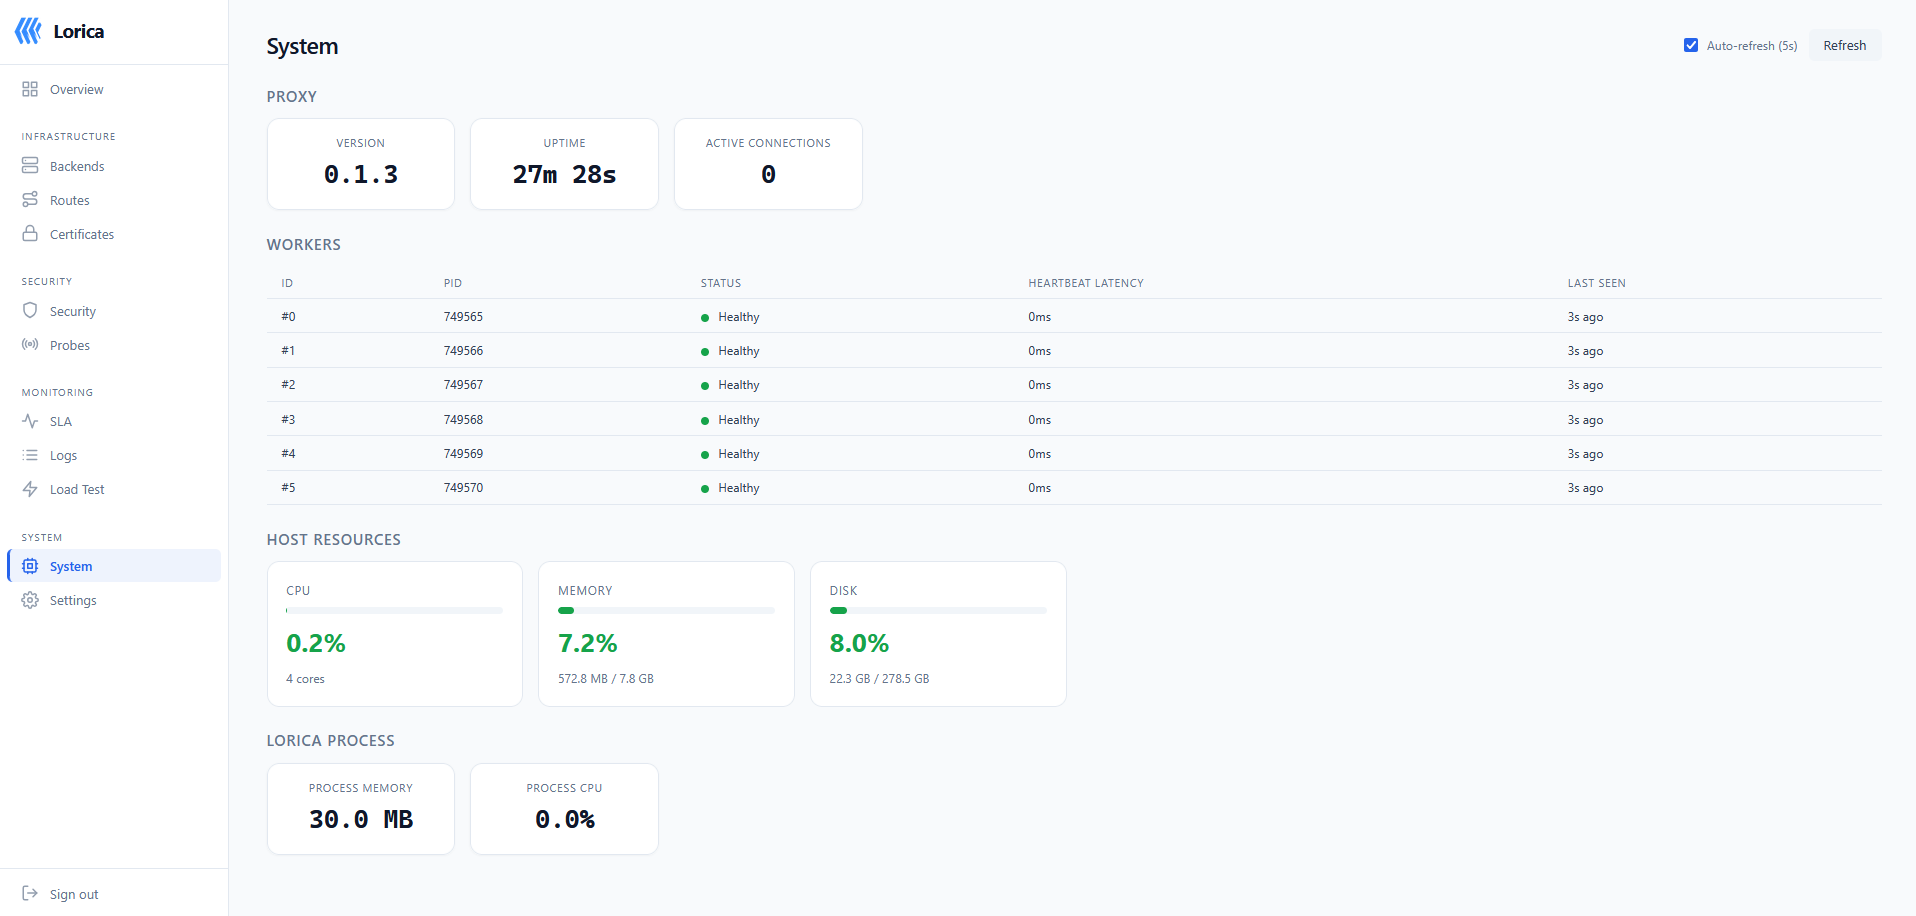
System page with worker health, heartbeat latency, CPU/memory gauges, and process metrics
Pages
- Overview - cockpit dashboard with section helpers, setup checklist, system/route/security/performance cards
- Routes - create/edit routes with host matching, path prefixes, load balancing, WAF mode, rate limits, caching, timeouts, security headers, CORS, and 25 other per-route settings; a route the automation API owns carries an
automationbadge naming its environment and opens read-only, with a hint to update it through the pipeline - Backends - manage backend addresses, weights, health check type (TCP/HTTP), TLS upstream, active connections; automation-owned backends carry the same badge
- Certificates - upload PEM certificates, view expiry dates, provision via ACME/Let's Encrypt (HTTP-01, DNS-01)
- Security - WAF event table with category filtering, 49 rule toggles, IP ban list with unban button, admin audit log with chain verification; on a control plane every tab carries a node filter over the fleet's events, bans and audit chains
- SLA - per-route passive/active SLA side-by-side, latency percentile tables, config editor, CSV/JSON export; on a control plane a node picker shows one follower's own figures (never a fleet aggregate: a fleet percentile is not a function of per-node percentiles)
- Load Tests - test config management with clone, one-click execution, real-time SSE progress panel, historical results
- Active Probes - CRUD for synthetic health probes with route selection, HTTP method/path/status/interval/timeout
- Access Logs - scrollable real-time log stream via WebSocket with green pulsing indicator; on a control plane, the fleet's access logs with a node column and filter
- Capture (v1.8.0) - the rule list with live counters, remaining budget and time to expiry, Disable for Operators, Create / Edit / Delete for SuperAdmins (the form refuses a rule that would record every request on a route unless the operator says so, and shows the expiry the TTL produces as they type), and a "Recent captures" panel over the last 50 records this process emitted, with a whole-record download
- Cluster (v1.7.0) - the fleet roster with live sessions, applied configuration generation, resource gauges, per-node certificate entitlement and recent WAF events, join-token dialog with the ready-to-paste
cluster joincommand, activation and revocation (which names the keys to re-issue); on a follower, the read-only banner with break-glass and leave - System - worker table with PID, health, heartbeat latency; CPU/memory/disk gauges
- Settings - notification channels, security header presets, DNS providers (Cloudflare / Route53 / OVH), ban rules, network allow / deny lists and the automation listener's allowed CIDRs, OpenTelemetry exporter, log export (syslog and OTLP logs, one switch per event kind on each sink, per-sink test), GeoIP / ASN databases, AI crawler policy, team (users and roles), automation tokens (scopes, hostname patterns, backend CIDRs, lifetimes; the token is shown once, revocation keeps the row), binary upgrade, certificate filesystem export zone + ACL editor, config export / import with diff preview
- Theme - light/dark mode toggle
Architecture
Lorica is a Rust workspace with 31 crates: 16 forked from Cloudflare Pingora and 15 product crates. See FORK.md for the full fork lineage and renaming rules.
| Crate | Purpose |
|---|---|
lorica | CLI binary, supervisor, worker orchestration |
lorica-proxy | HTTP/HTTPS proxy engine (Pingora fork) |
lorica-tls | SNI certificate resolver, hot-swap, encrypted key storage |
lorica-acme | Pure ACME core: HTTP-01 / DNS-01 issuance driver, DNS challengers (Cloudflare / Route53 / OVH) |
lorica-config | SQLite store, versioned migrations, TOML export/import |
lorica-api | axum REST API, auth, session management, RBAC, the automation listener and its scope gate |
lorica-dashboard | Svelte 5 frontend embedded via rust-embed |
lorica-waf | WAF engine, OWASP rules, IP blocklist |
lorica-notify | Alert dispatch (stdout, SMTP, webhook, Slack) |
lorica-bench | SLA monitoring, load testing engine |
lorica-metrics | Shared Prometheus registry + cross-worker counter aggregation |
lorica-worker | fork+exec worker isolation, typed FD passing (Listener / Shmem / Rpc) |
lorica-command | Protobuf supervisor-worker command channel + pipelined RpcEndpoint (Envelope framing, in-flight demux, bounded backpressure), Coalescer, GenerationGate |
lorica-shmem | Anonymous memfd region shared across all workers; AtomicHashTable for per-IP WAF flood / auto-ban counters; SipHash-1-3 anti-HashDoS; 5-min eviction walker |
lorica-cluster | Cluster plane (v1.7.0): mutual-TLS transport on the same RpcEndpoint as the worker channel, fleet CA, join tokens, enrollment and operational listeners, roster and session registry, two-phase replication, telemetry ingest quota; configuration-blind by design (the blob is opaque bytes to it) |
lorica-geoip | GeoIP / ASN lookups (MaxMind-format databases) for country and network policy |
lorica-challenge | Bot challenges: proof-of-work, image captcha (vendored renderer), cookie issuance |
lorica-lb | Load balancing (Round Robin, Peak EWMA, Hash, Random, Least Conn) |
lorica-cache | HTTP response cache, LRU eviction |
lorica-limits | Rate estimator + per-route LocalBucket / AuthoritativeBucket token-bucket primitives (lock-free CAS, 100 ms cross-worker sync) |
Data plane (proxy) and control plane (API/dashboard) are fully separated. API mutations trigger config reload via arc-swap - the proxy picks up changes without restarting.
Performance
Measured on a single Linux VM (4 vCPU, 8 GB RAM):
| Metric | Value |
|---|---|
| Single-process throughput | ~6,500 req/s |
| Multi-worker throughput (4 workers) | ~25,000 req/s |
| WAF evaluation latency | < 0.5 ms per request |
| WAF overhead on throughput | ~6% |
| Dashboard bundle size | ~59 KB (gzipped) |
| Config reload | Zero-downtime (arc-swap) |
| Certificate hot-swap | Zero-downtime (atomic) |
Configuration Example
Create a route via the REST API:
# Authenticate
TOKEN=$(curl -sk https://127.0.0.1:9443/api/v1/auth/login \
  -H 'Content-Type: application/json' \
  -d '{"username":"admin","password":"your-admin-password"}' \
  -c - | grep lorica_session | awk '{print $NF}')

# Create a backend
curl -sk https://127.0.0.1:9443/api/v1/backends \
  -b "lorica_session=$TOKEN" \
  -H 'Content-Type: application/json' \
  -d '{
    "address": "127.0.0.1:8080",
    "health_check_interval_s": 10,
    "health_check_type": "http",
    "health_check_path": "/healthz"
  }'

# Create a route (ids are server-assigned UUIDs returned by the creates above)
curl -sk https://127.0.0.1:9443/api/v1/routes \
  -b "lorica_session=$TOKEN" \
  -H 'Content-Type: application/json' \
  -d '{
    "hostname": "app.example.com",
    "path_prefix": "/",
    "backend_ids": ["<backend-uuid>"],
    "load_balancing": "peak_ewma",
    "tls_enabled": true,
    "certificate_id": "<certificate-uuid>",
    "waf_enabled": true,
    "waf_mode": "block",
    "rate_limit_rps": 100,
    "rate_limit_burst": 50,
    "cache_enabled": true,
    "cache_ttl_s": 300,
    "force_https": true,
    "security_headers": "strict"
  }'
Or just use the dashboard - it covers all the same operations with zero curl.
REST API Reference
All endpoints are served on the management port (default 9443) over HTTPS (a self-signed certificate generated on first boot; loopback only, so curl -k accepts it). Protected endpoints require a session cookie obtained via /api/v1/auth/login.
Public endpoints
| Method | Path | Description |
|---|---|---|
POST | /api/v1/auth/login | Authenticate (returns session cookie) |
POST | /api/v1/auth/logout | Invalidate session |
GET | /metrics | Prometheus metrics. Authenticated by default since 1.7.0: the bearer token in prometheus_scrape_token (or LORICA_PROMETHEUS_SCRAPE_TOKEN), or a session cookie sent as a header (it is scoped to /api, so a browser does not send it here); metrics_require_auth = false restores the open endpoint |
GET | /.well-known/acme-challenge/{token} | ACME HTTP-01 challenge response |
Auth & Users (RBAC)
| Method | Path | Description |
|---|---|---|
GET | /api/v1/auth/me | Current session user and role |
PUT | /api/v1/auth/password | Change own password |
GET | /api/v1/users | List users |
POST | /api/v1/users | Create user (role-scoped) |
PUT | /api/v1/users/{id} | Update user (role, password reset) |
DELETE | /api/v1/users/{id} | Delete user |
Routes
| Method | Path | Description |
|---|---|---|
GET | /api/v1/routes | List all routes |
POST | /api/v1/routes | Create route |
GET | /api/v1/routes/{id} | Get route |
PUT | /api/v1/routes/{id} | Update route |
DELETE | /api/v1/routes/{id} | Delete route |
POST | /api/v1/validate/mtls-pem | Parse a candidate client-CA PEM and return per-cert subjects |
POST | /api/v1/validate/forward-auth | Probe a candidate forward-auth URL (one GET, status + elapsed) |
Backends
| Method | Path | Description |
|---|---|---|
GET | /api/v1/backends | List all backends |
POST | /api/v1/backends | Create backend |
GET | /api/v1/backends/{id} | Get backend |
PUT | /api/v1/backends/{id} | Update backend |
DELETE | /api/v1/backends/{id} | Delete backend |
Certificates
| Method | Path | Description |
|---|---|---|
GET | /api/v1/certificates | List certificates |
POST | /api/v1/certificates | Upload PEM certificate |
POST | /api/v1/certificates/self-signed | Generate self-signed certificate |
GET | /api/v1/certificates/{id} | Get certificate |
GET | /api/v1/certificates/{id}/download?part={cert|key|chain|bundle} | Download PEM material (rate-limited, audit-logged) |
POST | /api/v1/certificates/{id}/renew | Force ACME renewal of a certificate |
PUT | /api/v1/certificates/{id} | Update certificate |
DELETE | /api/v1/certificates/{id} | Delete certificate |
GET | /api/v1/cert-export/acls | List per-pattern cert-export ACLs |
POST | /api/v1/cert-export/acls | Create a cert-export ACL rule |
DELETE | /api/v1/cert-export/acls/{id} | Delete a cert-export ACL rule |
POST | /api/v1/cert-export/reapply | Re-export every certificate to disk |
GET | /api/v1/cert-export/orphans | List per-hostname subdirectories with no matching live cert |
DELETE | /api/v1/cert-export/orphans/{name} | Remove one orphan subdirectory (sanitised + live-cert guard) |
ACME & DNS Providers
| Method | Path | Description |
|---|---|---|
POST | /api/v1/acme/provision | Provision via HTTP-01 |
POST | /api/v1/acme/provision-dns | Provision via DNS-01 |
POST | /api/v1/acme/provision-dns-manual | Start manual DNS-01 flow |
POST | /api/v1/acme/provision-dns-manual/check | Poll DNS propagation for the manual flow |
POST | /api/v1/acme/provision-dns-manual/confirm | Confirm manual DNS-01 |
GET | /api/v1/dns-providers | List DNS provider credentials |
POST | /api/v1/dns-providers | Create a DNS provider credential |
PUT | /api/v1/dns-providers/{id} | Update a DNS provider credential |
DELETE | /api/v1/dns-providers/{id} | Delete a DNS provider credential |
POST | /api/v1/dns-providers/{id}/test | Test a DNS provider credential |
AI Crawlers
| Method | Path | Description |
|---|---|---|
GET | /api/v1/ai-crawlers/builtin | List built-in known-bot signatures |
GET | /api/v1/ai-crawlers/custom | List custom crawler rules |
POST | /api/v1/ai-crawlers/custom | Create a custom crawler rule |
PUT | /api/v1/ai-crawlers/custom/{id} | Update a custom crawler rule |
DELETE | /api/v1/ai-crawlers/custom/{id} | Delete a custom crawler rule |
GET | /api/v1/ai-crawlers/robots-preview | Preview the generated robots.txt |
GET | /api/v1/ai-crawlers/test | Test a User-Agent against the matcher |
GET | /api/v1/ai-crawlers/stats | AI-crawler match counters |
WAF
| Method | Path | Description |
|---|---|---|
GET | /api/v1/waf/events | Recent WAF events (with category filter) |
DELETE | /api/v1/waf/events | Clear WAF events |
GET | /api/v1/waf/stats | WAF statistics |
GET | /api/v1/waf/rules | List WAF rules |
PUT | /api/v1/waf/rules/{id} | Enable/disable rule |
GET | /api/v1/waf/rules/custom | List custom rules |
POST | /api/v1/waf/rules/custom | Create custom rule |
DELETE | /api/v1/waf/rules/custom/{id} | Delete custom rule |
GET | /api/v1/waf/blocklist | Blocklist status |
PUT | /api/v1/waf/blocklist | Enable/disable blocklist |
POST | /api/v1/waf/blocklist/reload | Reload blocklist |
SLA & Probes
| Method | Path | Description |
|---|---|---|
GET | /api/v1/sla/overview | SLA overview for all routes (?node= on a control plane: one follower's own, Operator+) |
GET | /api/v1/sla/routes/{id} | SLA metrics for route (?node= as above) |
GET | /api/v1/sla/routes/{id}/buckets | Time-bucketed SLA data (?node= as above) |
GET | /api/v1/sla/routes/{id}/config | SLA config |
PUT | /api/v1/sla/routes/{id}/config | Update SLA config |
GET | /api/v1/sla/routes/{id}/export | Export SLA data (CSV/JSON) |
GET | /api/v1/sla/routes/{id}/active | Active probe results (?node= as above) |
DELETE | /api/v1/sla/routes/{id}/data | Clear stored SLA data for a route |
GET | /api/v1/probes | List probes |
POST | /api/v1/probes | Create probe |
GET | /api/v1/probes/route/{route_id} | Probes for route |
GET | /api/v1/probes/{id}/history | Probe result history |
PUT | /api/v1/probes/{id} | Update probe |
DELETE | /api/v1/probes/{id} | Delete probe |
Load Testing
| Method | Path | Description |
|---|---|---|
GET | /api/v1/loadtest/configs | List configs |
POST | /api/v1/loadtest/configs | Create config |
PUT | /api/v1/loadtest/configs/{id} | Update config |
DELETE | /api/v1/loadtest/configs/{id} | Delete config |
POST | /api/v1/loadtest/configs/{id}/clone | Clone config |
POST | /api/v1/loadtest/start/{config_id} | Start test (requires confirm) |
POST | /api/v1/loadtest/start/{config_id}/confirm | Confirm and execute |
GET | /api/v1/loadtest/status | Current test status |
GET | /api/v1/loadtest/ws | WebSocket real-time progress |
POST | /api/v1/loadtest/abort | Abort running test |
GET | /api/v1/loadtest/results/{config_id} | Test results |
GET | /api/v1/loadtest/results/{config_id}/compare | Compare runs |
Cache & Bans
| Method | Path | Description |
|---|---|---|
DELETE | /api/v1/cache/routes/{id} | Purge route cache |
GET | /api/v1/cache/stats | Cache hit/miss stats |
GET | /api/v1/bans | List banned IPs |
DELETE | /api/v1/bans/{ip} | Unban IP |
Audit Log
| Method | Path | Description |
|---|---|---|
GET | /api/v1/audit | List admin audit-log entries (Operator+; on a control plane the fleet's trail needs SuperAdmin unless ?node= names this node's own chain) |
GET | /api/v1/audit/verify | Verify the audit-log hash chains, one verdict per node (SuperAdmin) |
Cluster (v1.7.0)
Fleet reads are Operator+, fleet mutations SuperAdmin; every one of them answers 409 on a node that is not a control plane. See docs/cluster.md.
| Method | Path | Description |
|---|---|---|
GET | /api/v1/cluster/status | This node's fleet role, connection state and, on a control plane, the roster summary (Viewer+) |
GET | /api/v1/cluster/nodes | The roster with live session facts, resource gauges and certificate entitlement |
GET | /api/v1/cluster/nodes/{id} | One enrolled node |
POST | /api/v1/cluster/nodes/{id}/activate | Approve a pending node: it receives configuration and keys from then on |
DELETE | /api/v1/cluster/nodes/{id} | Revoke a node (CRL, session ended at once); the answer names the certificates whose key it keeps, to re-issue |
GET / POST | /api/v1/cluster/tokens | List / mint join tokens (bound to a node name, optionally a source CIDR, short-lived) |
DELETE | /api/v1/cluster/tokens/{public_id} | Revoke an unused token |
GET | /api/v1/cluster/replication | The last replication round's report per node |
GET | /api/v1/cluster/drift | Nodes whose applied configuration differs from the current generation |
GET | /api/v1/cluster/logs | The fleet's access logs, cursor-paginated, ?node= / ?route= filters |
GET | /api/v1/cluster/waf-events | The fleet's WAF events, ?node= / ?category= filters |
GET / POST | /api/v1/cluster/bans | Every node's live bans as last reported / issue a fleet-wide ban |
GET / POST / DELETE | /api/v1/cluster/break-glass | On a follower: the window's state / open it for a bounded time / close it (SuperAdmin) |
POST | /api/v1/cluster/leave | On a follower: tell the control plane, wipe the fleet identity (SuperAdmin) |
Capture (v1.8.0)
Arming, editing, reading back and deleting a rule is SuperAdmin (the stored rule spells out what a node records); listing rules, stopping one and reading recent records is Operator+. See docs/capture.md.
| Method | Path | Description |
|---|---|---|
GET | /api/v1/capture/rules | List capture rules with their counters, remaining budget and expiry (Operator+) |
POST | /api/v1/capture/rules | Create a capture rule |
GET | /api/v1/capture/rules/{id} | Get a capture rule |
PUT | /api/v1/capture/rules/{id} | Update a capture rule |
DELETE | /api/v1/capture/rules/{id} | Delete a capture rule |
POST | /api/v1/capture/rules/{id}/disable | Stop a rule (Operator+: the safe direction, for whoever is paged at 3am) |
GET | /api/v1/capture/recent | The last 50 records this process emitted, bodies cut at 4 KiB (Operator+; 503 on a --workers node, naming the sinks that carry them) |
GET | /api/v1/capture/recent/{request_id} | Download one whole record while it is still in the ring (Operator+) |
Automation (v1.8.0)
Token administration lives on the management plane, SuperAdmin and audited; the automation listener serves none of it, so a token can never mint a token. See docs/automation.md.
| Method | Path | Description |
|---|---|---|
GET / POST | /api/v1/automation/tokens | List tokens / mint one (scopes, hostname patterns, backend CIDRs, environment TTL ceiling, lifetime); the full token is returned by the create only, the node keeps its HMAC |
DELETE | /api/v1/automation/tokens/{public_id} | Revoke a token (stamps revoked_at, keeps the row) |
GET / POST | /api/v1/automation/oidc-issuers | List OIDC issuer entries / register one (GitLab instance URL, audience, jwks_url, bound claims, hostname patterns, backend CIDRs, environment TTL ceiling, scopes); SuperAdmin, audited |
DELETE | /api/v1/automation/oidc-issuers/{id} | Remove an issuer entry (a real delete; the next ID token it would have accepted is refused) |
The automation routes answer on --automation-listen, authenticate with Authorization: Bearer <token> only (no cookie, no session), and are gated by scope rather than role. A path with no declared scope is reachable by no token.
| Method | Path | Scope | Description |
|---|---|---|---|
GET | /automation/v1/whoami | environments:read | The token behind this request: name, public_id, scopes |
GET | /automation/v1/environments | environments:read | List environments (?label=, ?hostname=, ?expiring_before=) |
GET | /automation/v1/environments/{name} | environments:read | One environment, with its ETag |
PUT | /automation/v1/environments/{name} | environments:write | Create (201) or replace (200) the route, backends and certificate binding in one transaction; If-Match for a 412 instead of last-writer-wins |
DELETE | /automation/v1/environments/{name} | environments:write | Remove the route, its owned backends and the joins (204, idempotent) |
System & Configuration
| Method | Path | Description |
|---|---|---|
GET | /api/v1/settings | Global settings |
PUT | /api/v1/settings | Update settings (rejects cross-field-inconsistent values with 400) |
GET | /api/v1/settings/schema | Settings field schema (bounds, defaults) |
POST | /api/v1/settings/otel/test | Test the OpenTelemetry exporter connection |
POST | /api/v1/settings/syslog/test | Send a test message over the syslog export sink |
POST | /api/v1/settings/otlp-logs/test | Probe the OTLP collector's logs signal path |
GET | /api/v1/status | System status summary |
GET | /api/v1/system | CPU, memory, disk usage |
POST | /api/v1/system/upgrade | Hot binary upgrade (signature-verified, zero-downtime) |
GET | /api/v1/metrics | The /metrics document behind the dashboard session, for a browser (the session cookie is scoped to /api) |
GET | /api/v1/workers | Worker heartbeat metrics |
GET | /api/v1/logs | Access logs |
DELETE | /api/v1/logs | Clear logs |
GET | /api/v1/logs/export | Export access logs (CSV/JSON) |
GET | /api/v1/logs/ws | WebSocket log stream |
POST | /api/v1/config/export | Export config as TOML |
POST | /api/v1/config/import | Import TOML config |
POST | /api/v1/config/import/preview | Preview import diff |
GET | /api/v1/notifications | List notification configs |
POST | /api/v1/notifications | Create notification config |
PUT | /api/v1/notifications/{id} | Update notification config |
DELETE | /api/v1/notifications/{id} | Delete notification config |
POST | /api/v1/notifications/{id}/test | Test notification channel |
GET | /api/v1/notifications/history | Notification dispatch history |
GET | /api/v1/preferences | List user preferences |
PUT | /api/v1/preferences/{id} | Update preference |
DELETE | /api/v1/preferences/{id} | Delete preference |
Building from Source
# Prerequisites
# - Rust 1.88+
# - Node.js 20+ (Vite 8 minimum, dashboard compilation)
# - Linux (x86_64)

git clone https://github.com/Rwx-G/Lorica.git
cd Lorica
cargo build --release

# Binary is at target/release/lorica
# The Svelte frontend is compiled automatically during cargo build.
Running tests
# Every Rust test in the workspace
cargo test --workspace

# Product crates only (2632 tests, Lorica-native)
cargo test -p lorica-config -p lorica-api -p lorica -p lorica-waf \
           -p lorica-notify -p lorica-bench -p lorica-worker \
           -p lorica-command -p lorica-limits -p lorica-shmem \
           -p lorica-challenge -p lorica-geoip -p lorica-acme \
           -p lorica-metrics -p lorica-cluster -p lorica-dashboard \
           --features otel

# Pingora-forked crates (748 tests)
cargo test -p lorica-core -p lorica-proxy -p lorica-http \
           -p lorica-error -p lorica-tls -p lorica-cache \
           -p lorica-pool -p lorica-runtime -p lorica-timeout \
           -p lorica-lb -p lorica-ketama -p lorica-lru \
           -p lorica-memory-cache -p lorica-header-serde -p TinyUFO

# The cluster crate's integration binaries, including the frozen v1.7.0
# wire corpus (every message's encoding, pinned)
cargo test -p lorica-cluster --tests

# Frontend (480 Vitest cases across 25 files) and its gates
cd lorica-dashboard/frontend && npm run check && npm run lint && npx vitest run
The lorica binary crate carries 19 end-to-end binaries under
lorica/tests/ that drive a real Pingora Server against mock backends
(mTLS, response rewriting, mirroring, forward auth, stale-while-revalidate,
the connection pre-filter, canary and header routing, config reload, rate
limits and their cross-worker sync, the circuit breaker and the RPC
plane). They run as part of cargo test -p lorica.
Docker end-to-end suites
tests-e2e-docker/ spins Lorica up against real backend containers and
drives every profile through the actual network stack. ./run.sh --build
runs them all in sequence; each --skip-<profile> flag drops one.
| Profile | Assertions | What it proves |
|---|---|---|
| base (single-process) | 361 | routing, TLS, WAF, rate limits, cache, SLA, load tests, ACME challenge path, /metrics gated by default |
| workers | 90 | the same under --workers 2: two-phase reload, cross-worker breaker, shmem auto-ban, metrics pull-on-scrape, forward-auth cache |
| cert-export | 39 | PEM disk export, ACL, reapply, orphans |
| ai-bot, ai-bot-workers | 52, 49 | AI crawler verdicts, robots.txt, verified-bot headers, in both modes |
| rbac, rbac-workers | 37, 37 | per-role 403 matrix, user CRUD, session invalidation |
| audit | 17 | the hash chain, tamper localisation, role floors |
| hot-upgrade | 29 | signature verification, socket handover, rollback of a failing binary |
| log-sinks | 23 | RFC 5424 syslog over TCP and OTLP logs, delivered to real collectors |
| acme | 15 | HTTP-01 and manual DNS-01 issuance against the Pebble fixture |
| capture | 163 | two-phase matching from two source addresses, a 10 MiB body truncated at the cap while the upstream still receives all of it, credential headers and named query parameters redacted on every sink, a binary body round-tripping through base64, the per-rule budget and the TTL each self-disabling their rule, the recent-captures ring, and an output.dir that is read-only and then writable |
| capture-workers | 160 + 50 | the same profile under --workers 2, sharing the 163 assertions above behind a flag rather than forking them (three become ranges, because a budget is spent per worker), plus what only worker mode can show: the per-rule budget overshooting its total by at most the worker count, the recent-captures ring answering 503 rather than an empty 200, all four sinks fed from inside a worker, and the counters aggregating across workers on /metrics |
| cluster | 64 | a control plane and two followers (one in workers mode): enrollment, activation, replication, an HTTP-01 order validated through the selected follower, need-to-know key distribution, telemetry and audit fan-in, a load phase at 300 rps per follower, per-node SLA reads, break-glass, revocation |
| automation | 104 | on the same fleet fixture, since the listener belongs to the control plane: the source allowlist refusing a foreign address before the TLS handshake, bearer-only authentication and the scope gate, the idempotent environment PUT with If-Match, hostname and backend-CIDR grants, the TTL reaper, the management API refusing to edit a managed row, GitLab ID tokens against a local issuer fixture with a replayed jti refused, and a follower refusing to open the listener at all |
| cluster restart + revocation | 22 | the same fleet across a process boundary: a follower re-opens its session unaided and keeps its generation, SLA history and served certificate; a restarted control plane reports its policy-state reset, takes its followers back and clears the flag after a round; then revocation, last because it is terminal for a node |
| bot, bot-workers, geoip, rdns, otel, otel-workers | 29, 29, 16, 7, 16, 16 | bot challenges, country policy, rDNS bypass, OTLP traces; run individually with docker compose --profile <name> run --rm <name>-smoke |
The two intentional gaps in the Docker harness are:
- mTLS client-cert handshake (495 / 496 / 200 based on the
presented cert). The e2e container starts without any TLS certs
pre-loaded so the HTTPS listener on port 8443 is never built -
driving
curl --certneeds a staged environment. The config surface (CA PEM validation,required+allowed_organizationshot-reload) is covered. - Connection pre-filter TCP drop (scanner IP refused at
accept()before TLS). The test-runner sits on the same Docker network as Lorica, so any CIDR that would cover a real scanner also covers the runner - asserting the drop from inside would be self-blocking. The config round-trip (valid CIDR accepted, garbage rejected 400) is covered.
Validate both manually on staging when touching the surrounding code paths.
systemd Service
The .deb and .rpm packages install a hardened systemd unit with:
ProtectSystem=strict,PrivateTmp=yes,NoNewPrivileges=yesMemoryDenyWriteExecute=yes,SystemCallFilter=@system-serviceRestrictNamespaces=yes,RestrictSUIDSGID=yes- Runs as dedicated
loricauser withCAP_NET_BIND_SERVICE - Service auto-starts on install and auto-restarts on upgrade
- Data directory (
/var/lib/lorica) preserved across upgrades
Customize the service (e.g. enable workers) via drop-in override:
sudo systemctl edit lorica
[Service]
ExecStart=
ExecStart=/usr/bin/lorica --workers 6
Performance Tuning
See docs/tuning.md for kernel parameters (sysctl), file descriptor limits, worker configuration, cache settings, and a production readiness checklist. Run bench/ for reproducible throughput measurements.
Worker Mode
When running with --workers N >= 1, see docs/worker-mode.md for the operational notes (which settings require a supervisor restart, what changes between single-process and worker mode).
Running a Fleet
One node is the control plane; every other node is a follower that receives
its configuration and certificates from it and fans its logs, WAF events,
bans and audit trail back in. Followers are read-only (a mutation answers
409) until a SuperAdmin opens a bounded, audited break-glass window.
# On the control plane: generate the fleet CA (once, service stopped), then
# serve the cluster plane. On a packaged install the two flags go in the
# systemd drop-in (`sudo systemctl edit lorica`, see "systemd Service" below).
lorica --data-dir /var/lib/lorica cluster init
lorica --data-dir /var/lib/lorica --cluster-listen 10.0.0.10:9444 --cluster-advertise cp.internal.example.org

# Mint a token bound to the node name the route selectors will use
# (or use the join dialog on the dashboard's Cluster page).
lorica cluster token --node-name edge-01 --password-file /root/.lorica-admin

# On the new node, service stopped: redeem it (the token never touches argv), then start.
lorica --data-dir /var/lib/lorica cluster join \
  --control-plane cp.internal.example.org:9444 --name edge-01 --token-file /root/join-token
systemctl start lorica

# Back on the control plane: approve it, from the Cluster page or the API.
# Nothing flows before activation.
curl -sk -b "lorica_session=$TOKEN" -X POST https://127.0.0.1:9443/api/v1/cluster/nodes/<node-id>/activate
Everything after enrollment is day-to-day dashboard work on the control
plane: routes, backends, certificates, WAF and settings are edited there as
on a single node and replicate to the fleet; the Cluster page holds the
roster, activation, revocation, drift, replication reports, fleet bans and
the break-glass switch. Only join, leave, status and break-glass
belong to the node's own CLI, because they must work with the control plane
unreachable.
What every node keeps as its own: listening addresses, data directory, log
sinks' endpoints, export zone and master key. Everything else replicates.
--automation-listen (v1.8.0) belongs on the control plane: a follower
refuses to start with it, since its configuration is replaced at the next
replication round. Upgrade followers before the control plane (a follower whose schema is behind
is refused at the handshake). docs/cluster.md covers the trust model (the
control plane's encryption.key is the fleet's identity root), replication,
key distribution, telemetry fan-in and its measured envelope, the audit
trail, failure modes and how to replace a control plane.
Documentation
- docs/installation.md - packages, first boot, the management plane's TLS certificate
- docs/cluster.md - multi-node operation, end to end
- docs/capture.md - traffic capture: rules, budgets, the record, redaction, sinks
- docs/automation.md - the CI automation API: the listener, tokens and scopes, the environment resource, GitLab pipelines and OIDC
- docs/security.md, docs/security/hardening-guide.md, docs/security/threat-model.md - what is protected, how, and what is not
- docs/worker-mode.md, docs/tuning.md -
--workers, kernel and file-descriptor tuning - docs/hot-upgrade.md, docs/ai-crawlers.md, docs/self-proxy-dashboard.md
- CHANGELOG.md, COMPARISON.md, FORK.md
Package Verification
Release .deb and .rpm packages are GPG-signed. Import the public key to verify:
curl -fsSL https://github.com/Rwx-G/Lorica/raw/main/docs/lorica-signing-key.asc | sudo gpg --dearmor -o /usr/share/keyrings/lorica.gpg
gpg --verify lorica.deb.asc lorica.deb
From v1.7.4 on, the release tag is signed with the same key, so the chain runs from the package back to the commit it was built from. Earlier tags are unsigned; verify those releases by their package signature.
git verify-tag v1.7.4
Roadmap
| Version | Features | Status |
|---|---|---|
| v1.4.0 | OpenTelemetry tracing (OTLP), GeoIP country blocking, Bot protection (PoW / captcha / cookie with 5-category bypass matrix) | Shipped |
| v1.5.0 | Operator-input guard-rails on every field with blur + input inline errors; Route group_name + filter + colored pill; Certificate download API + dashboard split-menu with private-key confirm; Filesystem certificate export zone with per-pattern ACL, Settings tab, operator re-export endpoint, orphan sweep + per-row delete; Path-rule redirect fix ; Security hardening wave: ammonia HTML sanitiser, per-endpoint rate limits on management plane, per-route body-size limits with 1 MiB global default, session cookie rotation on password change, /system response filter, rustls-pemfile → rustls-pki-types migration, rand 0.9 bump, source-error preservation on .map_err chains, WebSocket log-stream backpressure with close-on-slow-client ; Doc coverage pass + #![warn(missing_docs)] on every Lorica-native crate ; ACME unit tests (wiremock on Cloudflare + OVH challengers, is_valid_dns_server shell-filter, pure should_auto_renew predicate) ; verdict_cache test-parallelism race fixed via serial_test | Shipped |
| v1.5.1 + v1.5.2 (audit-closure cycles) | Worker-mode cert hot-reload (cert install / renew now serves new cert across all workers without restart) ; SMTP encryption modes (starttls / tls / none) for the Email notification channel ; security defense-in-depth pass : webhook URL + Slack URL + auth_header scrubbed on JSON GET (matched the v1.5.1 TOML scrub asymmetry), CSV formula injection guard on access-log export, CSP3 directives (frame-ancestors, form-action, base-uri, object-src), per-endpoint rate limits broadened to ~16 mutating endpoints, redirect-policy=none on webhook / OCSP / blocklist clients ; reactor-stall pass : LogStore + enforce_notification_retention off-loaded to spawn_blocking ; reload pass : two-phase + legacy converged through one apply_per_process_resolver_hooks helper, cert-resolver reload serialised, OTel / GeoIP / ASN apply-error counter ; perf : Cow URL decode + itoa status formatting + chrono deferred until WAF match + dashmap fast-path on bot stash + parking_lot::Mutex on hot path + RuleSet::matches prefilter shortcut ; deps : rustls-webpki 0.103.13 (RUSTSEC-2026-0104 + 0099), postcss 8.5.10 (CVE-2026-41305), aws-lc-rs dropped from the lorica-tls crypto stack in favor of ring (the broader binary still pulls aws-lc-rs transitively via the rustls 0.23 default stack in lorica-api), x509-parser 0.18 aligned across lorica-tls / lorica-api ; chore : ~50 magic-number bl() / rl() calls in server.rs lifted to pub const, 3 formatBytes dashboard implementations consolidated into lib/format.ts, 3 docs/security.md drift items fixed (49 WAF rules + ~80k IP blocklist) | Shipped |
| v1.6.0 | AI-crawler (LLM) deny-list as a first-class feature (known-bot User-Agent + rDNS matcher, per-route opt-in / opt-out, Prometheus counter), Hot binary upgrade (zero-downtime restart), Team settings (multiple users, roles, RBAC), TLS management plane, cert-resolver reliability + background OCSP, rate-limit unification, vendored captcha | Shipped |
| v1.7.0 | Multi-node cluster (control plane + followers over mutual TLS, token enrollment with explicit activation, two-phase configuration replication with per-node route targeting, fleet-wide certificate issuance with need-to-know key distribution, telemetry and audit-trail fan-in with one chain per node, fleet dashboard), syslog (RFC 5424) and OTLP logs export, /metrics authenticated by default | Shipped |
| v1.8.0 | Conditional request capture (per-route rules with request-side predicates on source CIDR, path, method and headers, response-side predicates on status and latency, capped request and response bodies, per-rule budgets and TTL, header and query-string redaction, export to the log sinks and a dashboard page) and a CI automation API (a separate listener on its own port, off by default, behind a source-CIDR allowlist and scoped bearer tokens while the management API stays on loopback; an idempotent environment resource that binds a hostname, a backend and a certificate in one atomic apply for review apps, optional GitLab OIDC ID-token authentication). PRD: Epic 10, stories 10.1 to 10.6. | Shipped |
| v1.9.0 | Management MCP server with tiered access: an operator drives Lorica from an MCP client with the authority the task needs and no more. Three tiers (read, config, admin) that are scope sets on the Epic 10 automation tokens rather than a second authorization model, one process per tier with no tool that elevates, and every call in the tamper-evident audit chain marked as an MCP call. Streamable HTTP served as a path on the automation listener rather than a new port, so it inherits that listener's TLS, source-CIDR allowlist and token revocation; stdio for the workstation case. PRD: Epic 11, stories 11.1 to 11.4. | Planned |
| v2.0.0 | HTTP/3 (QUIC), TCP/L4 proxying | Planned |
Backlog (tracking only, blocked on upstream)
rustls-pemfileremoval in thelorica-tlsfork. RUSTSEC-2025-0134 (unmaintained) still shows transitively through our Pingora fork. Native Lorica code migrated torustls-pki-typesin v1.5.0 ; the transitive dep clears once Pingora upstream migrates.rand 0.8removal in forked crates. Native Lorica code bumped torand 0.9in v1.5.0. RUSTSEC-2026-0097 (unsound with custom logger) was cleared in v1.5.8 by bumping the transitive0.8line to0.8.6; removing the0.8line entirely still depends on the upstream forks (lorica-runtime,lorica-limits) and theaxum/tungstenitemajors. Same monitoring as therustls-pemfilerow.
The table above tracks feature milestones; the current release and the patch cycles (v1.5.3+) live in CHANGELOG.md.
See COMPARISON.md for a detailed feature comparison with Nginx, Traefik, HAProxy, Caddy, BunkerWeb, Sozu, and Pingora.
Not Supported
| Feature | Status | Rationale |
|---|---|---|
| HTTP/3 / QUIC | Planned | Waiting for Pingora PR #524 (tokio-quiche integration) to merge upstream |
| io_uring | Not planned | tokio-uring is unmaintained since 2022. epoll via Tokio delivers sufficient performance (40M req/s at Cloudflare scale) |
| Windows / macOS | Not supported | Linux x86_64 only (fork+exec worker model requires Linux) |
| OpenSSL / BoringSSL | Removed | rustls is the sole TLS provider |
License
Apache-2.0 - see LICENSE.
Credits
Built on Pingora by Cloudflare (Apache-2.0). See NOTICE and FORK.md for fork details.
Author: Rwx-G
Contributors


Similar repos


Languages
Rust
82.2%
Svelte
7.6%
Shell
5.5%
TypeScript
4.0%
A modern, secure, dashboard-first reverse proxy built in Rust. Single binary, embedded control plane, optional WAF. Powered by Pingora.
Rust
36
744 commits
updated Sep 23, 2026
README
Lorica
A modern, secure, dashboard-first reverse proxy built in Rust
Lorica is a production-ready reverse proxy with a built-in web dashboard, WAF, SLA monitoring, and HTTP caching. One binary, zero external dependencies. Install it, open your browser, and manage everything from the UI - routes, backends, certificates, security rules, and performance metrics. Since 1.7.0 the same binary runs as a fleet: one control plane pushes configuration and certificates to any number of followers over mutual TLS, and their logs, WAF events and audit trails fan back in. Since 1.8.0 a CI pipeline can bind a review app's hostname, backends and certificate in one call on a separate automation listener, and an operator can capture the full exchange for the one request in twenty that fails.
Built on Cloudflare Pingora, the engine that powers a significant portion of Cloudflare's CDN traffic.
Key Features
:shield: Proxy & Routing
- HTTP/HTTPS reverse proxy with host-based and path-prefix routing
- Path rules - ordered sub-path overrides within a route for backends, cache, headers, rate limits, or direct HTTP status responses
- Header-based routing - per-route rules that pick a backend group by request header value (Exact / Prefix / Regex). A/B testing (
X-Version: beta), multi-tenant isolation (X-Tenant: acme), no upstream URL changes - Canary traffic split - send
X%of requests to an alternate backend group with sticky-per-IP deterministic bucketing. Multiple splits per route; weights capped at 100 cumulative - Response body rewriting - ordered search-and-replace rules (literal or regex with capture groups) applied to upstream response bodies. Configurable content-type filter, max body cap, streams verbatim over the cap
- TLS termination via rustls (no OpenSSL dependency)
- SNI-based certificate selection with wildcard domain support (
*.example.com) - Path rewriting (strip/add prefix, regex with capture groups), hostname aliases, HTTP-to-HTTPS redirect
- Catch-all hostname (
_) as last-resort fallback,redirect_tofor domain redirects,return_statusfor direct responses - gRPC-Web bridge - transparently converts HTTP/1.1 gRPC-web requests to HTTP/2 gRPC for upstream backends
- Maintenance mode - per-route 503 with Retry-After header and custom HTML error page
- Custom error pages - configurable HTML for upstream errors (502/504) with
{{status}}and{{message}}placeholders - Configurable proxy headers, per-route timeouts, WebSocket passthrough, X-Forwarded-Proto via TLS session detection
- Connection pooling with health-aware backend filtering
:lock: Security
- WAF engine - 49 OWASP CRS-inspired rules (SQLi, XSS, path traversal, command injection, SSRF, Log4Shell, XXE, CRLF). Request bodies are buffered only when the engine can actually parse them, decided on the declared
Content-Typebefore the first chunk (v1.7.2), so a route fronting multi-gigabyte uploads keeps the WAF armed instead of choosing between the two. Since v1.8.0 the scan window is per route (waf_body_scan_max_bytes, 4 KiB to 64 MiB) under a node-wide in-flight budget that fails open, because a shared budget failing closed would be a 413 any client could hand to everyone else. Seedocs/security.md - AI / LLM crawler deny-list (v1.6.0) - curated registry of AI crawler User-Agents with per-vendor verification (forward-confirmed rDNS, published IP ranges, or UA-only), per-route policy (off / deny / log), auto-served
/robots.txtadvertising the active deny-list, spoofed-UA fallback policy, custom crawler rules,lorica_ai_bot_totalcounter. Seedocs/ai-crawlers.md - Tamper-evident audit log (v1.6.0) - every state-mutating management call records operator, role, action, target, source IP, user agent and before/after payload hashes in a SHA-256 hash chain;
GET /api/v1/audit/verifywalks the chain and localises tampering to the earliest broken row; day-based retention is chain-safe. In a fleet (v1.7.0) every follower's trail fans in to the control plane as its own chain, verified separately - Per-recipient replication (v1.8.0) - a follower receives only the routes it serves: the control plane resolves
node_selectoritself, against the node id the recipient's certificate proves, so a compromised edge no longer discloses the fleet's routing topology (every other node's upstream addresses, IP lists, mTLS configuration and Basic-auth hashes). Drift is judged against a per-node hash while the generation stays fleet-wide; the wire format did not move, so a mixed-version fleet upgrades in the documented order - Management plane over TLS (v1.6.0) - the loopback dashboard/API is served over HTTPS with a self-signed certificate generated on first boot (or an operator-supplied one), so the session cookie is
Secure;/metricsrequires a session or the bearer token inprometheus_scrape_tokenby default since v1.7.0 - Secrets never on argv (v1.7.0) - every management CLI command (
unban,upgrade,cluster token|leave|status|break-glass,automation token create) reads its password from--password-file,--password-stdinorLORICA_ADMIN_PASSWORD, and a join token only from a file, stdin orLORICA_JOIN_TOKEN - mTLS client verification - per-route CA bundle + optional organization allowlist. Chain validated at the TLS handshake (rustls
WebPkiClientVerifier), per-route enforcement returns 496 ("cert required") or 495 ("cert error").requiredand org-allowlist hot-reload; CA edits take effect on restart - Forward authentication - per-route sub-request to Authelia / Authentik / Keycloak / oauth2-proxy before proxying; 2xx injects response headers into upstream, 401/403/3xx forwarded verbatim to the client, timeout = fail-closed 503. Optional opt-in verdict cache (TTL-capped at 60s, Cookie-keyed) to shortcut hot paths. Under
--workers Nthe cache is owned by the supervisor and routed through the pipelined RPC channel, so an Allow verdict cached by one worker is served from every worker, and a session revocation invalidates the cache uniformly (WPAR-2, design § 7) - Connection pre-filter - global IP allow/deny CIDR policy enforced at TCP accept, before the TLS handshake. Deny always wins; non-empty allow switches to default-deny. Hot-reloaded via arc-swap in single-process and worker modes
- IP blocklist - auto-fetched from Data-Shield IPv4 Blocklist (~80,000 entries, O(1) lookup, updated every 6h)
- Rate limiting - per-route, per-client-IP with configurable RPS and burst tolerance (legacy event-rate estimator
rate_limit_rps/rate_limit_burst) - Per-route token-bucket limiter - exact-semantic admission control via
rate_limit: { capacity, refill_per_sec, scope }. Runs ahead of mTLS / forward-auth / WAF so abusive clients are rejected cheaply with429 Too Many Requests+Retry-After.scope: per_ipisolates individual clients;scope: per_routecaps aggregate traffic to a fragile origin. Cross-worker under--workers N: each worker's CAS-basedLocalBucketcache syncs every 100 ms with the supervisor's authoritative state over a dedicated pipelined RPC channel. Aggregate bound:capacity + 100 ms × N_workers × refill_per_sec(documented indocs/architecture/worker-shared-state.md§ 6) - Auto-ban - IPs that repeatedly exceed rate limits (or trip the WAF) are banned automatically (configurable threshold and duration). Under
--workers N, the WAF auto-ban counter lives in an anonymousmemfdshared by all workers (no UDS round-trip per block), and the supervisor is the sole ban issuer, broadcastingBanIpon threshold crossing - Trusted proxies - CIDR list for X-Forwarded-For validation, prevents IP spoofing via header injection
- DDoS protection - per-route max connections, global flood rate tracking
- Slowloris detection - rejects slow-header attacks with configurable threshold
- Security headers - presets (strict/moderate/none) with HSTS, CSP, X-Frame-Options, X-Content-Type-Options
- HTTP Basic Auth - per-route username/password authentication (Argon2id-hashed) with cached verification
- IP allowlist/denylist and CORS configuration per route
- Certificate export (v1.5.0, disabled by default) - mirror issued certificates as PEM files under
/var/lib/lorica/exported-certs/<hostname>/{cert,chain,fullchain,privkey}.pemevery time a cert is issued or renewed. Lets Ansible / HAProxy sidecar / backup jobs read the live bundle straight off disk without hitting the HTTP API. Atomic writes (.tmpstage +fsync+rename, cross-mountEXDEVfallback), per-filechmod+chownwith configurable owner UID / group GID / octal modes (defaults 0o640 files / 0o750 dirs), fail-soft (export error never blocks the ACME renewal). Per-pattern ACL table narrows which hostnames are exported and with which UID / GID (exact match, leading*.wildcard, or bare*). Audit-logged + rate-limitedGET /api/v1/certificates/{id}/downloadcomplements on-disk export for one-off downloads. Threat model:docs/security/cert-export-threat-model.md
:bar_chart: Monitoring & Observability
-
Passive SLA - per-route uptime, latency percentiles (p50/p95/p99), rolling windows (1h/24h/7d/30d)
-
Active SLA - synthetic HTTP probes at configurable intervals, detects outages during low-traffic periods
-
Prometheus metrics -
/metricsendpoint with request counts, latency histograms, backend health, WAF events, cert expiry. Per-feature counters for cache-predictor bypass, header-rule matches, canary split selection, mirror outcomes (spawned / dropped / errored), forward-auth verdict cache hit rate - all bounded by route count. Under--workers Nevery scrape triggers a pull-on-scrape fan-out over the pipelined RPC channel so per-worker counters are sub-second fresh; concurrent scrapes dedup into a single fan-out and stuck workers fall back to cached state within a 500 ms per-worker timeout (WPAR-7) -
Request mirroring (shadow testing) - duplicate every request to one or more secondary backends (deterministic per
X-Request-Idsampling, 256-slot concurrency cap, body mirroring up to a configurable cap). Fire-and-forget: mirror failure can never impact the primary -
Real-time access logs - WebSocket streaming to the dashboard with filtering
-
Load testing - built-in load test engine with SSE streaming, cron scheduling, CPU circuit breaker, and result comparison
-
SLA breach alerts - automatic notifications when SLA drops below target
-
Request capture (v1.8.0) - per-route rules that keep the full request and response for a subset of traffic, evaluated in two phases: request-side predicates (source CIDR, method, path prefix / regex, headers) decide which requests are buffered as they stream through, response-side predicates (status, latency, upstream error) decide which buffered exchange becomes a record, so the 502 one client in twenty gets is kept with the body that caused it. Every rule carries a hard expiry, a total and a per-minute budget, capped bodies and a node-wide in-flight ceiling; credential headers and named query parameters are redacted and no rule can turn that off. A record joins the access-log row on
request_idand reaches the process log, the last-50 ring behind the Capture page, the syslog / OTLP sinks and optionally a per-rule directory; a sink that stalls loses records, never latency. Arming a rule is SuperAdmin, stopping one is Operator.lorica_capture_rules_active,lorica_captures_total{rule_id,outcome},lorica_capture_inflight_bytes. Seedocs/capture.md -
Syslog export (v1.7.0) - ship access logs, WAF events, audit entries and, since v1.8.0, capture records to an existing SIEM as RFC 5424 messages over UDP, TCP (RFC 6587 octet-counting framing) or TCP+TLS (optional mutual TLS towards the collector). Configurable facility, per-event-kind severity mapping, per-kind toggles, and static structured-data parameters (
env=prod,dc=eu-west). Fire-and-forget with a bounded queue: an unreachable collector sheds export rows (lorica_log_sink_dropped_total) and never affects request serving -
OTLP logs export (v1.7.0, needs a build with
--features otel) - the same event kinds, each behind its own switch since v1.8.0, as OTLP log records to the OpenTelemetry collector already configured for tracing, withtrace_id/span_idattached from the request's span context so a log record joins its trace in Grafana / Tempo / Loki-style backends. OptionalAuthorizationheader for authenticated collectors (HTTP transports)Worked examples: SIEM (syslog) and OTLP collector
Syslog towards an rsyslog / SIEM ingest listening in TCP on 6514 with TLS: set Settings → Log export to endpoint
siem.example.com:6514, transporttcp-tls, facility 16 (local0), keep the default severities (access=info, waf=warning, audit=notice), paste the collector CA if it is private. Matching rsyslog receiver:module(load="imtcp" StreamDriver.Name="gtls" StreamDriver.Mode="1") input(type="imtcp" port="6514") template(name="lorica" type="string" string="/var/log/lorica/%APP-NAME%-%$YEAR%%$MONTH%%$DAY%.log") if $app-name == "lorica" then action(type="omfile" dynaFile="lorica")OTLP logs towards an OpenTelemetry collector: enable OTLP logs in the same tab (the collector endpoint and protocol come from the Observability tab). Minimal collector pipeline:
receivers:
  otlp:
    protocols:
      http:
exporters:
  file:
    path: /var/log/otel/lorica-logs.json
service:
  pipelines:
    logs:
      receivers: [otlp]
      exporters: [file]
Both sinks hot-reload on save (no restart) and each has a per-sink test button reporting success, failure reason and round-trip time.
Capacity note: sinks are per-process by design (mode-independent, no cross-process queue). Under
--workers autoan N-core node holds N worker connections plus one supervisor connection to the same collector, each with its own bounded queue - size collector connection limits forcores, not1, per node. Ordering across processes is the collector's concern.
:globe_with_meridians: Management
- Multi-node cluster (v1.7.0) - one control plane, any number of followers over mutual TLS with a fleet CA; short-lived join tokens bound to a node name, explicit activation, two-phase configuration replication with per-node route targeting, fleet-wide certificate issuance with need-to-know key distribution, and access logs / WAF events / bans / audit trail aggregated per node with one verifiable hash chain each. Followers are read-only with an audited break-glass window. See
docs/cluster.md - CI automation API (v1.8.0) - a second listener,
--automation-listen, off by default, so a pipeline can configure Lorica while the management API stays on loopback. A source-CIDR allowlist (automation_allowed_cidrs, mandatory) is enforced at TCP accept before the TLS handshake, followed by the cluster plane's pre-authentication budgets; requests authenticate withAuthorization: Beareronly, there is no session, cookie or CSRF path, and every one is audited. Tokens are scoped (environments:write,environments:read,routes:read,certificates:read), bound to hostname patterns and backend CIDRs, minted once on the management plane (never through the listener) and stored as an HMAC. One idempotentPUT /automation/v1/environments/{name}creates or replaces a route, its backends and a covering certificate in a single transaction and answers with the public URL; a TTL capped by the token and a reaper remove what the pipeline forgot, and the routes and backends it owns are read-only in the dashboard. Runs on a standalone node or the control plane, never on a follower. Optional GitLab OIDC mode (Story 10.5): the job's own ID token, RS256 with a pinned issuer and audience, bound claims on project, ref and environment, and replay protection, replaces the shared secret in CI variables. Seedocs/automation.md - Multi-user RBAC (v1.6.0) - team accounts with three roles:
super_admin(users, settings, config import, upgrades, fleet mutations),operator(full CRUD on routes, backends, certificates, WAF, SLA, probes, load tests, cache, bans; fleet reads) andviewer(read-only, secrets masked, fleet views hidden). Any role change, disable or password reset ends the target's sessions at once - Web dashboard - Svelte 5 UI (~59 KB) embedded in the binary: routes, backends, certs, WAF, SLA, load tests, capture, cluster, team, settings
- REST API - full CRUD for all entities, session-based auth, rate-limited login, a single fail-closed authorization middleware, OpenAPI description in
lorica-api/openapi.yaml; the automation plane has its own,lorica-api/openapi-automation.yaml, because it is a different socket with a different credential - TOML config export/import - with diff preview before applying changes
- Nginx config import - paste an
nginx.confto auto-create routes, backends, certificates, and path rules with cert import support - ACME / Let's Encrypt - automatic TLS provisioning via HTTP-01 and DNS-01 challenges (Cloudflare, Route53, OVH providers), multi-domain SAN and wildcard support, smart auto-renewal, OCSP stapling
- DNS providers - global DNS credentials configured once in Settings and referenced by ID for certificate provisioning (Cloudflare, Route53, OVH)
- Notification channels - stdout, SMTP email, HTTP webhook, Slack with per-channel rate limiting
- Ban list management - view and unban auto-banned IPs from the dashboard
:zap: Performance
- Pingora engine - forked from Cloudflare's production proxy framework
- HTTP cache - in-memory response caching with LRU eviction (128 MiB cap), TinyUFO algorithm, cache lock (thundering herd protection), stale-while-revalidate with background refresh (serves stale immediately, fetches fresh in parallel) and stale-if-error, HTTP PURGE method support
- Cache Vary - per-route
cache_vary_headerspartitions the cache by request-header values (e.g.Accept-Encoding) merged with the origin'sVaryresponse;Vary: *anchors on URI to bound cardinality - Cache predictor - 16-shard LRU (32K keys) remembers deterministically-uncacheable responses and short-circuits the cache state machine on subsequent hits, avoiding cache-lock contention on known-bypass traffic
- Peak EWMA load balancing - latency-aware backend selection alongside Round Robin, Consistent Hash, Random, Least Connections
- DashMap - lock-free concurrent reads for ban list and route connections in the hot path
- Sub-0.5ms WAF evaluation - precompiled regex patterns with zero overhead when disabled
:package: Reliability
- Worker process isolation - fork+exec with socket passing via SCM_RIGHTS
- Protobuf command channel - supervisor-to-worker config reload without traffic interruption. Under
--workers N, reloads run as two-phase Prepare + Commit on a pipelined RPC channel so the divergence window between workers collapses to the UDS RTT (microseconds) instead of the per-worker DB-rebuild time (WPAR-8, design § 7). The same RPC plane carries cross-worker circuit-breaker admission (BreakerDecision::AllowProbefor HalfOpen) so probe slots are allocated atomically across workers and a failure on one trips the breaker for every worker (WPAR-3) - Health checks - TCP and HTTP probes, backends marked degraded (>2s) or down and removed from rotation
- Graceful drain - per-backend active connection tracking with Closing/Closed lifecycle states
- Certificate hot-swap - atomic swap via arc-swap, zero downtime during rotation
- Hot binary upgrade (v1.6.0) -
POST /api/v1/system/upgrade,lorica upgrade --binary <path>or the Settings "Binary upgrade" panel replaces the running binary with no dropped connections and no systemd restart: the new binary and its detached Ed25519 signature are verified against an operator-configured public key, the live listening sockets are handed over on a Unix socket, both supervisors accept during the overlap, and a new binary that fails within 10 s is quarantined while the old one resumes. Opt-in until a signing key is configured. Seedocs/hot-upgrade.md - Encrypted storage - AES-256-GCM encryption for certificate private keys at rest
Quick Start
Install from .deb package
# Download the latest release
wget https://github.com/Rwx-G/Lorica/releases/latest/download/lorica.deb
sudo dpkg -i lorica.deb
The package creates a lorica user, installs a systemd service (enabled by default), and starts Lorica on ports 8080 (HTTP), 8443 (HTTPS), and 9443 (dashboard).
To customize ports, workers, or log level, edit the systemd unit:
sudo systemctl edit lorica
[Service]
ExecStart=
ExecStart=/usr/bin/lorica --data-dir /var/lib/lorica \
  --http-port 80 --https-port 443 --management-port 9443 \
  --workers 4 --log-level info
sudo systemctl restart lorica
Run with Docker
Lorica is Linux-only, and its management API (dashboard) binds to 127.0.0.1
inside the container. Publishing the port with -p 9443:9443 therefore
does not expose the dashboard to the host. The simplest fix on Linux is to
share the host network with the container:
docker build -t lorica .
docker run -d --name lorica --network host \
  -v lorica-data:/var/lib/lorica lorica
With --network host the dashboard is reachable at https://127.0.0.1:9443
(TLS with a self-signed certificate generated on first boot - accept the
browser warning) and the proxy listeners bind straight onto the host -
:8080 (HTTP) and :8443 (HTTPS) - so no -p flags are needed.
Get the first-run admin password (printed to stdout once and persisted to a 0600 file inside the container):
docker exec lorica cat /var/lib/lorica/initial-admin-password
# Fallback only if the file write failed (password printed to stdout instead):
docker logs lorica 2>&1 | grep 'Initial admin password:'
Open https://127.0.0.1:9443 in your browser (accept the self-signed
certificate) and log in with admin + the password. You will be prompted
to change it on first login.
Why not
-p 9443:9443? The management server binds127.0.0.1only (seelorica-api/src/server.rs), so port publishing cannot reach it. Use--network hostfor local dev. For a remote server where host networking is not an option, expose the dashboard via an SSH tunnel or Lorica's own self-proxy - see docs/self-proxy-dashboard.md.
Why the management API is loopback-only
The dashboard and REST API bind to 127.0.0.1 by design, not by accident.
That keeps the management plane off the network so it cannot be exposed to the
web, even through misconfiguration. Binding to 0.0.0.0 is explicitly out of
scope - it would weaken this security boundary.
On a production host, reach the dashboard through an SSH tunnel:
ssh -L 9443:127.0.0.1:9443 user@host
Then open https://127.0.0.1:9443 locally (accept the self-signed
certificate). For exposing the dashboard through the proxy itself (not
recommended for production), see
docs/self-proxy-dashboard.md.
Run directly
lorica --data-dir /var/lib/lorica
Open https://127.0.0.1:9443 in your browser (loopback-only by design,
self-signed certificate - use an SSH tunnel on remote hosts; see above). On
first run, a random admin password is written to
<data-dir>/initial-admin-password (mode 0600).
CLI options
lorica [OPTIONS] [COMMAND]

Options:
  --data-dir <PATH>                 Data directory (default: /var/lib/lorica)
  --management-port <PORT>          Dashboard/API port, loopback only (default: 9443)
  --http-port <PORT>                HTTP proxy port (default: 8080)
  --https-port <PORT>               HTTPS proxy port (default: 8443)
  --workers <N|auto>                Worker processes (default: 0 = single-process)
  --upstream-crl-file <PATH>        CRL checked against upstream server certificates
  --log-level <LEVEL>               Log level (default: info)
  --log-format <FORMAT>             Log format: json (default) or text
  --log-file <PATH>                 Log to file (in addition to stdout)
  --cluster-listen <HOST:PORT>      Serve the cluster plane (makes this node a control plane)
  --cluster-enrollment-listen <H:P> Enrollment listener bind (default: next port on the same host)
  --cluster-advertise <HOST>        Name followers dial, the SAN of the control-plane certificate
  --cluster-listen-any              Allow a wildcard host on the two listeners (never by accident)
  --cluster-auto-activate           Enrolled nodes become Active without operator approval (off)
  --automation-listen <HOST:PORT>   Serve the automation API (opt-in; needs a non-empty allowlist, refused on a follower)
  --automation-listen-any           Allow a wildcard host on the automation listener (never by accident)
  --version                         Print version

Commands:
  rotate-key                        Re-encrypt every stored secret under a new master key
  unban <IP>                        Lift a ban through the local management API
  upgrade --binary <PATH>           Hot binary upgrade (signature-verified, zero downtime)
  cluster init                      Generate the fleet CA on this control plane
  cluster token --node-name <NAME>  Mint a join token (SuperAdmin), printed once
  cluster join --control-plane <H:P> --token-file <PATH>
                                    Redeem a token and persist this node's fleet identity
  cluster status                    This node's fleet role and, with credentials, the live roster
  cluster break-glass [--close]     Re-enable local edits on a follower for a bounded window
  cluster leave                     Wipe this node's fleet identity (SuperAdmin, or proof of revocation)
  automation token create --name <NAME> --scope <SCOPE>... --hostname <PATTERN>...
                                    Mint a scoped automation token (SuperAdmin), printed once
Every command that needs the admin password reads it from --password-file
(mode 0600), --password-stdin or LORICA_ADMIN_PASSWORD; --password on
argv only prints a warning. cluster join accepts a token only from a file,
stdin or LORICA_JOIN_TOKEN. automation token create writes the token
alone on standard output (the public_id and expiry go to stderr), so
> /run/secret or a pipe into a secret store captures exactly the
credential; it has no --token flag, the secret is only ever an output.
The global --data-dir goes before the subcommand.
Dashboard
The dashboard ships inside the binary and is served on the management port (default 9443). No separate frontend server, no npm, no build step - just open your browser.
Getting started guide with interactive setup checklist
Overview cockpit with system health, routes, security, and performance at a glance
Routes table with hostname, backends, WAF mode, health status, and TLS
Route editor with 50+ settings across 7 tabs (General, Routing, Transform, Protection, Security, Cache, Upstream)
49 WAF rules with per-rule toggle, covering SQLi, XSS, SSRF, Log4Shell, XXE, and more
System page with worker health, heartbeat latency, CPU/memory gauges, and process metrics
Pages
- Overview - cockpit dashboard with section helpers, setup checklist, system/route/security/performance cards
- Routes - create/edit routes with host matching, path prefixes, load balancing, WAF mode, rate limits, caching, timeouts, security headers, CORS, and 25 other per-route settings; a route the automation API owns carries an
automationbadge naming its environment and opens read-only, with a hint to update it through the pipeline - Backends - manage backend addresses, weights, health check type (TCP/HTTP), TLS upstream, active connections; automation-owned backends carry the same badge
- Certificates - upload PEM certificates, view expiry dates, provision via ACME/Let's Encrypt (HTTP-01, DNS-01)
- Security - WAF event table with category filtering, 49 rule toggles, IP ban list with unban button, admin audit log with chain verification; on a control plane every tab carries a node filter over the fleet's events, bans and audit chains
- SLA - per-route passive/active SLA side-by-side, latency percentile tables, config editor, CSV/JSON export; on a control plane a node picker shows one follower's own figures (never a fleet aggregate: a fleet percentile is not a function of per-node percentiles)
- Load Tests - test config management with clone, one-click execution, real-time SSE progress panel, historical results
- Active Probes - CRUD for synthetic health probes with route selection, HTTP method/path/status/interval/timeout
- Access Logs - scrollable real-time log stream via WebSocket with green pulsing indicator; on a control plane, the fleet's access logs with a node column and filter
- Capture (v1.8.0) - the rule list with live counters, remaining budget and time to expiry, Disable for Operators, Create / Edit / Delete for SuperAdmins (the form refuses a rule that would record every request on a route unless the operator says so, and shows the expiry the TTL produces as they type), and a "Recent captures" panel over the last 50 records this process emitted, with a whole-record download
- Cluster (v1.7.0) - the fleet roster with live sessions, applied configuration generation, resource gauges, per-node certificate entitlement and recent WAF events, join-token dialog with the ready-to-paste
cluster joincommand, activation and revocation (which names the keys to re-issue); on a follower, the read-only banner with break-glass and leave - System - worker table with PID, health, heartbeat latency; CPU/memory/disk gauges
- Settings - notification channels, security header presets, DNS providers (Cloudflare / Route53 / OVH), ban rules, network allow / deny lists and the automation listener's allowed CIDRs, OpenTelemetry exporter, log export (syslog and OTLP logs, one switch per event kind on each sink, per-sink test), GeoIP / ASN databases, AI crawler policy, team (users and roles), automation tokens (scopes, hostname patterns, backend CIDRs, lifetimes; the token is shown once, revocation keeps the row), binary upgrade, certificate filesystem export zone + ACL editor, config export / import with diff preview
- Theme - light/dark mode toggle
Architecture
Lorica is a Rust workspace with 31 crates: 16 forked from Cloudflare Pingora and 15 product crates. See FORK.md for the full fork lineage and renaming rules.
| Crate | Purpose |
|---|---|
lorica | CLI binary, supervisor, worker orchestration |
lorica-proxy | HTTP/HTTPS proxy engine (Pingora fork) |
lorica-tls | SNI certificate resolver, hot-swap, encrypted key storage |
lorica-acme | Pure ACME core: HTTP-01 / DNS-01 issuance driver, DNS challengers (Cloudflare / Route53 / OVH) |
lorica-config | SQLite store, versioned migrations, TOML export/import |
lorica-api | axum REST API, auth, session management, RBAC, the automation listener and its scope gate |
lorica-dashboard | Svelte 5 frontend embedded via rust-embed |
lorica-waf | WAF engine, OWASP rules, IP blocklist |
lorica-notify | Alert dispatch (stdout, SMTP, webhook, Slack) |
lorica-bench | SLA monitoring, load testing engine |
lorica-metrics | Shared Prometheus registry + cross-worker counter aggregation |
lorica-worker | fork+exec worker isolation, typed FD passing (Listener / Shmem / Rpc) |
lorica-command | Protobuf supervisor-worker command channel + pipelined RpcEndpoint (Envelope framing, in-flight demux, bounded backpressure), Coalescer, GenerationGate |
lorica-shmem | Anonymous memfd region shared across all workers; AtomicHashTable for per-IP WAF flood / auto-ban counters; SipHash-1-3 anti-HashDoS; 5-min eviction walker |
lorica-cluster | Cluster plane (v1.7.0): mutual-TLS transport on the same RpcEndpoint as the worker channel, fleet CA, join tokens, enrollment and operational listeners, roster and session registry, two-phase replication, telemetry ingest quota; configuration-blind by design (the blob is opaque bytes to it) |
lorica-geoip | GeoIP / ASN lookups (MaxMind-format databases) for country and network policy |
lorica-challenge | Bot challenges: proof-of-work, image captcha (vendored renderer), cookie issuance |
lorica-lb | Load balancing (Round Robin, Peak EWMA, Hash, Random, Least Conn) |
lorica-cache | HTTP response cache, LRU eviction |
lorica-limits | Rate estimator + per-route LocalBucket / AuthoritativeBucket token-bucket primitives (lock-free CAS, 100 ms cross-worker sync) |
Data plane (proxy) and control plane (API/dashboard) are fully separated. API mutations trigger config reload via arc-swap - the proxy picks up changes without restarting.
Performance
Measured on a single Linux VM (4 vCPU, 8 GB RAM):
| Metric | Value |
|---|---|
| Single-process throughput | ~6,500 req/s |
| Multi-worker throughput (4 workers) | ~25,000 req/s |
| WAF evaluation latency | < 0.5 ms per request |
| WAF overhead on throughput | ~6% |
| Dashboard bundle size | ~59 KB (gzipped) |
| Config reload | Zero-downtime (arc-swap) |
| Certificate hot-swap | Zero-downtime (atomic) |
Configuration Example
Create a route via the REST API:
# Authenticate
TOKEN=$(curl -sk https://127.0.0.1:9443/api/v1/auth/login \
  -H 'Content-Type: application/json' \
  -d '{"username":"admin","password":"your-admin-password"}' \
  -c - | grep lorica_session | awk '{print $NF}')

# Create a backend
curl -sk https://127.0.0.1:9443/api/v1/backends \
  -b "lorica_session=$TOKEN" \
  -H 'Content-Type: application/json' \
  -d '{
    "address": "127.0.0.1:8080",
    "health_check_interval_s": 10,
    "health_check_type": "http",
    "health_check_path": "/healthz"
  }'

# Create a route (ids are server-assigned UUIDs returned by the creates above)
curl -sk https://127.0.0.1:9443/api/v1/routes \
  -b "lorica_session=$TOKEN" \
  -H 'Content-Type: application/json' \
  -d '{
    "hostname": "app.example.com",
    "path_prefix": "/",
    "backend_ids": ["<backend-uuid>"],
    "load_balancing": "peak_ewma",
    "tls_enabled": true,
    "certificate_id": "<certificate-uuid>",
    "waf_enabled": true,
    "waf_mode": "block",
    "rate_limit_rps": 100,
    "rate_limit_burst": 50,
    "cache_enabled": true,
    "cache_ttl_s": 300,
    "force_https": true,
    "security_headers": "strict"
  }'
Or just use the dashboard - it covers all the same operations with zero curl.
REST API Reference
All endpoints are served on the management port (default 9443) over HTTPS (a self-signed certificate generated on first boot; loopback only, so curl -k accepts it). Protected endpoints require a session cookie obtained via /api/v1/auth/login.
Public endpoints
| Method | Path | Description |
|---|---|---|
POST | /api/v1/auth/login | Authenticate (returns session cookie) |
POST | /api/v1/auth/logout | Invalidate session |
GET | /metrics | Prometheus metrics. Authenticated by default since 1.7.0: the bearer token in prometheus_scrape_token (or LORICA_PROMETHEUS_SCRAPE_TOKEN), or a session cookie sent as a header (it is scoped to /api, so a browser does not send it here); metrics_require_auth = false restores the open endpoint |
GET | /.well-known/acme-challenge/{token} | ACME HTTP-01 challenge response |
Auth & Users (RBAC)
| Method | Path | Description |
|---|---|---|
GET | /api/v1/auth/me | Current session user and role |
PUT | /api/v1/auth/password | Change own password |
GET | /api/v1/users | List users |
POST | /api/v1/users | Create user (role-scoped) |
PUT | /api/v1/users/{id} | Update user (role, password reset) |
DELETE | /api/v1/users/{id} | Delete user |
Routes
| Method | Path | Description |
|---|---|---|
GET | /api/v1/routes | List all routes |
POST | /api/v1/routes | Create route |
GET | /api/v1/routes/{id} | Get route |
PUT | /api/v1/routes/{id} | Update route |
DELETE | /api/v1/routes/{id} | Delete route |
POST | /api/v1/validate/mtls-pem | Parse a candidate client-CA PEM and return per-cert subjects |
POST | /api/v1/validate/forward-auth | Probe a candidate forward-auth URL (one GET, status + elapsed) |
Backends
| Method | Path | Description |
|---|---|---|
GET | /api/v1/backends | List all backends |
POST | /api/v1/backends | Create backend |
GET | /api/v1/backends/{id} | Get backend |
PUT | /api/v1/backends/{id} | Update backend |
DELETE | /api/v1/backends/{id} | Delete backend |
Certificates
| Method | Path | Description |
|---|---|---|
GET | /api/v1/certificates | List certificates |
POST | /api/v1/certificates | Upload PEM certificate |
POST | /api/v1/certificates/self-signed | Generate self-signed certificate |
GET | /api/v1/certificates/{id} | Get certificate |
GET | /api/v1/certificates/{id}/download?part={cert|key|chain|bundle} | Download PEM material (rate-limited, audit-logged) |
POST | /api/v1/certificates/{id}/renew | Force ACME renewal of a certificate |
PUT | /api/v1/certificates/{id} | Update certificate |
DELETE | /api/v1/certificates/{id} | Delete certificate |
GET | /api/v1/cert-export/acls | List per-pattern cert-export ACLs |
POST | /api/v1/cert-export/acls | Create a cert-export ACL rule |
DELETE | /api/v1/cert-export/acls/{id} | Delete a cert-export ACL rule |
POST | /api/v1/cert-export/reapply | Re-export every certificate to disk |
GET | /api/v1/cert-export/orphans | List per-hostname subdirectories with no matching live cert |
DELETE | /api/v1/cert-export/orphans/{name} | Remove one orphan subdirectory (sanitised + live-cert guard) |
ACME & DNS Providers
| Method | Path | Description |
|---|---|---|
POST | /api/v1/acme/provision | Provision via HTTP-01 |
POST | /api/v1/acme/provision-dns | Provision via DNS-01 |
POST | /api/v1/acme/provision-dns-manual | Start manual DNS-01 flow |
POST | /api/v1/acme/provision-dns-manual/check | Poll DNS propagation for the manual flow |
POST | /api/v1/acme/provision-dns-manual/confirm | Confirm manual DNS-01 |
GET | /api/v1/dns-providers | List DNS provider credentials |
POST | /api/v1/dns-providers | Create a DNS provider credential |
PUT | /api/v1/dns-providers/{id} | Update a DNS provider credential |
DELETE | /api/v1/dns-providers/{id} | Delete a DNS provider credential |
POST | /api/v1/dns-providers/{id}/test | Test a DNS provider credential |
AI Crawlers
| Method | Path | Description |
|---|---|---|
GET | /api/v1/ai-crawlers/builtin | List built-in known-bot signatures |
GET | /api/v1/ai-crawlers/custom | List custom crawler rules |
POST | /api/v1/ai-crawlers/custom | Create a custom crawler rule |
PUT | /api/v1/ai-crawlers/custom/{id} | Update a custom crawler rule |
DELETE | /api/v1/ai-crawlers/custom/{id} | Delete a custom crawler rule |
GET | /api/v1/ai-crawlers/robots-preview | Preview the generated robots.txt |
GET | /api/v1/ai-crawlers/test | Test a User-Agent against the matcher |
GET | /api/v1/ai-crawlers/stats | AI-crawler match counters |
WAF
| Method | Path | Description |
|---|---|---|
GET | /api/v1/waf/events | Recent WAF events (with category filter) |
DELETE | /api/v1/waf/events | Clear WAF events |
GET | /api/v1/waf/stats | WAF statistics |
GET | /api/v1/waf/rules | List WAF rules |
PUT | /api/v1/waf/rules/{id} | Enable/disable rule |
GET | /api/v1/waf/rules/custom | List custom rules |
POST | /api/v1/waf/rules/custom | Create custom rule |
DELETE | /api/v1/waf/rules/custom/{id} | Delete custom rule |
GET | /api/v1/waf/blocklist | Blocklist status |
PUT | /api/v1/waf/blocklist | Enable/disable blocklist |
POST | /api/v1/waf/blocklist/reload | Reload blocklist |
SLA & Probes
| Method | Path | Description |
|---|---|---|
GET | /api/v1/sla/overview | SLA overview for all routes (?node= on a control plane: one follower's own, Operator+) |
GET | /api/v1/sla/routes/{id} | SLA metrics for route (?node= as above) |
GET | /api/v1/sla/routes/{id}/buckets | Time-bucketed SLA data (?node= as above) |
GET | /api/v1/sla/routes/{id}/config | SLA config |
PUT | /api/v1/sla/routes/{id}/config | Update SLA config |
GET | /api/v1/sla/routes/{id}/export | Export SLA data (CSV/JSON) |
GET | /api/v1/sla/routes/{id}/active | Active probe results (?node= as above) |
DELETE | /api/v1/sla/routes/{id}/data | Clear stored SLA data for a route |
GET | /api/v1/probes | List probes |
POST | /api/v1/probes | Create probe |
GET | /api/v1/probes/route/{route_id} | Probes for route |
GET | /api/v1/probes/{id}/history | Probe result history |
PUT | /api/v1/probes/{id} | Update probe |
DELETE | /api/v1/probes/{id} | Delete probe |
Load Testing
| Method | Path | Description |
|---|---|---|
GET | /api/v1/loadtest/configs | List configs |
POST | /api/v1/loadtest/configs | Create config |
PUT | /api/v1/loadtest/configs/{id} | Update config |
DELETE | /api/v1/loadtest/configs/{id} | Delete config |
POST | /api/v1/loadtest/configs/{id}/clone | Clone config |
POST | /api/v1/loadtest/start/{config_id} | Start test (requires confirm) |
POST | /api/v1/loadtest/start/{config_id}/confirm | Confirm and execute |
GET | /api/v1/loadtest/status | Current test status |
GET | /api/v1/loadtest/ws | WebSocket real-time progress |
POST | /api/v1/loadtest/abort | Abort running test |
GET | /api/v1/loadtest/results/{config_id} | Test results |
GET | /api/v1/loadtest/results/{config_id}/compare | Compare runs |
Cache & Bans
| Method | Path | Description |
|---|---|---|
DELETE | /api/v1/cache/routes/{id} | Purge route cache |
GET | /api/v1/cache/stats | Cache hit/miss stats |
GET | /api/v1/bans | List banned IPs |
DELETE | /api/v1/bans/{ip} | Unban IP |
Audit Log
| Method | Path | Description |
|---|---|---|
GET | /api/v1/audit | List admin audit-log entries (Operator+; on a control plane the fleet's trail needs SuperAdmin unless ?node= names this node's own chain) |
GET | /api/v1/audit/verify | Verify the audit-log hash chains, one verdict per node (SuperAdmin) |
Cluster (v1.7.0)
Fleet reads are Operator+, fleet mutations SuperAdmin; every one of them answers 409 on a node that is not a control plane. See docs/cluster.md.
| Method | Path | Description |
|---|---|---|
GET | /api/v1/cluster/status | This node's fleet role, connection state and, on a control plane, the roster summary (Viewer+) |
GET | /api/v1/cluster/nodes | The roster with live session facts, resource gauges and certificate entitlement |
GET | /api/v1/cluster/nodes/{id} | One enrolled node |
POST | /api/v1/cluster/nodes/{id}/activate | Approve a pending node: it receives configuration and keys from then on |
DELETE | /api/v1/cluster/nodes/{id} | Revoke a node (CRL, session ended at once); the answer names the certificates whose key it keeps, to re-issue |
GET / POST | /api/v1/cluster/tokens | List / mint join tokens (bound to a node name, optionally a source CIDR, short-lived) |
DELETE | /api/v1/cluster/tokens/{public_id} | Revoke an unused token |
GET | /api/v1/cluster/replication | The last replication round's report per node |
GET | /api/v1/cluster/drift | Nodes whose applied configuration differs from the current generation |
GET | /api/v1/cluster/logs | The fleet's access logs, cursor-paginated, ?node= / ?route= filters |
GET | /api/v1/cluster/waf-events | The fleet's WAF events, ?node= / ?category= filters |
GET / POST | /api/v1/cluster/bans | Every node's live bans as last reported / issue a fleet-wide ban |
GET / POST / DELETE | /api/v1/cluster/break-glass | On a follower: the window's state / open it for a bounded time / close it (SuperAdmin) |
POST | /api/v1/cluster/leave | On a follower: tell the control plane, wipe the fleet identity (SuperAdmin) |
Capture (v1.8.0)
Arming, editing, reading back and deleting a rule is SuperAdmin (the stored rule spells out what a node records); listing rules, stopping one and reading recent records is Operator+. See docs/capture.md.
| Method | Path | Description |
|---|---|---|
GET | /api/v1/capture/rules | List capture rules with their counters, remaining budget and expiry (Operator+) |
POST | /api/v1/capture/rules | Create a capture rule |
GET | /api/v1/capture/rules/{id} | Get a capture rule |
PUT | /api/v1/capture/rules/{id} | Update a capture rule |
DELETE | /api/v1/capture/rules/{id} | Delete a capture rule |
POST | /api/v1/capture/rules/{id}/disable | Stop a rule (Operator+: the safe direction, for whoever is paged at 3am) |
GET | /api/v1/capture/recent | The last 50 records this process emitted, bodies cut at 4 KiB (Operator+; 503 on a --workers node, naming the sinks that carry them) |
GET | /api/v1/capture/recent/{request_id} | Download one whole record while it is still in the ring (Operator+) |
Automation (v1.8.0)
Token administration lives on the management plane, SuperAdmin and audited; the automation listener serves none of it, so a token can never mint a token. See docs/automation.md.
| Method | Path | Description |
|---|---|---|
GET / POST | /api/v1/automation/tokens | List tokens / mint one (scopes, hostname patterns, backend CIDRs, environment TTL ceiling, lifetime); the full token is returned by the create only, the node keeps its HMAC |
DELETE | /api/v1/automation/tokens/{public_id} | Revoke a token (stamps revoked_at, keeps the row) |
GET / POST | /api/v1/automation/oidc-issuers | List OIDC issuer entries / register one (GitLab instance URL, audience, jwks_url, bound claims, hostname patterns, backend CIDRs, environment TTL ceiling, scopes); SuperAdmin, audited |
DELETE | /api/v1/automation/oidc-issuers/{id} | Remove an issuer entry (a real delete; the next ID token it would have accepted is refused) |
The automation routes answer on --automation-listen, authenticate with Authorization: Bearer <token> only (no cookie, no session), and are gated by scope rather than role. A path with no declared scope is reachable by no token.
| Method | Path | Scope | Description |
|---|---|---|---|
GET | /automation/v1/whoami | environments:read | The token behind this request: name, public_id, scopes |
GET | /automation/v1/environments | environments:read | List environments (?label=, ?hostname=, ?expiring_before=) |
GET | /automation/v1/environments/{name} | environments:read | One environment, with its ETag |
PUT | /automation/v1/environments/{name} | environments:write | Create (201) or replace (200) the route, backends and certificate binding in one transaction; If-Match for a 412 instead of last-writer-wins |
DELETE | /automation/v1/environments/{name} | environments:write | Remove the route, its owned backends and the joins (204, idempotent) |
System & Configuration
| Method | Path | Description |
|---|---|---|
GET | /api/v1/settings | Global settings |
PUT | /api/v1/settings | Update settings (rejects cross-field-inconsistent values with 400) |
GET | /api/v1/settings/schema | Settings field schema (bounds, defaults) |
POST | /api/v1/settings/otel/test | Test the OpenTelemetry exporter connection |
POST | /api/v1/settings/syslog/test | Send a test message over the syslog export sink |
POST | /api/v1/settings/otlp-logs/test | Probe the OTLP collector's logs signal path |
GET | /api/v1/status | System status summary |
GET | /api/v1/system | CPU, memory, disk usage |
POST | /api/v1/system/upgrade | Hot binary upgrade (signature-verified, zero-downtime) |
GET | /api/v1/metrics | The /metrics document behind the dashboard session, for a browser (the session cookie is scoped to /api) |
GET | /api/v1/workers | Worker heartbeat metrics |
GET | /api/v1/logs | Access logs |
DELETE | /api/v1/logs | Clear logs |
GET | /api/v1/logs/export | Export access logs (CSV/JSON) |
GET | /api/v1/logs/ws | WebSocket log stream |
POST | /api/v1/config/export | Export config as TOML |
POST | /api/v1/config/import | Import TOML config |
POST | /api/v1/config/import/preview | Preview import diff |
GET | /api/v1/notifications | List notification configs |
POST | /api/v1/notifications | Create notification config |
PUT | /api/v1/notifications/{id} | Update notification config |
DELETE | /api/v1/notifications/{id} | Delete notification config |
POST | /api/v1/notifications/{id}/test | Test notification channel |
GET | /api/v1/notifications/history | Notification dispatch history |
GET | /api/v1/preferences | List user preferences |
PUT | /api/v1/preferences/{id} | Update preference |
DELETE | /api/v1/preferences/{id} | Delete preference |
Building from Source
# Prerequisites
# - Rust 1.88+
# - Node.js 20+ (Vite 8 minimum, dashboard compilation)
# - Linux (x86_64)

git clone https://github.com/Rwx-G/Lorica.git
cd Lorica
cargo build --release

# Binary is at target/release/lorica
# The Svelte frontend is compiled automatically during cargo build.
Running tests
# Every Rust test in the workspace
cargo test --workspace

# Product crates only (2632 tests, Lorica-native)
cargo test -p lorica-config -p lorica-api -p lorica -p lorica-waf \
           -p lorica-notify -p lorica-bench -p lorica-worker \
           -p lorica-command -p lorica-limits -p lorica-shmem \
           -p lorica-challenge -p lorica-geoip -p lorica-acme \
           -p lorica-metrics -p lorica-cluster -p lorica-dashboard \
           --features otel

# Pingora-forked crates (748 tests)
cargo test -p lorica-core -p lorica-proxy -p lorica-http \
           -p lorica-error -p lorica-tls -p lorica-cache \
           -p lorica-pool -p lorica-runtime -p lorica-timeout \
           -p lorica-lb -p lorica-ketama -p lorica-lru \
           -p lorica-memory-cache -p lorica-header-serde -p TinyUFO

# The cluster crate's integration binaries, including the frozen v1.7.0
# wire corpus (every message's encoding, pinned)
cargo test -p lorica-cluster --tests

# Frontend (480 Vitest cases across 25 files) and its gates
cd lorica-dashboard/frontend && npm run check && npm run lint && npx vitest run
The lorica binary crate carries 19 end-to-end binaries under
lorica/tests/ that drive a real Pingora Server against mock backends
(mTLS, response rewriting, mirroring, forward auth, stale-while-revalidate,
the connection pre-filter, canary and header routing, config reload, rate
limits and their cross-worker sync, the circuit breaker and the RPC
plane). They run as part of cargo test -p lorica.
Docker end-to-end suites
tests-e2e-docker/ spins Lorica up against real backend containers and
drives every profile through the actual network stack. ./run.sh --build
runs them all in sequence; each --skip-<profile> flag drops one.
| Profile | Assertions | What it proves |
|---|---|---|
| base (single-process) | 361 | routing, TLS, WAF, rate limits, cache, SLA, load tests, ACME challenge path, /metrics gated by default |
| workers | 90 | the same under --workers 2: two-phase reload, cross-worker breaker, shmem auto-ban, metrics pull-on-scrape, forward-auth cache |
| cert-export | 39 | PEM disk export, ACL, reapply, orphans |
| ai-bot, ai-bot-workers | 52, 49 | AI crawler verdicts, robots.txt, verified-bot headers, in both modes |
| rbac, rbac-workers | 37, 37 | per-role 403 matrix, user CRUD, session invalidation |
| audit | 17 | the hash chain, tamper localisation, role floors |
| hot-upgrade | 29 | signature verification, socket handover, rollback of a failing binary |
| log-sinks | 23 | RFC 5424 syslog over TCP and OTLP logs, delivered to real collectors |
| acme | 15 | HTTP-01 and manual DNS-01 issuance against the Pebble fixture |
| capture | 163 | two-phase matching from two source addresses, a 10 MiB body truncated at the cap while the upstream still receives all of it, credential headers and named query parameters redacted on every sink, a binary body round-tripping through base64, the per-rule budget and the TTL each self-disabling their rule, the recent-captures ring, and an output.dir that is read-only and then writable |
| capture-workers | 160 + 50 | the same profile under --workers 2, sharing the 163 assertions above behind a flag rather than forking them (three become ranges, because a budget is spent per worker), plus what only worker mode can show: the per-rule budget overshooting its total by at most the worker count, the recent-captures ring answering 503 rather than an empty 200, all four sinks fed from inside a worker, and the counters aggregating across workers on /metrics |
| cluster | 64 | a control plane and two followers (one in workers mode): enrollment, activation, replication, an HTTP-01 order validated through the selected follower, need-to-know key distribution, telemetry and audit fan-in, a load phase at 300 rps per follower, per-node SLA reads, break-glass, revocation |
| automation | 104 | on the same fleet fixture, since the listener belongs to the control plane: the source allowlist refusing a foreign address before the TLS handshake, bearer-only authentication and the scope gate, the idempotent environment PUT with If-Match, hostname and backend-CIDR grants, the TTL reaper, the management API refusing to edit a managed row, GitLab ID tokens against a local issuer fixture with a replayed jti refused, and a follower refusing to open the listener at all |
| cluster restart + revocation | 22 | the same fleet across a process boundary: a follower re-opens its session unaided and keeps its generation, SLA history and served certificate; a restarted control plane reports its policy-state reset, takes its followers back and clears the flag after a round; then revocation, last because it is terminal for a node |
| bot, bot-workers, geoip, rdns, otel, otel-workers | 29, 29, 16, 7, 16, 16 | bot challenges, country policy, rDNS bypass, OTLP traces; run individually with docker compose --profile <name> run --rm <name>-smoke |
The two intentional gaps in the Docker harness are:
- mTLS client-cert handshake (495 / 496 / 200 based on the
presented cert). The e2e container starts without any TLS certs
pre-loaded so the HTTPS listener on port 8443 is never built -
driving
curl --certneeds a staged environment. The config surface (CA PEM validation,required+allowed_organizationshot-reload) is covered. - Connection pre-filter TCP drop (scanner IP refused at
accept()before TLS). The test-runner sits on the same Docker network as Lorica, so any CIDR that would cover a real scanner also covers the runner - asserting the drop from inside would be self-blocking. The config round-trip (valid CIDR accepted, garbage rejected 400) is covered.
Validate both manually on staging when touching the surrounding code paths.
systemd Service
The .deb and .rpm packages install a hardened systemd unit with:
ProtectSystem=strict,PrivateTmp=yes,NoNewPrivileges=yesMemoryDenyWriteExecute=yes,SystemCallFilter=@system-serviceRestrictNamespaces=yes,RestrictSUIDSGID=yes- Runs as dedicated
loricauser withCAP_NET_BIND_SERVICE - Service auto-starts on install and auto-restarts on upgrade
- Data directory (
/var/lib/lorica) preserved across upgrades
Customize the service (e.g. enable workers) via drop-in override:
sudo systemctl edit lorica
[Service]
ExecStart=
ExecStart=/usr/bin/lorica --workers 6
Performance Tuning
See docs/tuning.md for kernel parameters (sysctl), file descriptor limits, worker configuration, cache settings, and a production readiness checklist. Run bench/ for reproducible throughput measurements.
Worker Mode
When running with --workers N >= 1, see docs/worker-mode.md for the operational notes (which settings require a supervisor restart, what changes between single-process and worker mode).
Running a Fleet
One node is the control plane; every other node is a follower that receives
its configuration and certificates from it and fans its logs, WAF events,
bans and audit trail back in. Followers are read-only (a mutation answers
409) until a SuperAdmin opens a bounded, audited break-glass window.
# On the control plane: generate the fleet CA (once, service stopped), then
# serve the cluster plane. On a packaged install the two flags go in the
# systemd drop-in (`sudo systemctl edit lorica`, see "systemd Service" below).
lorica --data-dir /var/lib/lorica cluster init
lorica --data-dir /var/lib/lorica --cluster-listen 10.0.0.10:9444 --cluster-advertise cp.internal.example.org

# Mint a token bound to the node name the route selectors will use
# (or use the join dialog on the dashboard's Cluster page).
lorica cluster token --node-name edge-01 --password-file /root/.lorica-admin

# On the new node, service stopped: redeem it (the token never touches argv), then start.
lorica --data-dir /var/lib/lorica cluster join \
  --control-plane cp.internal.example.org:9444 --name edge-01 --token-file /root/join-token
systemctl start lorica

# Back on the control plane: approve it, from the Cluster page or the API.
# Nothing flows before activation.
curl -sk -b "lorica_session=$TOKEN" -X POST https://127.0.0.1:9443/api/v1/cluster/nodes/<node-id>/activate
Everything after enrollment is day-to-day dashboard work on the control
plane: routes, backends, certificates, WAF and settings are edited there as
on a single node and replicate to the fleet; the Cluster page holds the
roster, activation, revocation, drift, replication reports, fleet bans and
the break-glass switch. Only join, leave, status and break-glass
belong to the node's own CLI, because they must work with the control plane
unreachable.
What every node keeps as its own: listening addresses, data directory, log
sinks' endpoints, export zone and master key. Everything else replicates.
--automation-listen (v1.8.0) belongs on the control plane: a follower
refuses to start with it, since its configuration is replaced at the next
replication round. Upgrade followers before the control plane (a follower whose schema is behind
is refused at the handshake). docs/cluster.md covers the trust model (the
control plane's encryption.key is the fleet's identity root), replication,
key distribution, telemetry fan-in and its measured envelope, the audit
trail, failure modes and how to replace a control plane.
Documentation
- docs/installation.md - packages, first boot, the management plane's TLS certificate
- docs/cluster.md - multi-node operation, end to end
- docs/capture.md - traffic capture: rules, budgets, the record, redaction, sinks
- docs/automation.md - the CI automation API: the listener, tokens and scopes, the environment resource, GitLab pipelines and OIDC
- docs/security.md, docs/security/hardening-guide.md, docs/security/threat-model.md - what is protected, how, and what is not
- docs/worker-mode.md, docs/tuning.md -
--workers, kernel and file-descriptor tuning - docs/hot-upgrade.md, docs/ai-crawlers.md, docs/self-proxy-dashboard.md
- CHANGELOG.md, COMPARISON.md, FORK.md
Package Verification
Release .deb and .rpm packages are GPG-signed. Import the public key to verify:
curl -fsSL https://github.com/Rwx-G/Lorica/raw/main/docs/lorica-signing-key.asc | sudo gpg --dearmor -o /usr/share/keyrings/lorica.gpg
gpg --verify lorica.deb.asc lorica.deb
From v1.7.4 on, the release tag is signed with the same key, so the chain runs from the package back to the commit it was built from. Earlier tags are unsigned; verify those releases by their package signature.
git verify-tag v1.7.4
Roadmap
| Version | Features | Status |
|---|---|---|
| v1.4.0 | OpenTelemetry tracing (OTLP), GeoIP country blocking, Bot protection (PoW / captcha / cookie with 5-category bypass matrix) | Shipped |
| v1.5.0 | Operator-input guard-rails on every field with blur + input inline errors; Route group_name + filter + colored pill; Certificate download API + dashboard split-menu with private-key confirm; Filesystem certificate export zone with per-pattern ACL, Settings tab, operator re-export endpoint, orphan sweep + per-row delete; Path-rule redirect fix ; Security hardening wave: ammonia HTML sanitiser, per-endpoint rate limits on management plane, per-route body-size limits with 1 MiB global default, session cookie rotation on password change, /system response filter, rustls-pemfile → rustls-pki-types migration, rand 0.9 bump, source-error preservation on .map_err chains, WebSocket log-stream backpressure with close-on-slow-client ; Doc coverage pass + #![warn(missing_docs)] on every Lorica-native crate ; ACME unit tests (wiremock on Cloudflare + OVH challengers, is_valid_dns_server shell-filter, pure should_auto_renew predicate) ; verdict_cache test-parallelism race fixed via serial_test | Shipped |
| v1.5.1 + v1.5.2 (audit-closure cycles) | Worker-mode cert hot-reload (cert install / renew now serves new cert across all workers without restart) ; SMTP encryption modes (starttls / tls / none) for the Email notification channel ; security defense-in-depth pass : webhook URL + Slack URL + auth_header scrubbed on JSON GET (matched the v1.5.1 TOML scrub asymmetry), CSV formula injection guard on access-log export, CSP3 directives (frame-ancestors, form-action, base-uri, object-src), per-endpoint rate limits broadened to ~16 mutating endpoints, redirect-policy=none on webhook / OCSP / blocklist clients ; reactor-stall pass : LogStore + enforce_notification_retention off-loaded to spawn_blocking ; reload pass : two-phase + legacy converged through one apply_per_process_resolver_hooks helper, cert-resolver reload serialised, OTel / GeoIP / ASN apply-error counter ; perf : Cow URL decode + itoa status formatting + chrono deferred until WAF match + dashmap fast-path on bot stash + parking_lot::Mutex on hot path + RuleSet::matches prefilter shortcut ; deps : rustls-webpki 0.103.13 (RUSTSEC-2026-0104 + 0099), postcss 8.5.10 (CVE-2026-41305), aws-lc-rs dropped from the lorica-tls crypto stack in favor of ring (the broader binary still pulls aws-lc-rs transitively via the rustls 0.23 default stack in lorica-api), x509-parser 0.18 aligned across lorica-tls / lorica-api ; chore : ~50 magic-number bl() / rl() calls in server.rs lifted to pub const, 3 formatBytes dashboard implementations consolidated into lib/format.ts, 3 docs/security.md drift items fixed (49 WAF rules + ~80k IP blocklist) | Shipped |
| v1.6.0 | AI-crawler (LLM) deny-list as a first-class feature (known-bot User-Agent + rDNS matcher, per-route opt-in / opt-out, Prometheus counter), Hot binary upgrade (zero-downtime restart), Team settings (multiple users, roles, RBAC), TLS management plane, cert-resolver reliability + background OCSP, rate-limit unification, vendored captcha | Shipped |
| v1.7.0 | Multi-node cluster (control plane + followers over mutual TLS, token enrollment with explicit activation, two-phase configuration replication with per-node route targeting, fleet-wide certificate issuance with need-to-know key distribution, telemetry and audit-trail fan-in with one chain per node, fleet dashboard), syslog (RFC 5424) and OTLP logs export, /metrics authenticated by default | Shipped |
| v1.8.0 | Conditional request capture (per-route rules with request-side predicates on source CIDR, path, method and headers, response-side predicates on status and latency, capped request and response bodies, per-rule budgets and TTL, header and query-string redaction, export to the log sinks and a dashboard page) and a CI automation API (a separate listener on its own port, off by default, behind a source-CIDR allowlist and scoped bearer tokens while the management API stays on loopback; an idempotent environment resource that binds a hostname, a backend and a certificate in one atomic apply for review apps, optional GitLab OIDC ID-token authentication). PRD: Epic 10, stories 10.1 to 10.6. | Shipped |
| v1.9.0 | Management MCP server with tiered access: an operator drives Lorica from an MCP client with the authority the task needs and no more. Three tiers (read, config, admin) that are scope sets on the Epic 10 automation tokens rather than a second authorization model, one process per tier with no tool that elevates, and every call in the tamper-evident audit chain marked as an MCP call. Streamable HTTP served as a path on the automation listener rather than a new port, so it inherits that listener's TLS, source-CIDR allowlist and token revocation; stdio for the workstation case. PRD: Epic 11, stories 11.1 to 11.4. | Planned |
| v2.0.0 | HTTP/3 (QUIC), TCP/L4 proxying | Planned |
Backlog (tracking only, blocked on upstream)
rustls-pemfileremoval in thelorica-tlsfork. RUSTSEC-2025-0134 (unmaintained) still shows transitively through our Pingora fork. Native Lorica code migrated torustls-pki-typesin v1.5.0 ; the transitive dep clears once Pingora upstream migrates.rand 0.8removal in forked crates. Native Lorica code bumped torand 0.9in v1.5.0. RUSTSEC-2026-0097 (unsound with custom logger) was cleared in v1.5.8 by bumping the transitive0.8line to0.8.6; removing the0.8line entirely still depends on the upstream forks (lorica-runtime,lorica-limits) and theaxum/tungstenitemajors. Same monitoring as therustls-pemfilerow.
The table above tracks feature milestones; the current release and the patch cycles (v1.5.3+) live in CHANGELOG.md.
See COMPARISON.md for a detailed feature comparison with Nginx, Traefik, HAProxy, Caddy, BunkerWeb, Sozu, and Pingora.
Not Supported
| Feature | Status | Rationale |
|---|---|---|
| HTTP/3 / QUIC | Planned | Waiting for Pingora PR #524 (tokio-quiche integration) to merge upstream |
| io_uring | Not planned | tokio-uring is unmaintained since 2022. epoll via Tokio delivers sufficient performance (40M req/s at Cloudflare scale) |
| Windows / macOS | Not supported | Linux x86_64 only (fork+exec worker model requires Linux) |
| OpenSSL / BoringSSL | Removed | rustls is the sole TLS provider |
License
Apache-2.0 - see LICENSE.
Credits
Built on Pingora by Cloudflare (Apache-2.0). See NOTICE and FORK.md for fork details.
Author: Rwx-G
Similar repos
Contributors
Languages
Rust
82.2%
Svelte
7.6%
Shell
5.5%
TypeScript
4.0%