A scientific plotting library in Rust
See the code







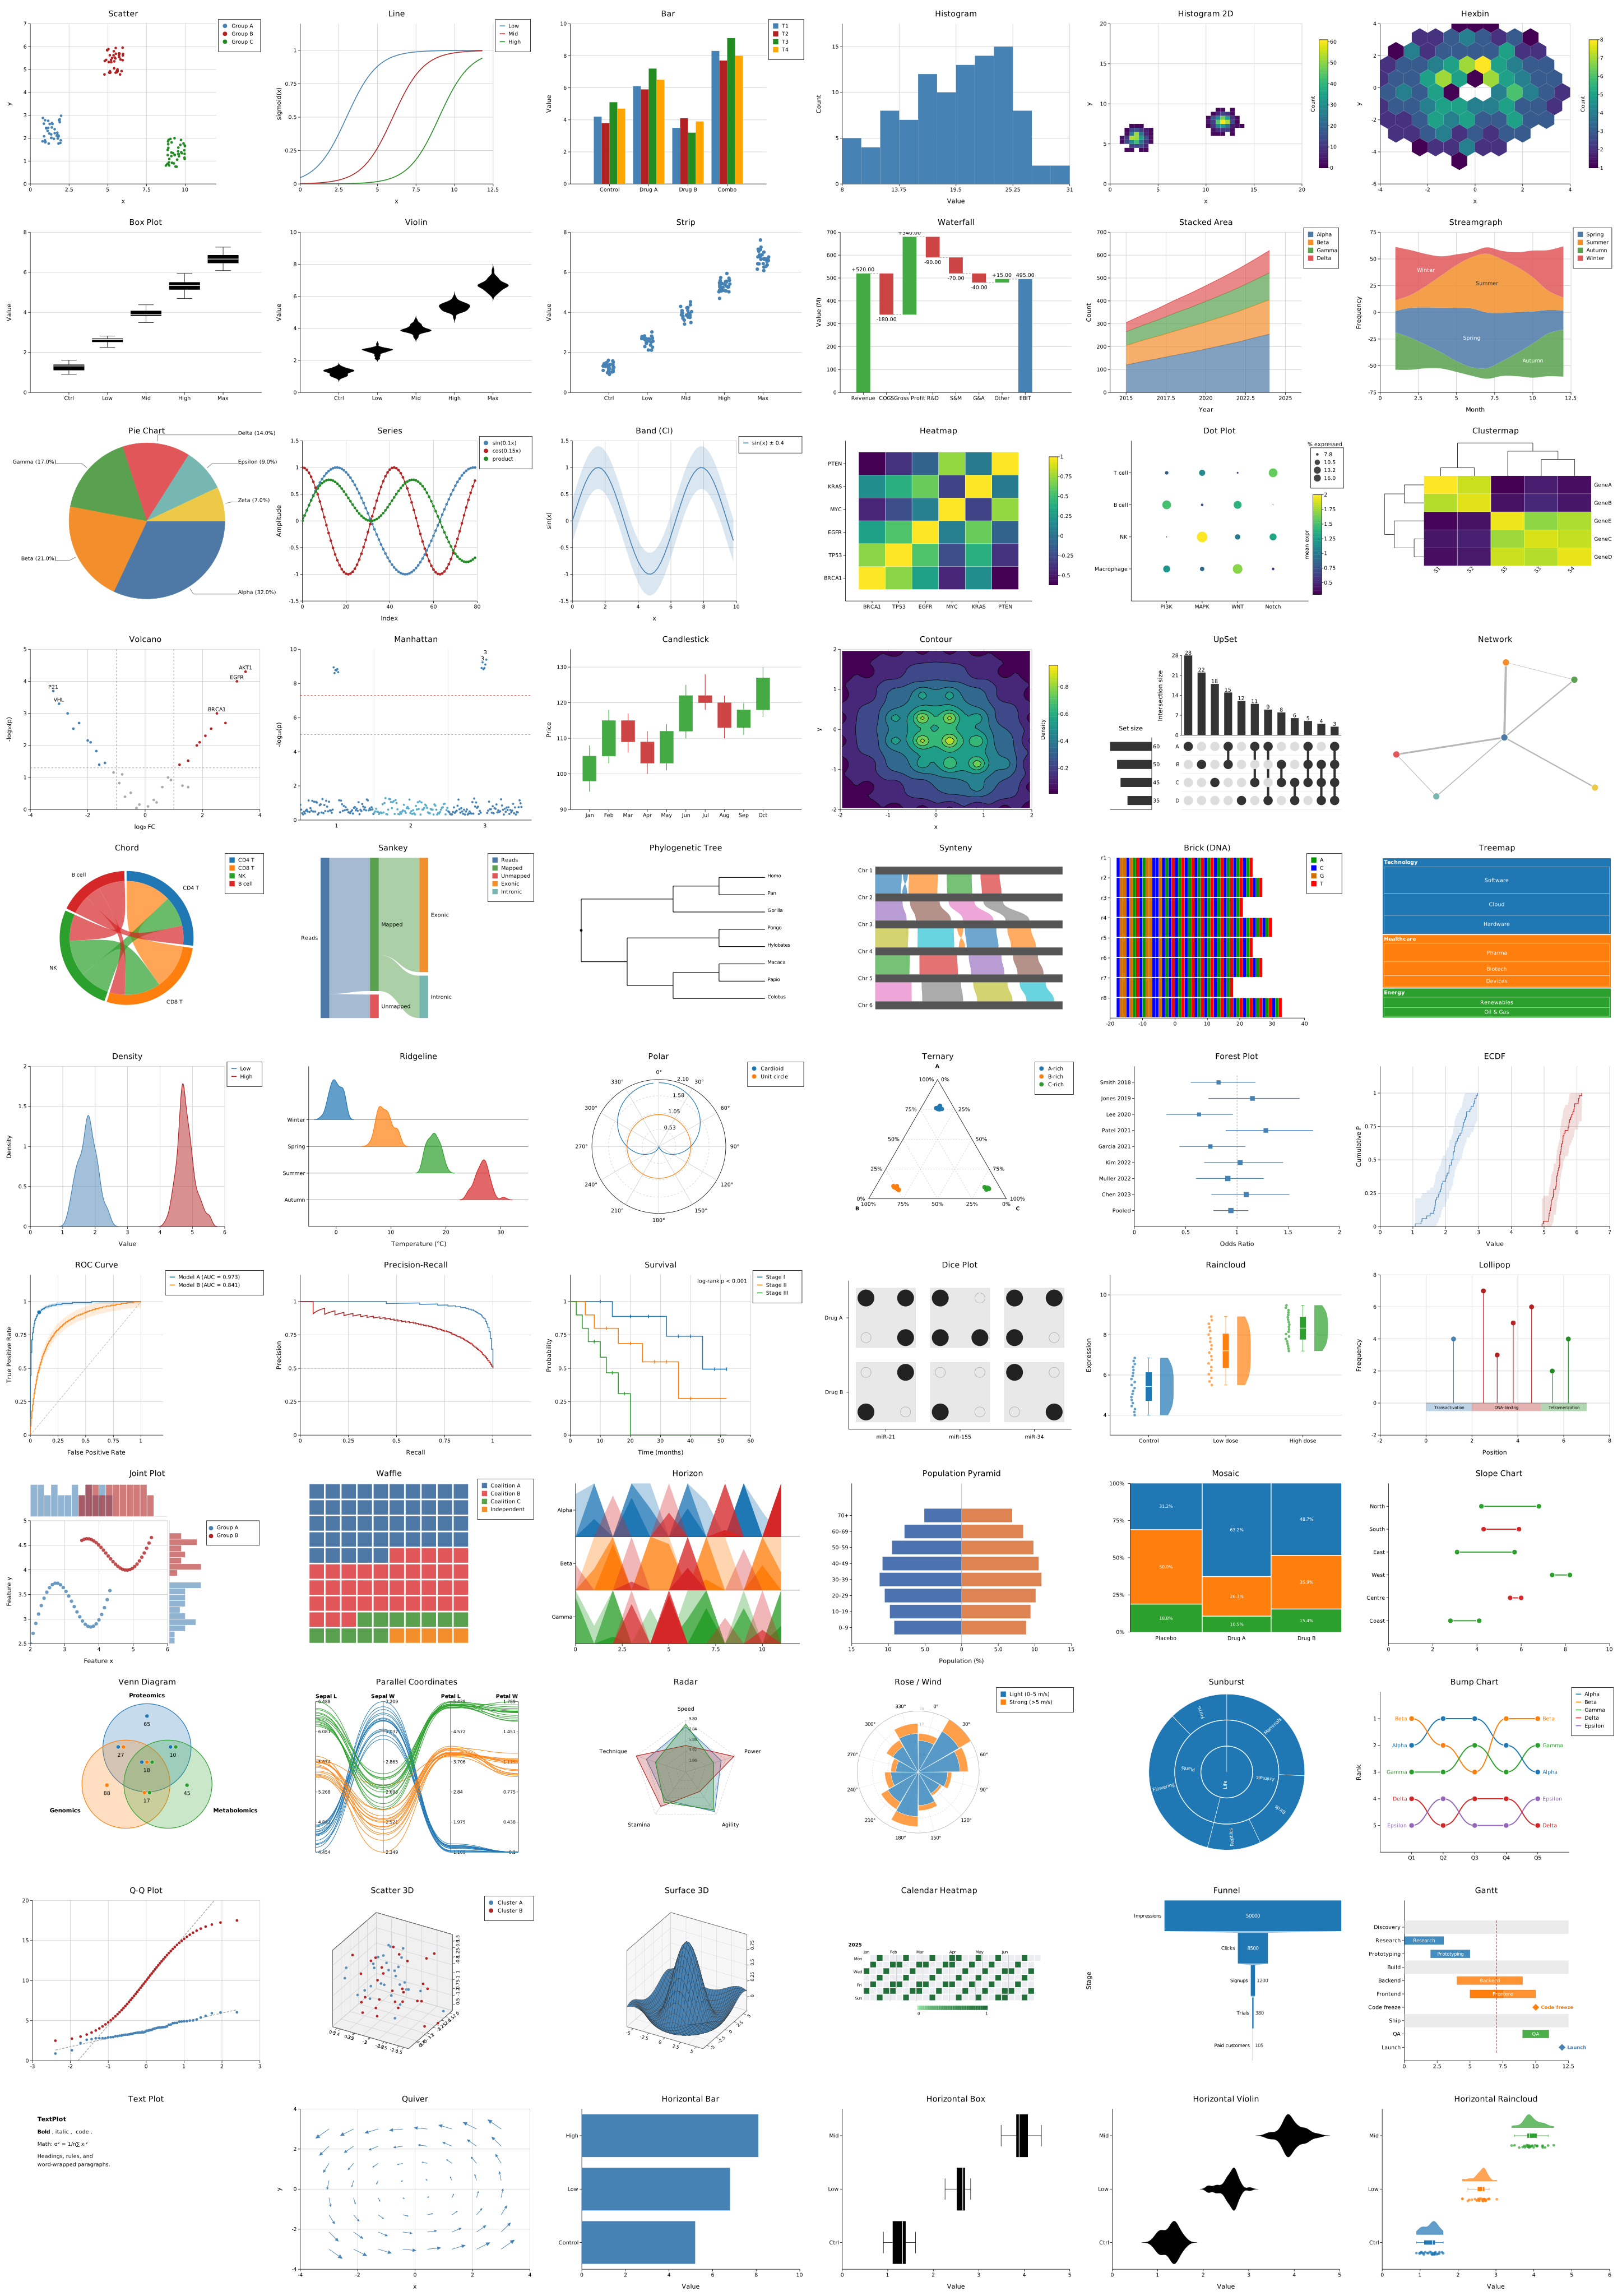
A scientific plotting library in Rust. 64 plot types, SVG output, optional PNG/PDF backends, and a CLI binary that renders plots directly from the shell — including in the terminal itself.

Step 1 — install Rust (skip if you already have cargo):
curl --proto '=https' --tlsv1.2 -sSf https://sh.rustup.rs | sh
# then restart your shell, or run:
source ~/.cargo/env
Step 2 — install kuva:
# From crates.io — installs to ~/.cargo/bin/ (on your $PATH after rustup setup)
cargo install kuva --features cli

# From a local clone — SVG output only
cargo install --path . --features cli

# From a local clone — with PNG and PDF output
cargo install --path . --features cli,full
After installation, kuva is available anywhere in your shell — no need to reference ./target/release/kuva or set any paths manually.
Add to Cargo.toml:
[dependencies]
kuva = "0.6"

# Optional backends
kuva = { version = "0.6", features = ["png"] }   # PNG output
kuva = { version = "0.6", features = ["pdf"] }   # PDF output — requires Rust >= 1.92 (higher than kuva's own MSRV; see below)
kuva = { version = "0.6", features = ["full"] }  # PNG + PDF

# Opt-in extras (deliberately not in `full`)
kuva = { version = "0.6", features = ["typst-math"] }  # typeset $...$ math via the Typst compiler — requires Rust >= 1.89
kuva = { version = "0.6", features = ["typst"] }       # emit .typ markup for external `typst compile`
Note on the
krilla(the maintained successor to the now-archivedsvg2pdf), which requires Rust >= 1.92. This isn't reflected in kuva's crate-levelrust-version— doing so would force every kuva user, including ones who never enablefull, kuva itself still only needs Rust 1.87.
Then in Rust:
use kuva::prelude::*;

let plot = ScatterPlot::new()
    .with_data(vec![(1.0_f64, 2.0), (3.0, 5.0), (5.0, 4.0)])
    .with_color("steelblue")
    .with_legend("samples");

let plots: Vec<Plot> = vec![plot.into()];
let layout = Layout::auto_from_plots(&plots)
    .with_title("My Plot")
    .with_x_label("X")
    .with_y_label("Y");

let svg = render_to_svg(plots, layout);
std::fs::write("my_plot.svg", svg).unwrap();
# Scatter plot to SVG
kuva scatter data.tsv --x x --y y -o plot.svg

# Volcano plot, label top 20 genes
kuva volcano gene_stats.tsv --name-col gene --x-col log2fc --y-col pvalue --top-n 20

# Ridgeline plot — stacked density curves, one per group
kuva ridgeline samples.tsv --group-by group --value expression --overlap 0.6

# Box plot rendered directly in the terminal
kuva box samples.tsv --group-col group --value-col expression --terminal
Input is auto-detected TSV or CSV. .parquet files are also supported. Columns are selectable by name or 0-based index. Pipe from stdin by omitting the file argument. Output defaults to SVG on stdout; use a .svg, .png, or .pdf extension with -o to write a file. Extensions are case-insensitive, and other extensions are rejected.
Full documentation — plot type reference, API guide, CLI flag reference, themes, palettes, and benchmarks — is at psy-fer.github.io/kuva.
Thank you to everyone who has contributed to kuva!
Other Rust plotting libraries worth knowing about:
kuva was initially built by hand, with a working library and several plot types already in place before AI tooling was introduced. From that point, development was heavily assisted by Claude (Anthropic) — accelerating the addition of new plot types, the CLI binary, tests, and documentation. The architecture, domain knowledge, and direction remain the author's own; Claude was used as an accelerant, not an author.
This disclaimer was written by Claude as an honest assessment of its own role in the project.
MIT
(top 24 of 52)
488 followers · starred Mar 2026
1,432 followers · starred Mar 2026
458 followers · starred Mar 2026
5,107 followers · starred Oct 2026
A scientific plotting library in Rust
See the code
A scientific plotting library in Rust. 64 plot types, SVG output, optional PNG/PDF backends, and a CLI binary that renders plots directly from the shell — including in the terminal itself.
Step 1 — install Rust (skip if you already have cargo):
curl --proto '=https' --tlsv1.2 -sSf https://sh.rustup.rs | sh
# then restart your shell, or run:
source ~/.cargo/env
Step 2 — install kuva:
# From crates.io — installs to ~/.cargo/bin/ (on your $PATH after rustup setup)
cargo install kuva --features cli

# From a local clone — SVG output only
cargo install --path . --features cli

# From a local clone — with PNG and PDF output
cargo install --path . --features cli,full
After installation, kuva is available anywhere in your shell — no need to reference ./target/release/kuva or set any paths manually.
Add to Cargo.toml:
[dependencies]
kuva = "0.6"

# Optional backends
kuva = { version = "0.6", features = ["png"] }   # PNG output
kuva = { version = "0.6", features = ["pdf"] }   # PDF output — requires Rust >= 1.92 (higher than kuva's own MSRV; see below)
kuva = { version = "0.6", features = ["full"] }  # PNG + PDF

# Opt-in extras (deliberately not in `full`)
kuva = { version = "0.6", features = ["typst-math"] }  # typeset $...$ math via the Typst compiler — requires Rust >= 1.89
kuva = { version = "0.6", features = ["typst"] }       # emit .typ markup for external `typst compile`
Note on the
krilla(the maintained successor to the now-archivedsvg2pdf), which requires Rust >= 1.92. This isn't reflected in kuva's crate-levelrust-version— doing so would force every kuva user, including ones who never enablefull, kuva itself still only needs Rust 1.87.
Then in Rust:
use kuva::prelude::*;

let plot = ScatterPlot::new()
    .with_data(vec![(1.0_f64, 2.0), (3.0, 5.0), (5.0, 4.0)])
    .with_color("steelblue")
    .with_legend("samples");

let plots: Vec<Plot> = vec![plot.into()];
let layout = Layout::auto_from_plots(&plots)
    .with_title("My Plot")
    .with_x_label("X")
    .with_y_label("Y");

let svg = render_to_svg(plots, layout);
std::fs::write("my_plot.svg", svg).unwrap();
# Scatter plot to SVG
kuva scatter data.tsv --x x --y y -o plot.svg

# Volcano plot, label top 20 genes
kuva volcano gene_stats.tsv --name-col gene --x-col log2fc --y-col pvalue --top-n 20

# Ridgeline plot — stacked density curves, one per group
kuva ridgeline samples.tsv --group-by group --value expression --overlap 0.6

# Box plot rendered directly in the terminal
kuva box samples.tsv --group-col group --value-col expression --terminal
Input is auto-detected TSV or CSV. .parquet files are also supported. Columns are selectable by name or 0-based index. Pipe from stdin by omitting the file argument. Output defaults to SVG on stdout; use a .svg, .png, or .pdf extension with -o to write a file. Extensions are case-insensitive, and other extensions are rejected.
Full documentation — plot type reference, API guide, CLI flag reference, themes, palettes, and benchmarks — is at psy-fer.github.io/kuva.
Thank you to everyone who has contributed to kuva!
Other Rust plotting libraries worth knowing about:
kuva was initially built by hand, with a working library and several plot types already in place before AI tooling was introduced. From that point, development was heavily assisted by Claude (Anthropic) — accelerating the addition of new plot types, the CLI binary, tests, and documentation. The architecture, domain knowledge, and direction remain the author's own; Claude was used as an accelerant, not an author.
This disclaimer was written by Claude as an honest assessment of its own role in the project.
MIT
(top 24 of 52)
488 followers · starred Mar 2026
1,432 followers · starred Mar 2026
458 followers · starred Mar 2026
5,107 followers · starred Oct 2026