Fast terminal-first EVM execution trace explorer for developers, auditors, and security researchers.
Rust
2
11 commits
updated Oct 17, 2026
A terminal-first EVM transaction trace explorer by Ghost Labs.
Created and maintained by Genadi Avetisov, Founder of Ghost Labs.
evmtrace-tui turns EVM transaction traces into an interactive terminal UI for exploring nested calls, reverts, gas usage, function selectors, and storage changes.
Project: EVMTraceX
GitHub: GhostLabs-dot
LinkedIn: Genadi Avetisov
Company: Ghost Labs
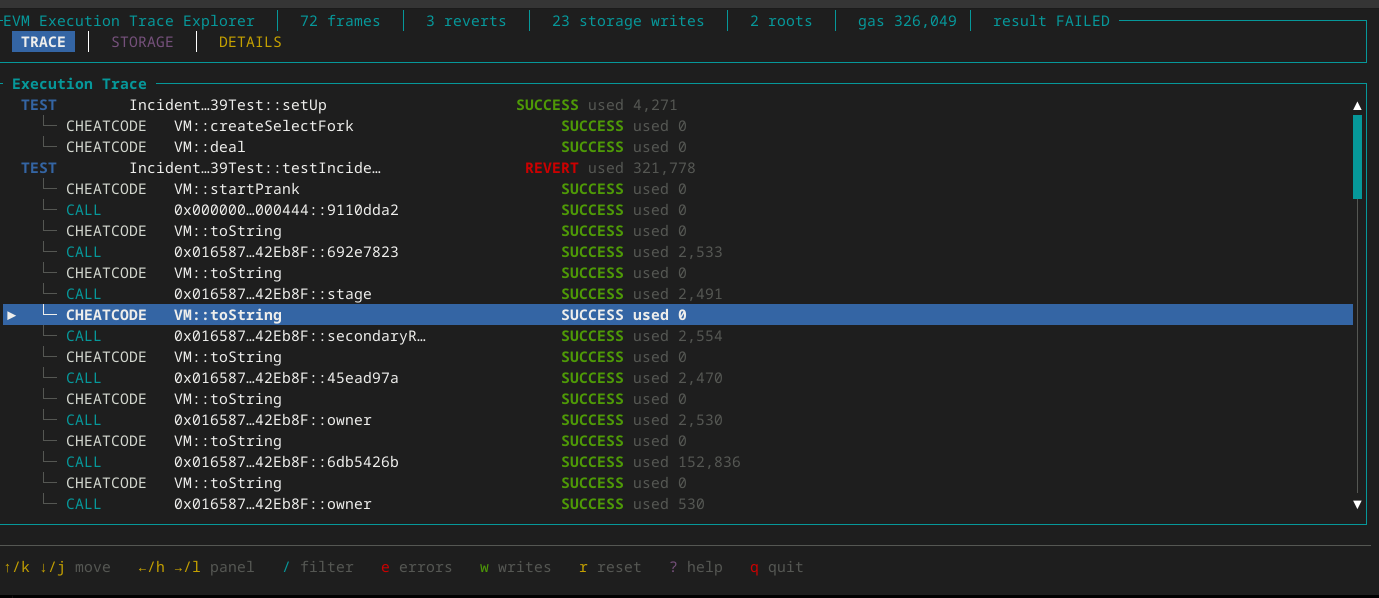
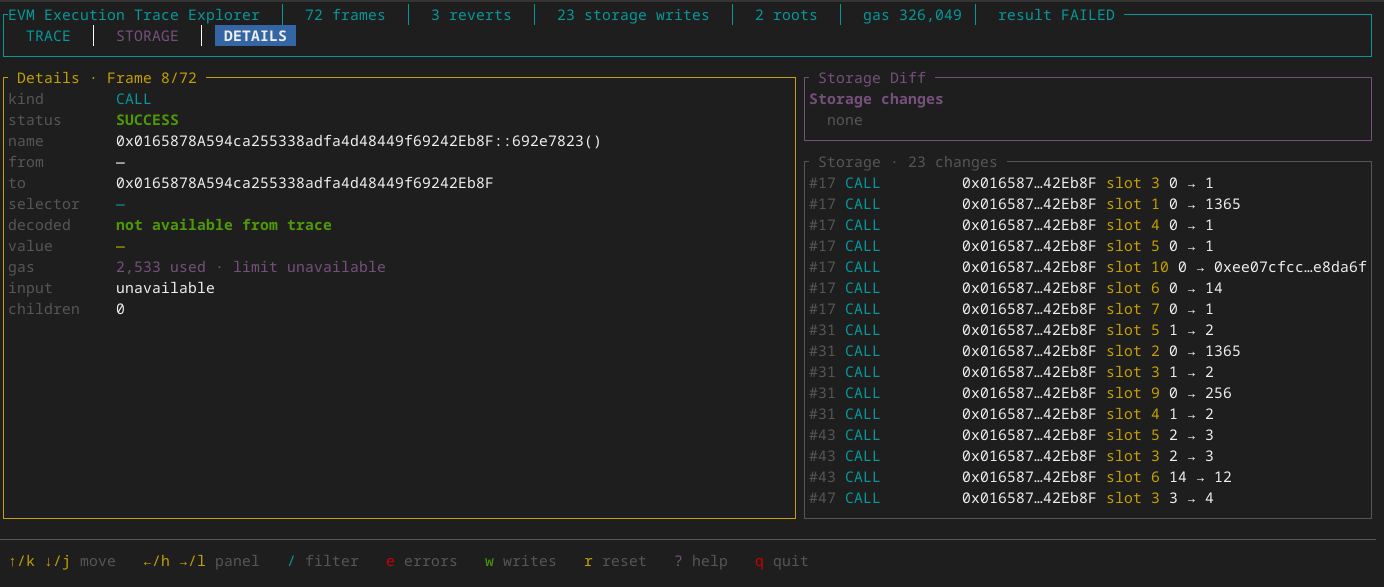
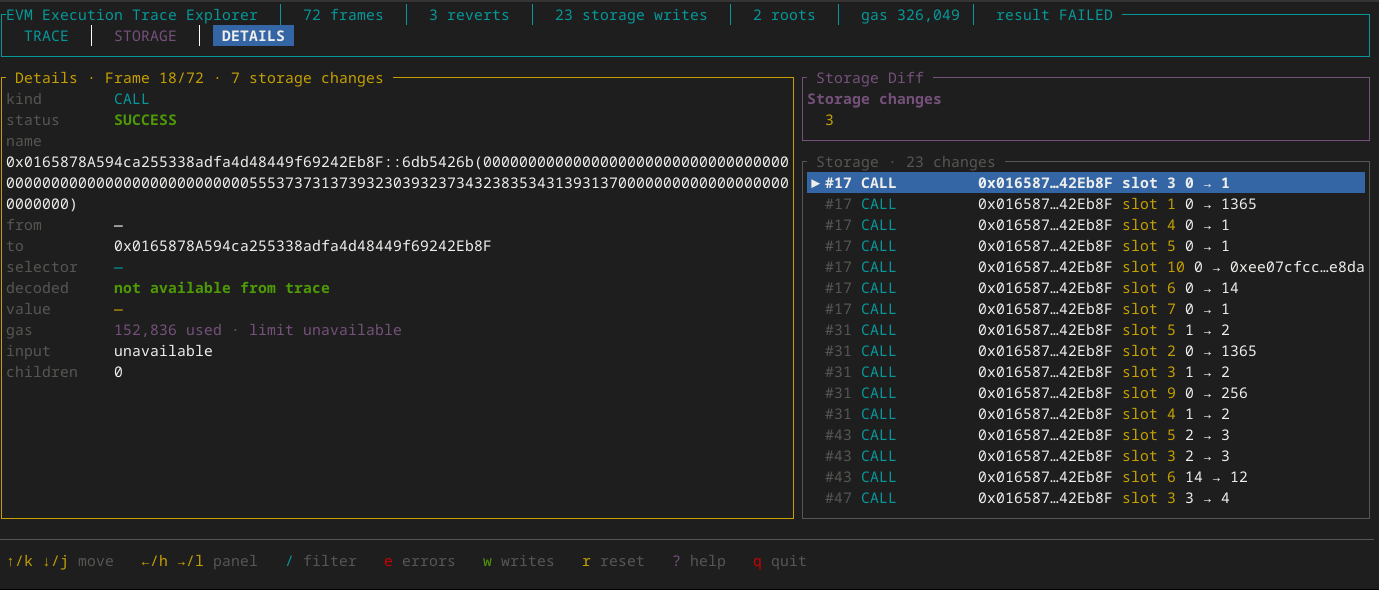
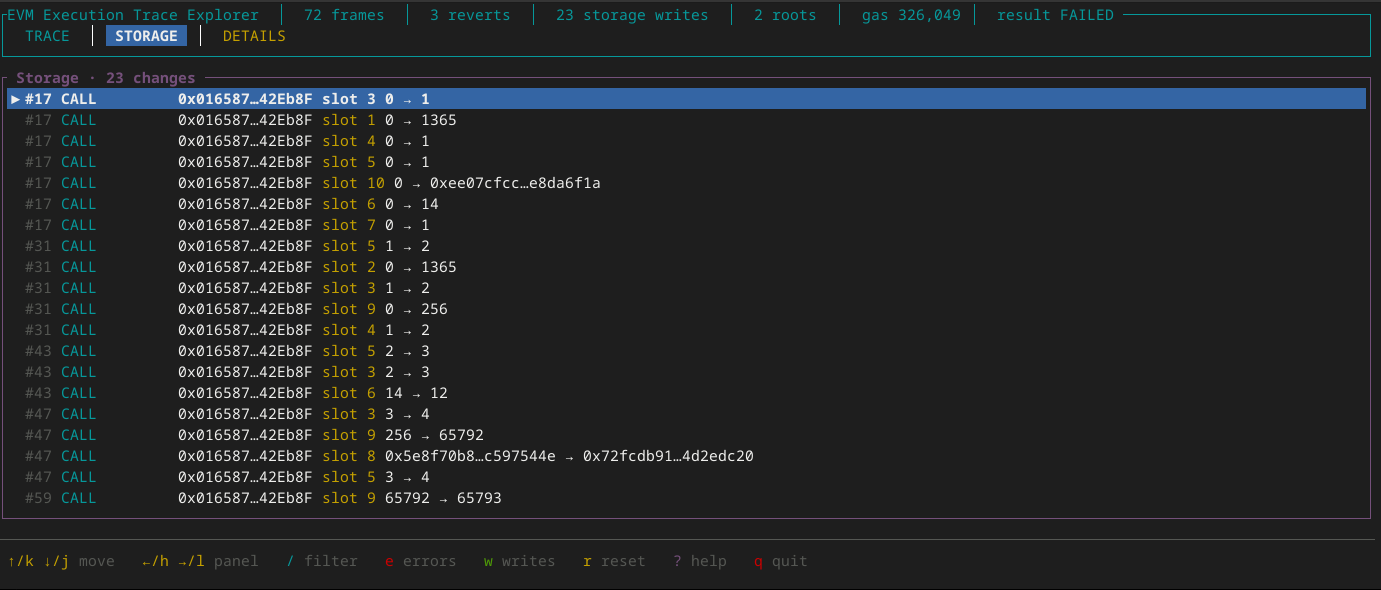
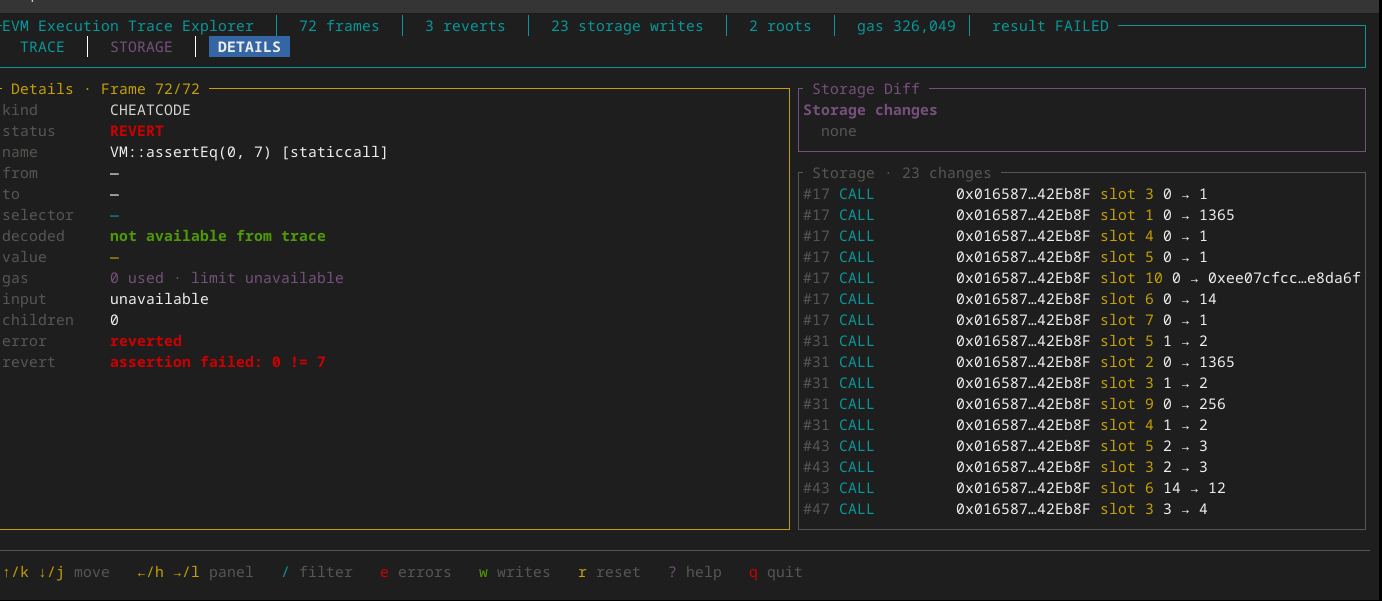
evmtrace-tui parses supported EVM execution traces into a structured call tree and presents them through a keyboard-driven terminal interface.
You can:
CALL, STATICCALL, DELEGATECALL, CALLCODE, CREATE, CREATE2, and SELFDESTRUCT frames;debug_traceTransaction when an RPC endpoint is explicitly supplied.The application is terminal-first and local by default. Network access is used only when the RPC mode is explicitly selected.
The TRACE panel displays the parsed execution structure as a hierarchical call tree.
Supported frame types include:
CALLSTATICCALLDELEGATECALLCALLCODECREATECREATE2SELFDESTRUCTTESTCHEATCODEUNKNOWNFor each frame, the interface can expose:
Nested calls remain attached to their parent frame, preserving execution structure.
-vvvv tracesFoundry execution traces can be loaded directly from the text produced by:
forge test -vvvv > foundry-trace.txt
For storage-change output, use:
forge test -vvvvv > foundry-trace.txt
Then open the trace:
./target/release/evmtrace-tui --foundry foundry-trace.txt
The parser understands Foundry trace sections beginning with:
Traces:
and preserves individual traced tests as separate roots.
For example:
Foundry output
    │
    ├── CounterTest::test_First()
    │     ├── Counter::increment()
    │     └── Counter::number() [staticcall]
    │
    └── CounterTest::test_Second()
          └── Counter::balance()
This prevents gas totals and execution structure from different tests being merged into one artificial root.
Foundry labels such as:
CounterTest::test_Increment()
Counter::increment()
Token::balanceOf(...)
are retained in the trace model and shown in the UI.
Recognized Foundry markers such as:
[staticcall]
[delegatecall]
[callcode]
are mapped to the corresponding CallKind.
Return and revert markers are associated with the execution frame that produced them.
Foundry text traces are normalized conservatively rather than reconstructed into fields that are not explicitly present.
Foundry VM::... cheatcodes are represented as CHEATCODE frames. The Foundry test invocation root is represented as TEST. These frames are kept separate from actual EVM call kinds.
When a Foundry label contains an explicit 20-byte address before ::, that address is preserved as the frame target, and a known parent target may be used as the child caller.
Available frame gas is shown as gas used. A gas limit is not inferred from the text trace.
Raw calldata is not fabricated from a human-readable function label. When calldata is absent, selector and input size are shown as unavailable rather than zero.
The original human-readable Foundry label is preserved.
Foundry -vvvvv storage-change lines are parsed into the normalized storage_diff representation.
callTracer JSONThe primary structured input format is a Geth-style call-frame tree.
Example:
{
  "type": "CALL",
  "from": "0x1111111111111111111111111111111111111111",
  "to": "0x2222222222222222222222222222222222222222",
  "value": "0x0",
  "gas": "0x5208",
  "gasUsed": "0x1f40",
  "input": "0xa9059cbb...",
  "output": "0x",
  "calls": [
    {
      "type": "DELEGATECALL",
      "from": "0x2222222222222222222222222222222222222222",
      "to": "0x3333333333333333333333333333333333333333",
      "gas": "0x4000",
      "gasUsed": "0x1200",
      "input": "0x..."
    }
  ]
}
A JSON-RPC wrapper containing the trace under result is accepted as well:
{
  "jsonrpc": "2.0",
  "id": 1,
  "result": {
    "type": "CALL",
    "from": "0x...",
    "to": "0x...",
    "input": "0x...",
    "gas": "0x...",
    "gasUsed": "0x...",
    "calls": []
  }
}
The parser is intentionally focused on the call-frame tree model.
Opcode-level structLogs traces are not currently supported.
A completed transaction can be traced directly through a supplied JSON-RPC endpoint:
./target/release/evmtrace-tui \
  --tx 0x0123456789abcdef0123456789abcdef0123456789abcdef0123456789abcdef \
  --rpc https://your-rpc-endpoint
The application requests:
debug_traceTransaction
using the Geth-style:
{
  "tracer": "callTracer"
}
The transaction hash must be a valid 32-byte hexadecimal value beginning with 0x.
The supplied RPC endpoint must support the required debug/tracing method.
The application does not contact an RPC endpoint when a local trace file or Foundry trace file is used.
Function selectors are derived from the first four bytes of calldata.
For example:
0xa9059cbb
is recognized as:
transfer(address,uint256)
The built-in selector table currently includes commonly encountered ERC-20, ownership, and proxy functions such as:
transfer(address,uint256)
transferFrom(address,address,uint256)
approve(address,uint256)
balanceOf(address)
allowance(address,address)
totalSupply()
name()
symbol()
decimals()
mint(address,uint256)
safeTransferFrom(address,address,uint256)
safeTransferFrom(address,address,uint256,bytes)
upgradeTo(address)
upgradeToAndCall(address,bytes)
admin()
implementation()
proxiableUUID()
renounceOwnership()
owner()
transferOwnership(address)
For project-specific contracts, an ABI can be supplied:
./target/release/evmtrace-tui \
  examples/sample_trace.json \
  --abi path/to/Contract.json
Both of the following are supported:
[
  {
    "type": "function",
    "name": "transfer",
    "inputs": [
      {
        "name": "to",
        "type": "address"
      },
      {
        "name": "amount",
        "type": "uint256"
      }
    ]
  }
]
{
  "abi": [
    {
      "type": "function",
      "name": "transfer",
      "inputs": [
        {
          "name": "to",
          "type": "address"
        },
        {
          "name": "amount",
          "type": "uint256"
        }
      ]
    }
  ]
}
Canonical ABI type handling also supports tuple definitions when constructing function signatures.
The current implementation decodes function selectors into signatures.
It does not yet decode arbitrary calldata arguments into typed values.
The STORAGE panel provides a trace-wide view of storage modifications.
Frame-local storage changes are also displayed in the DETAILS panel.
The normalized trace model supports the project's storageDiff extension:
{
  "storageDiff": {
    "0x01": [
      "0x0000000000000000000000000000000000000000000000000000000000000000",
      "0x0000000000000000000000000000000000000000000000000000000000000012"
    ]
  }
}
The parser also accepts the equivalent object representation:
{
  "storageDiff": {
    "0x01": {
      "before": "0x0000000000000000000000000000000000000000000000000000000000000000",
      "after": "0x0000000000000000000000000000000000000000000000000000000000000012"
    }
  }
}
A top-level storageDiffs map keyed by frame ID is supported as well.
These storage fields are extensions of the normalized trace model and are not required fields in a standard Geth callTracer response.
A frame is displayed as:
SUCCESS
when neither an execution error nor a revert reason is present.
A frame is displayed as:
REVERT
when either error or revertReason is populated.
When a revert reason is available, it is preserved and displayed in the DETAILS panel.
Foundry return and revert markers are mapped into the same normalized model so the UI can inspect them consistently alongside structured JSON traces.
The interface is intentionally compact and terminal-first.
┌───────────────────────────────────────────────────────────────────────┐
│ evmtrace-tui │ 8 frames │ 1 reverts │ 1 storage writes │ 1 roots     │
├───────────────────────────────────────────────────────────────────────┤
│ TRACE                 STORAGE                 DETAILS                 │
├───────────────────────────────────────────────────────────────────────┤
│                                                                       │
│ ▶ CALL          0x2222…1111   0x........  SUCCESS   gas  12,450      │
│   ├─ CALL      0x3333…4444   0xa9059cbb  SUCCESS   gas   8,192      │
│   ├─ CALL      0x5555…6666   0x........  REVERT    gas   4,096      │
│   └─ DELEGATECALL 0x6666…77  0x8da5cb5b  SUCCESS   gas   7,840      │
│       └─ STATICCALL 0x7777…  0x70a08231  SUCCESS   gas   2,048      │
│                                                                       │
├───────────────────────────────────────────────────────────────────────┤
│ ↑/k ↓/j move · ←/h →/l panel · / filter · e errors · w writes        │
│ Frame 1/8 · TRACE · 1 roots · Ready                                  │
└───────────────────────────────────────────────────────────────────────┘
The application has three primary panels:
TRACEThe execution tree and frame navigation view.
STORAGETrace-wide storage modifications associated with execution frames.
DETAILSDetailed information about the currently selected frame.
| Key | Action |
|---|---|
↑ / k | Move to previous frame |
↓ / j | Move to next frame |
← / h | Previous panel |
→ / l | Next panel |
Tab | Next panel |
Shift+Tab | Previous panel |
Home | First frame |
End | Last frame |
PageUp | Move up by 10 frames |
PageDown | Move down by 10 frames |
Enter | Open the Details panel |
Physical arrow keys are supported directly.
Use / to enter text-filter mode.
| Key | Action |
|---|---|
/ | Enter text filter mode |
Enter | Apply the filter |
Backspace | Remove the previous filter character |
e | Toggle reverted frames only |
w | Toggle frames with storage changes |
r | Clear all filters |
Esc | Cancel text-filter input |
Ctrl+C | Clear the active text filter |
The text filter is matched against frame display names, sender addresses, target addresses, and selectors.
Filtering operates on the normalized trace model rather than the original input text.
| Key | Action |
|---|---|
? | Open help |
Esc | Close help / exit normal mode |
q | Quit |
Ctrl+C | Quit in normal mode |
Clone or enter the project directory and build it:
cargo build --release
Run the included example:
./target/release/evmtrace-tui examples/sample_trace.json
Or directly through Cargo:
cargo run -- examples/sample_trace.json
With an ABI:
./target/release/evmtrace-tui \
  examples/sample_trace.json \
  --abi path/to/Contract.json
With a Foundry trace:
forge test -vvvv > foundry-trace.txt

./target/release/evmtrace-tui \
  --foundry foundry-trace.txt
With a Foundry trace and ABI:
./target/release/evmtrace-tui \
  --foundry foundry-trace.txt \
  --abi path/to/Contract.json
With a remote transaction:
./target/release/evmtrace-tui \
  --tx 0x0123456789abcdef0123456789abcdef0123456789abcdef0123456789abcdef \
  --rpc https://your-rpc-endpoint
All supported inputs are normalized into a common document model.
TraceDocument
│
├── root
│   └── TraceNode
│       ├── TraceNode
│       ├── TraceNode
│       └── ...
│
└── root
    └── TraceNode
        └── ...
A normal Geth or RPC transaction contains one root and no external test outcome metadata.
A Foundry file may contain multiple roots, allowing separate traced tests to remain independent. When Foundry reports a final Suite result, the normalized document preserves the aggregate pass/fail outcome separately from individual EVM frame status.
Each TraceNode contains the execution information needed by the application:
TraceNode
├── id
├── depth
├── kind
├── label
├── from
├── to
├── input
├── output
├── value
├── gas
├── gas_used
├── error
├── revert_reason
├── storage_diff
└── calls
This normalized representation keeps parsing separate from application state and rendering.
The project is intentionally split into small, focused layers:
                         INPUT SOURCES
                              │
               ┌──────────────┼──────────────┐
               │              │              │
               ▼              ▼              ▼
           Geth JSON       Foundry       JSON-RPC
                              │              │
               └──────────────┼──────────────┘
                              ▼
                       ┌─────────────┐
                       │  parser.rs  │
                       └──────┬──────┘
                              │
                              ▼
                       ┌─────────────┐
                       │  model.rs   │
                       │             │
                       │ Document    │
                       │ TraceNode   │
                       │ Stats       │
                       └──────┬──────┘
                              │
                 ┌────────────┼────────────┐
                 ▼            ▼            ▼
            selector.rs    app.rs        filters
                 │            │
                 └────────────┼───────────┘
                              ▼
                         ┌──────────┐
                         │  ui.rs   │
                         │ ratatui  │
                         └──────────┘
parser.rsHandles:
debug_traceTransaction;-vvvv parsing;model.rsDefines:
CallKind;StorageChange;TraceNode;TraceDocument;TraceOutcome;Stats.app.rsMaintains:
selector.rsProvides:
ui.rsRenders:
main.rsProvides:
The project itself contains:
EVMTraceX/
├── .github/
│   └── workflows/
│       └── ci.yml
├── docs/
│   └── screenshots/
│       ├── 01-trace.png
│       ├── 02-details.png
│       ├── 03-storage.png
│       ├── 04-foundry.png
│       └── 05-overview.png
├── examples/
│   └── sample_trace.json
├── src/
│   ├── app.rs
│   ├── main.rs
│   ├── model.rs
│   ├── parser.rs
│   ├── selector.rs
│   └── ui.rs
├── .gitignore
├── CHANGELOG.md
├── CONTRIBUTING.md
├── Cargo.toml
├── LICENSE
├── README.md
└── rustfmt.toml
The current automated tests are located in src/main.rs; there is no separate tests/ directory.
The repository ships with:
examples/sample_trace.json
The fixture contains representative execution data including:
CALL;DELEGATECALL;STATICCALL;Run it with:
cargo run -- examples/sample_trace.json
The fixture is intended as a deterministic local starting point for exploring the UI and exercising parser behavior.
The project uses stable Rust and a small dependency footprint built around:
ratatui for the terminal UI;crossterm for terminal input/output;clap for command-line parsing;serde and serde_json for structured trace and ABI data;reqwest for optional RPC access;sha3 and hex for selector handling;anyhow for error propagation.cargo fmt
cargo check --all-targets
cargo test --all-targets
cargo clippy --all-targets --all-features -- -D warnings
cargo build --release
Before submitting changes, run:
cargo fmt
cargo fmt --all -- --check
git diff --check
cargo check --all-targets --locked
cargo clippy --all-targets --all-features --locked -- -D warnings
cargo test --all-targets --locked
cargo build --release --locked
cargo package --locked
cargo audit
The project CI verifies:
cargo fmt --all -- --check
cargo check --all-targets --locked
cargo clippy --all-targets --all-features --locked -- -D warnings
cargo test --all-targets --locked
cargo build --release --locked
cargo package --locked
cargo audit
The CI configuration is scoped to the TUI project and its workflow changes.
evmtrace-tui is intentionally focused on one job:
Make EVM execution traces fast to inspect from a terminal.
The project prioritizes:
It intentionally avoids turning the project into a full EVM framework.
evmtrace-tui is a trace explorer, not a vulnerability scanner.
It does not currently provide:
structLogs analysis;The application presents execution evidence for human inspection rather than automatically deciding what that evidence means.
structLogs and instruction-by-instruction execution are not currently parsed.
Function selectors can be mapped to function signatures, but arbitrary calldata arguments are not decoded into typed values.
Foundry text traces do not necessarily contain the same structured fields available in JSON call traces.
RPC mode depends on an endpoint that exposes debug_traceTransaction with callTracer support.
The current model focuses on execution call frames rather than full blockchain transaction metadata.
Local JSON and Foundry files are processed locally.
When RPC mode is used, the transaction hash is sent to the explicitly supplied RPC endpoint.
The application does not embed a default public RPC provider.
Users should treat transaction hashes and RPC endpoints according to the privacy and logging policies of the provider they choose.
Contributions are welcome.
When extending parser support, new input formats should be normalized into the existing trace model rather than adding format-specific rendering logic.
Parser and semantic changes should include focused tests or representative fixtures where practical.
See CONTRIBUTING.md for the project contribution guidelines.
EVM Execution Trace Explorer is created and maintained by Ghost Labs.
Author: Genadi Avetisov
Founder: Ghost Labs
The project is developed as part of Ghost Labs' broader work in EVM tooling, runtime analysis, and security research.
MIT License.
Copyright (c) 2026 Ghost Labs.
See LICENSE for the full license text.
The current package version is 0.1.0.
The project is intentionally kept focused: parse execution traces, preserve their structure, and make them easy to investigate from a terminal.
Geth callTracer JSON ─────┐
                          │
Foundry forge test -vvvv ─┼──► normalized trace model ──► terminal UI
                          │
debug_traceTransaction ───┘
Inspect the trace. Preserve the structure. Find the interesting frame.
Fast terminal-first EVM execution trace explorer for developers, auditors, and security researchers.
Rust
2
11 commits
updated Oct 17, 2026
A terminal-first EVM transaction trace explorer by Ghost Labs.
Created and maintained by Genadi Avetisov, Founder of Ghost Labs.
evmtrace-tui turns EVM transaction traces into an interactive terminal UI for exploring nested calls, reverts, gas usage, function selectors, and storage changes.
Project: EVMTraceX
GitHub: GhostLabs-dot
LinkedIn: Genadi Avetisov
Company: Ghost Labs
evmtrace-tui parses supported EVM execution traces into a structured call tree and presents them through a keyboard-driven terminal interface.
You can:
CALL, STATICCALL, DELEGATECALL, CALLCODE, CREATE, CREATE2, and SELFDESTRUCT frames;debug_traceTransaction when an RPC endpoint is explicitly supplied.The application is terminal-first and local by default. Network access is used only when the RPC mode is explicitly selected.
The TRACE panel displays the parsed execution structure as a hierarchical call tree.
Supported frame types include:
CALLSTATICCALLDELEGATECALLCALLCODECREATECREATE2SELFDESTRUCTTESTCHEATCODEUNKNOWNFor each frame, the interface can expose:
Nested calls remain attached to their parent frame, preserving execution structure.
-vvvv tracesFoundry execution traces can be loaded directly from the text produced by:
forge test -vvvv > foundry-trace.txt
For storage-change output, use:
forge test -vvvvv > foundry-trace.txt
Then open the trace:
./target/release/evmtrace-tui --foundry foundry-trace.txt
The parser understands Foundry trace sections beginning with:
Traces:
and preserves individual traced tests as separate roots.
For example:
Foundry output
    │
    ├── CounterTest::test_First()
    │     ├── Counter::increment()
    │     └── Counter::number() [staticcall]
    │
    └── CounterTest::test_Second()
          └── Counter::balance()
This prevents gas totals and execution structure from different tests being merged into one artificial root.
Foundry labels such as:
CounterTest::test_Increment()
Counter::increment()
Token::balanceOf(...)
are retained in the trace model and shown in the UI.
Recognized Foundry markers such as:
[staticcall]
[delegatecall]
[callcode]
are mapped to the corresponding CallKind.
Return and revert markers are associated with the execution frame that produced them.
Foundry text traces are normalized conservatively rather than reconstructed into fields that are not explicitly present.
Foundry VM::... cheatcodes are represented as CHEATCODE frames. The Foundry test invocation root is represented as TEST. These frames are kept separate from actual EVM call kinds.
When a Foundry label contains an explicit 20-byte address before ::, that address is preserved as the frame target, and a known parent target may be used as the child caller.
Available frame gas is shown as gas used. A gas limit is not inferred from the text trace.
Raw calldata is not fabricated from a human-readable function label. When calldata is absent, selector and input size are shown as unavailable rather than zero.
The original human-readable Foundry label is preserved.
Foundry -vvvvv storage-change lines are parsed into the normalized storage_diff representation.
callTracer JSONThe primary structured input format is a Geth-style call-frame tree.
Example:
{
  "type": "CALL",
  "from": "0x1111111111111111111111111111111111111111",
  "to": "0x2222222222222222222222222222222222222222",
  "value": "0x0",
  "gas": "0x5208",
  "gasUsed": "0x1f40",
  "input": "0xa9059cbb...",
  "output": "0x",
  "calls": [
    {
      "type": "DELEGATECALL",
      "from": "0x2222222222222222222222222222222222222222",
      "to": "0x3333333333333333333333333333333333333333",
      "gas": "0x4000",
      "gasUsed": "0x1200",
      "input": "0x..."
    }
  ]
}
A JSON-RPC wrapper containing the trace under result is accepted as well:
{
  "jsonrpc": "2.0",
  "id": 1,
  "result": {
    "type": "CALL",
    "from": "0x...",
    "to": "0x...",
    "input": "0x...",
    "gas": "0x...",
    "gasUsed": "0x...",
    "calls": []
  }
}
The parser is intentionally focused on the call-frame tree model.
Opcode-level structLogs traces are not currently supported.
A completed transaction can be traced directly through a supplied JSON-RPC endpoint:
./target/release/evmtrace-tui \
  --tx 0x0123456789abcdef0123456789abcdef0123456789abcdef0123456789abcdef \
  --rpc https://your-rpc-endpoint
The application requests:
debug_traceTransaction
using the Geth-style:
{
  "tracer": "callTracer"
}
The transaction hash must be a valid 32-byte hexadecimal value beginning with 0x.
The supplied RPC endpoint must support the required debug/tracing method.
The application does not contact an RPC endpoint when a local trace file or Foundry trace file is used.
Function selectors are derived from the first four bytes of calldata.
For example:
0xa9059cbb
is recognized as:
transfer(address,uint256)
The built-in selector table currently includes commonly encountered ERC-20, ownership, and proxy functions such as:
transfer(address,uint256)
transferFrom(address,address,uint256)
approve(address,uint256)
balanceOf(address)
allowance(address,address)
totalSupply()
name()
symbol()
decimals()
mint(address,uint256)
safeTransferFrom(address,address,uint256)
safeTransferFrom(address,address,uint256,bytes)
upgradeTo(address)
upgradeToAndCall(address,bytes)
admin()
implementation()
proxiableUUID()
renounceOwnership()
owner()
transferOwnership(address)
For project-specific contracts, an ABI can be supplied:
./target/release/evmtrace-tui \
  examples/sample_trace.json \
  --abi path/to/Contract.json
Both of the following are supported:
[
  {
    "type": "function",
    "name": "transfer",
    "inputs": [
      {
        "name": "to",
        "type": "address"
      },
      {
        "name": "amount",
        "type": "uint256"
      }
    ]
  }
]
{
  "abi": [
    {
      "type": "function",
      "name": "transfer",
      "inputs": [
        {
          "name": "to",
          "type": "address"
        },
        {
          "name": "amount",
          "type": "uint256"
        }
      ]
    }
  ]
}
Canonical ABI type handling also supports tuple definitions when constructing function signatures.
The current implementation decodes function selectors into signatures.
It does not yet decode arbitrary calldata arguments into typed values.
The STORAGE panel provides a trace-wide view of storage modifications.
Frame-local storage changes are also displayed in the DETAILS panel.
The normalized trace model supports the project's storageDiff extension:
{
  "storageDiff": {
    "0x01": [
      "0x0000000000000000000000000000000000000000000000000000000000000000",
      "0x0000000000000000000000000000000000000000000000000000000000000012"
    ]
  }
}
The parser also accepts the equivalent object representation:
{
  "storageDiff": {
    "0x01": {
      "before": "0x0000000000000000000000000000000000000000000000000000000000000000",
      "after": "0x0000000000000000000000000000000000000000000000000000000000000012"
    }
  }
}
A top-level storageDiffs map keyed by frame ID is supported as well.
These storage fields are extensions of the normalized trace model and are not required fields in a standard Geth callTracer response.
A frame is displayed as:
SUCCESS
when neither an execution error nor a revert reason is present.
A frame is displayed as:
REVERT
when either error or revertReason is populated.
When a revert reason is available, it is preserved and displayed in the DETAILS panel.
Foundry return and revert markers are mapped into the same normalized model so the UI can inspect them consistently alongside structured JSON traces.
The interface is intentionally compact and terminal-first.
┌───────────────────────────────────────────────────────────────────────┐
│ evmtrace-tui │ 8 frames │ 1 reverts │ 1 storage writes │ 1 roots     │
├───────────────────────────────────────────────────────────────────────┤
│ TRACE                 STORAGE                 DETAILS                 │
├───────────────────────────────────────────────────────────────────────┤
│                                                                       │
│ ▶ CALL          0x2222…1111   0x........  SUCCESS   gas  12,450      │
│   ├─ CALL      0x3333…4444   0xa9059cbb  SUCCESS   gas   8,192      │
│   ├─ CALL      0x5555…6666   0x........  REVERT    gas   4,096      │
│   └─ DELEGATECALL 0x6666…77  0x8da5cb5b  SUCCESS   gas   7,840      │
│       └─ STATICCALL 0x7777…  0x70a08231  SUCCESS   gas   2,048      │
│                                                                       │
├───────────────────────────────────────────────────────────────────────┤
│ ↑/k ↓/j move · ←/h →/l panel · / filter · e errors · w writes        │
│ Frame 1/8 · TRACE · 1 roots · Ready                                  │
└───────────────────────────────────────────────────────────────────────┘
The application has three primary panels:
TRACEThe execution tree and frame navigation view.
STORAGETrace-wide storage modifications associated with execution frames.
DETAILSDetailed information about the currently selected frame.
| Key | Action |
|---|---|
↑ / k | Move to previous frame |
↓ / j | Move to next frame |
← / h | Previous panel |
→ / l | Next panel |
Tab | Next panel |
Shift+Tab | Previous panel |
Home | First frame |
End | Last frame |
PageUp | Move up by 10 frames |
PageDown | Move down by 10 frames |
Enter | Open the Details panel |
Physical arrow keys are supported directly.
Use / to enter text-filter mode.
| Key | Action |
|---|---|
/ | Enter text filter mode |
Enter | Apply the filter |
Backspace | Remove the previous filter character |
e | Toggle reverted frames only |
w | Toggle frames with storage changes |
r | Clear all filters |
Esc | Cancel text-filter input |
Ctrl+C | Clear the active text filter |
The text filter is matched against frame display names, sender addresses, target addresses, and selectors.
Filtering operates on the normalized trace model rather than the original input text.
| Key | Action |
|---|---|
? | Open help |
Esc | Close help / exit normal mode |
q | Quit |
Ctrl+C | Quit in normal mode |
Clone or enter the project directory and build it:
cargo build --release
Run the included example:
./target/release/evmtrace-tui examples/sample_trace.json
Or directly through Cargo:
cargo run -- examples/sample_trace.json
With an ABI:
./target/release/evmtrace-tui \
  examples/sample_trace.json \
  --abi path/to/Contract.json
With a Foundry trace:
forge test -vvvv > foundry-trace.txt

./target/release/evmtrace-tui \
  --foundry foundry-trace.txt
With a Foundry trace and ABI:
./target/release/evmtrace-tui \
  --foundry foundry-trace.txt \
  --abi path/to/Contract.json
With a remote transaction:
./target/release/evmtrace-tui \
  --tx 0x0123456789abcdef0123456789abcdef0123456789abcdef0123456789abcdef \
  --rpc https://your-rpc-endpoint
All supported inputs are normalized into a common document model.
TraceDocument
│
├── root
│   └── TraceNode
│       ├── TraceNode
│       ├── TraceNode
│       └── ...
│
└── root
    └── TraceNode
        └── ...
A normal Geth or RPC transaction contains one root and no external test outcome metadata.
A Foundry file may contain multiple roots, allowing separate traced tests to remain independent. When Foundry reports a final Suite result, the normalized document preserves the aggregate pass/fail outcome separately from individual EVM frame status.
Each TraceNode contains the execution information needed by the application:
TraceNode
├── id
├── depth
├── kind
├── label
├── from
├── to
├── input
├── output
├── value
├── gas
├── gas_used
├── error
├── revert_reason
├── storage_diff
└── calls
This normalized representation keeps parsing separate from application state and rendering.
The project is intentionally split into small, focused layers:
                         INPUT SOURCES
                              │
               ┌──────────────┼──────────────┐
               │              │              │
               ▼              ▼              ▼
           Geth JSON       Foundry       JSON-RPC
                              │              │
               └──────────────┼──────────────┘
                              ▼
                       ┌─────────────┐
                       │  parser.rs  │
                       └──────┬──────┘
                              │
                              ▼
                       ┌─────────────┐
                       │  model.rs   │
                       │             │
                       │ Document    │
                       │ TraceNode   │
                       │ Stats       │
                       └──────┬──────┘
                              │
                 ┌────────────┼────────────┐
                 ▼            ▼            ▼
            selector.rs    app.rs        filters
                 │            │
                 └────────────┼───────────┘
                              ▼
                         ┌──────────┐
                         │  ui.rs   │
                         │ ratatui  │
                         └──────────┘
parser.rsHandles:
debug_traceTransaction;-vvvv parsing;model.rsDefines:
CallKind;StorageChange;TraceNode;TraceDocument;TraceOutcome;Stats.app.rsMaintains:
selector.rsProvides:
ui.rsRenders:
main.rsProvides:
The project itself contains:
EVMTraceX/
├── .github/
│   └── workflows/
│       └── ci.yml
├── docs/
│   └── screenshots/
│       ├── 01-trace.png
│       ├── 02-details.png
│       ├── 03-storage.png
│       ├── 04-foundry.png
│       └── 05-overview.png
├── examples/
│   └── sample_trace.json
├── src/
│   ├── app.rs
│   ├── main.rs
│   ├── model.rs
│   ├── parser.rs
│   ├── selector.rs
│   └── ui.rs
├── .gitignore
├── CHANGELOG.md
├── CONTRIBUTING.md
├── Cargo.toml
├── LICENSE
├── README.md
└── rustfmt.toml
The current automated tests are located in src/main.rs; there is no separate tests/ directory.
The repository ships with:
examples/sample_trace.json
The fixture contains representative execution data including:
CALL;DELEGATECALL;STATICCALL;Run it with:
cargo run -- examples/sample_trace.json
The fixture is intended as a deterministic local starting point for exploring the UI and exercising parser behavior.
The project uses stable Rust and a small dependency footprint built around:
ratatui for the terminal UI;crossterm for terminal input/output;clap for command-line parsing;serde and serde_json for structured trace and ABI data;reqwest for optional RPC access;sha3 and hex for selector handling;anyhow for error propagation.cargo fmt
cargo check --all-targets
cargo test --all-targets
cargo clippy --all-targets --all-features -- -D warnings
cargo build --release
Before submitting changes, run:
cargo fmt
cargo fmt --all -- --check
git diff --check
cargo check --all-targets --locked
cargo clippy --all-targets --all-features --locked -- -D warnings
cargo test --all-targets --locked
cargo build --release --locked
cargo package --locked
cargo audit
The project CI verifies:
cargo fmt --all -- --check
cargo check --all-targets --locked
cargo clippy --all-targets --all-features --locked -- -D warnings
cargo test --all-targets --locked
cargo build --release --locked
cargo package --locked
cargo audit
The CI configuration is scoped to the TUI project and its workflow changes.
evmtrace-tui is intentionally focused on one job:
Make EVM execution traces fast to inspect from a terminal.
The project prioritizes:
It intentionally avoids turning the project into a full EVM framework.
evmtrace-tui is a trace explorer, not a vulnerability scanner.
It does not currently provide:
structLogs analysis;The application presents execution evidence for human inspection rather than automatically deciding what that evidence means.
structLogs and instruction-by-instruction execution are not currently parsed.
Function selectors can be mapped to function signatures, but arbitrary calldata arguments are not decoded into typed values.
Foundry text traces do not necessarily contain the same structured fields available in JSON call traces.
RPC mode depends on an endpoint that exposes debug_traceTransaction with callTracer support.
The current model focuses on execution call frames rather than full blockchain transaction metadata.
Local JSON and Foundry files are processed locally.
When RPC mode is used, the transaction hash is sent to the explicitly supplied RPC endpoint.
The application does not embed a default public RPC provider.
Users should treat transaction hashes and RPC endpoints according to the privacy and logging policies of the provider they choose.
Contributions are welcome.
When extending parser support, new input formats should be normalized into the existing trace model rather than adding format-specific rendering logic.
Parser and semantic changes should include focused tests or representative fixtures where practical.
See CONTRIBUTING.md for the project contribution guidelines.
EVM Execution Trace Explorer is created and maintained by Ghost Labs.
Author: Genadi Avetisov
Founder: Ghost Labs
The project is developed as part of Ghost Labs' broader work in EVM tooling, runtime analysis, and security research.
MIT License.
Copyright (c) 2026 Ghost Labs.
See LICENSE for the full license text.
The current package version is 0.1.0.
The project is intentionally kept focused: parse execution traces, preserve their structure, and make them easy to investigate from a terminal.
Geth callTracer JSON ─────┐
                          │
Foundry forge test -vvvv ─┼──► normalized trace model ──► terminal UI
                          │
debug_traceTransaction ───┘
Inspect the trace. Preserve the structure. Find the interesting frame.



