
A Python wrapper for the NOAA CO-OPS Tides & Currents Data and Metadata APIs.
Python
101
314 commits
updated Sep 21, 2026
README
noaa_coops






A Python wrapper for the NOAA CO-OPS Tides & Currents Data, Metadata, and Derived Product APIs.
Installation
Supported on Python 3.11, 3.12, and 3.13.
uv add noaa-coops
Or with pip:
pip install noaa-coops
Getting started
Stations
Data is accessed via Station objects identified by a NOAA station id:
>>> from noaa_coops import Station
>>> seattle = Station(id="9447130")  # Seattle, WA
Find station IDs via the NOAA Tides & Currents mapping interface or search by bounding box:
>>> from noaa_coops import get_stations_from_bbox, Station
>>> stations = get_stations_from_bbox(
...     lat_coords=[40.389, 40.9397],
...     lon_coords=[-74.4751, -73.7432],
... )
>>> stations
['8516945', '8518750', '8531680']
>>> Station(id="8516945").name
'Kings Point'
Metadata
Station metadata lives on the .metadata attribute, and individual fields are
also promoted to top-level attributes on the Station object:
>>> seattle = Station(id="9447130")
>>> seattle.name
'Seattle'
>>> seattle.state
'WA'
>>> seattle.lat_lon
{'lat': 47.60264, 'lon': -122.3393}
Current prediction stations with multiple bins (e.g. depth bins along a
current meter mooring) expose every bin's prediction offsets, keyed by
currbin number, via .current_pred_offsets_by_bin. The scalar attributes
(curr_bin, current_pred_offsets) only describe the first bin:
>>> act = Station(id="ACT0921")  # has three current bins
>>> act.current_pred_offsets_by_bin
{1: {'id': 'ACT0921',
  'refStationId': 'BOS1111',
  'refStationBin': 14,
  'meanFloodDir': 239.0,
  'meanEbbDir': 63.0,
  'mfcTimeAdjMin': 60,
  'sbeTimeAdjMin': 37,
  'mecTimeAdjMin': -13,
  'sbfTimeAdjMin': 44,
  'mfcAmpAdj': 0.4,
  'mecAmpAdj': 0.4,
  'self': '...'},
 2: {'id': 'ACT0921', 'refStationId': 'BOS1111', ...},
 3: {'id': 'ACT0921', 'refStationId': 'BOS1111', ...}}
Data inventory
Per-product first/last observation dates:
>>> seattle.data_inventory["Wind"]
{'start_date': '1991-11-09 00:00', 'end_date': '...'}
Note: The data inventory comes from NOAA's legacy SOAP endpoint and is best-effort. If the service is unreachable,
data_inventoryis set to{}and a warning is logged —Station()construction still succeeds.
Data retrieval
Data is returned as a pandas DataFrame indexed by timestamp. Column names
mirror NOAA's response format.
>>> seattle = Station(id="9447130")
>>> df = seattle.get_data(
...     begin_date="20150101",
...     end_date="20150131",
...     product="water_level",
...     datum="MLLW",
...     units="metric",
...     time_zone="gmt",
... )
>>> df.head()
                         v      s        f  q
t
2015-01-01 00:00:00  1.799  0.023  0,0,0,0  v
2015-01-01 00:06:00  1.718  0.018  0,0,0,0  v
2015-01-01 00:12:00  1.639  0.013  0,0,0,0  v
2015-01-01 00:18:00  1.557  0.012  0,0,0,0  v
2015-01-01 00:24:00  1.473  0.014  0,0,0,0  v
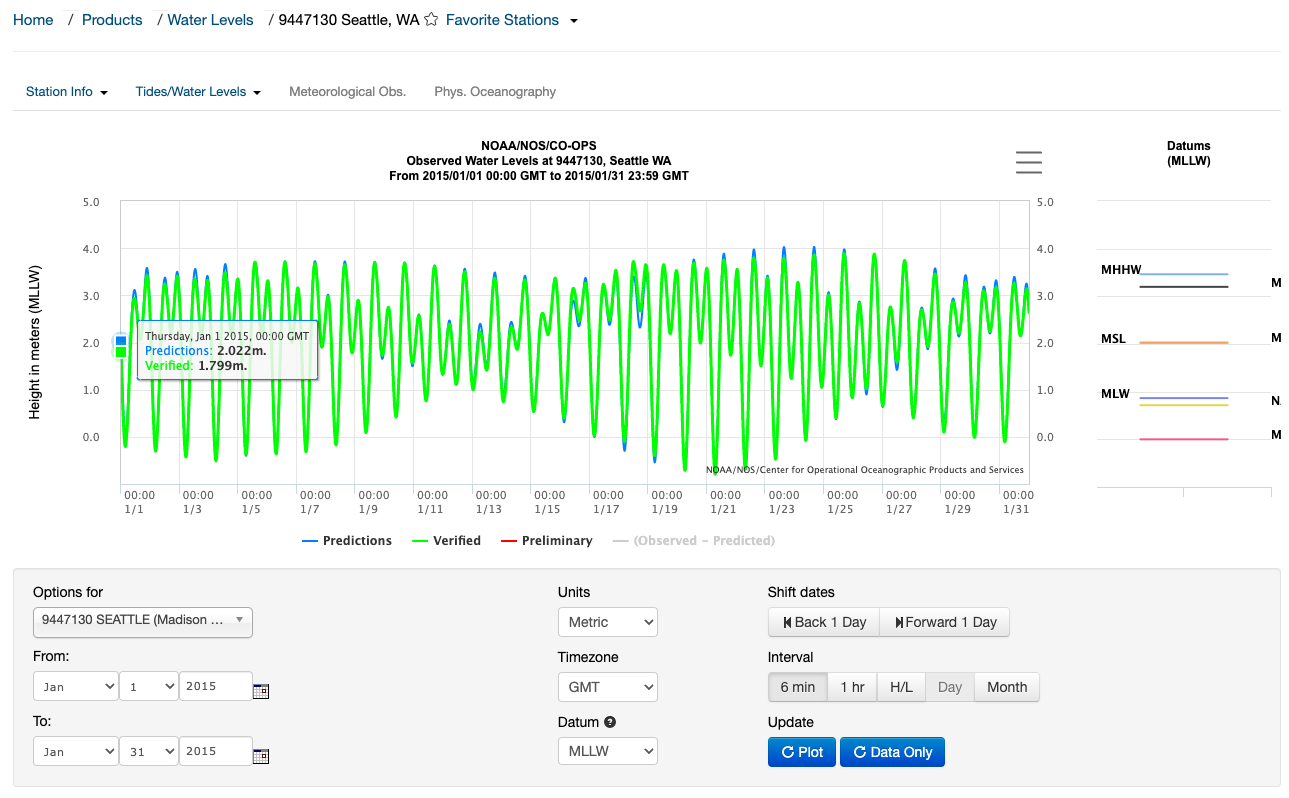
Multi-month and multi-year ranges are automatically split into per-product
blocks sized to NOAA's documented maximum range for that product (e.g. 4 days
for one_minute_water_level, up to 10 years for daily_mean) and
concatenated. If NOAA fails to return data for a block, you get a partial
DataFrame along with a RuntimeWarning and a df.attrs["missing_blocks"]
list describing which ranges failed — downstream code can detect gaps
instead of silently averaging across them.
Daily max/min
daily_max_min returns NOAA's daily extrema rather than the standard
v/s/f/q shape used by most products. Each day contributes a max
row and a min row, distinguished by the record_type column. interval
defaults to "h" when omitted, to avoid mixing 6-minute and hourly data in
the same DataFrame:
>>> station = Station(id="9491094")
>>> df = station.get_data(
...     begin_date="20170101",
...     end_date="20170102",
...     product="daily_max_min",
...     datum="STND",
...     interval=6,
...     units="english",
...     time_zone="gmt",
... )
>>> df
                    record_type  value  pcComplete  flag
2017-01-01 09:42:00         max  9.951         100     0
2017-01-02 22:24:00         max  8.488         100     0
2017-01-01 23:54:00         min  8.425         100     0
2017-01-02 17:24:00         min  7.198         100     0
Pass max_min_type="max" (or "min") to fetch only one extreme instead of
both.
Supported arguments
Values accepted by Station.get_data(...) — see
NOAA's API docs for
the authoritative reference.
| Argument | Accepted values |
|---|---|
product | water_level, hourly_height, high_low, daily_mean, daily_max_min, monthly_mean, one_minute_water_level, predictions, air_gap, air_temperature, water_temperature, wind, air_pressure, conductivity, visibility, humidity, salinity, currents, currents_predictions, ofs_water_level |
datum | CRD, IGLD, LWD, MHHW, MHW, MTL, MSL, MLW, MLLW, NAVD, STND (case-insensitive). Required for water-level products. |
units | metric, english |
time_zone | gmt, lst, lst_ldt |
bin_num | Integer. Required for currents and currents_predictions. Find values on each station's info page. |
interval | Product-specific. predictions: h, 1, 5, 10, 15, 30, 60, hilo (interval="1" caps the max request window at 30 days instead of the product's usual 365). currents: 6, h. currents_predictions: h, 1, 6, 10, 30, 60, max_slack. daily_max_min: 6, h; defaults to h if omitted. Forbidden on water_level, hourly_height, one_minute_water_level. |
max_min_type | Parameter accepted only by daily_max_min, takes values max or min, returning those extremes |
Derived products
Beyond raw observations, Station.get_derived_product() fetches computed
NOAA products — sea level trends, sea level rise projections, high-tide-
flooding counts, extreme water levels, and regional frequency analysis —
via the Derived Product API:
>>> seattle = Station(id="9447130")
>>> df = seattle.get_derived_product(product="sea_level_trends", units="english")
>>> df[["stationName", "trend", "trendError", "trendUnits"]]
   stationName      trend   trendError  trendUnits
0  Seattle          0.82    0.03        inches/decade
Some products accept extra parameters to select a sub-resource.
sea_level_trendstakesdetail("monthly_means","events","seasonal_cycle");extreme_water_levelstakeslevel_type("high","low"):
>>> monthly = seattle.get_derived_product(
...     product="sea_level_trends", detail="monthly_means"
... )
>>> monthly
   year  month    meanDate  mslDeseasonalized     msl  trendLine  upperConfidence  lowerConfidence
0  1899      1  01/15/1899             -0.208  -0.115     -0.199           -0.189           -0.209
1  1899      2  02/15/1899             -0.296  -0.228     -0.199           -0.189           -0.209
2  1899      3  03/15/1899             -0.244  -0.218     -0.199           -0.189           -0.209
3  1899      4  04/15/1899             -0.213  -0.249     -0.199           -0.189           -0.209
4  1899      5  05/15/1899             -0.223  -0.279     -0.198           -0.188           -0.208

>>> lows = seattle.get_derived_product(
...     product="extreme_water_levels", level_type="low"
... )
>>> lows.head()
     type        date status  stationId stationName          stationTitle state       epoch  epochMidyear   latitude   longitude  annotation
0  GEV_LO  01/05/1916    YES    9447130     Seattle  9447130 Seattle, WA     WA  1983-2001          1992  47.602639 -122.339306         NaN
1  GEV_LO  07/07/1929    YES    9447130     Seattle  9447130 Seattle, WA     WA  1983-2001          1992  47.602639 -122.339306         NaN
2  GEV_LO  12/18/1929    YES    9447130     Seattle  9447130 Seattle, WA     WA  1983-2001          1992  47.602639 -122.339306         NaN
3  GEV_LO  11/30/1936    YES    9447130     Seattle  9447130 Seattle, WA     WA  1983-2001          1992  47.602639 -122.339306         NaN
4  GEV_LO  01/08/1947    YES    9447130     Seattle  9447130 Seattle, WA     WA  1983-2001          1992  47.602639 -122.339306         NaN
Supported arguments (derived products)
Values accepted by Station.get_derived_product(...) — see
NOAA's DPAPI docs for
the authoritative reference.
| Argument | Accepted values |
|---|---|
product | htf_daily — high-tide-flooding, daily. Requires start_date/end_date. htf_monthly — high-tide-flooding, monthly. Optional start_date/end_date. htf_seasonal — high-tide-flooding, seasonal. htf_annual — high-tide-flooding, annual. sea_level_trends — sea level trends. Optional detail. slr_projections — sea level rise projections. slr_projection_offsets — sea level rise projection offsets. Not every report_year has published data. rfa_extreme_water_levels — extreme water level regional frequency analysis. top_ten_water_levels — top ten historical water level events. extreme_water_levels — extreme water level event history. Optional level_type. Product names are conventional snake_case; NOAA's underlying API names (some camelCase or unseparated) are handled internally. |
datum | Only accepted by top_ten_water_levels, rfa_extreme_water_levels, and htf_daily. Valid values differ per product; see table below. |
units | metric or english. Documented server-side default varies by product — top_ten_water_levels, extreme_water_levels, rfa_extreme_water_levels, and htf_daily default to english; slr_projections defaults to metric. sea_level_trends isn't documented as accepting units at all, but empirically honors it when passed — pass explicitly rather than relying on undocumented behavior. |
detail | sea_level_trends only: monthly_means, events, seasonal_cycle. Omit for top-level trend statistics. |
level_type | extreme_water_levels only: high, low. Omit for full station metadata. |
start_date / end_date | Required for htf_daily; optional for htf_monthly. Same accepted formats as get_data(). Not accepted by htf_seasonal or htf_annual — use year instead. |
year | Optional year filter, used by HTF products. Must be between 1800 and the current year. |
affil | sea_level_trends, slr_projections, slr_projection_offsets: "US" or "Global". |
projection_year, report_year | slr_projections/slr_projection_offsets only. Not every report_year has published data. |
scenario | slr_projections only: all, low, intermediate-low, intermediate, intermediate-high, high, extreme. Default is all. |
Valid datum values by product:
product | Accepted datums |
|---|---|
top_ten_water_levels | STND, MHHW, MHW, MSL, MTL, MLW, MLLW, NAVD, IGLD, LWD |
rfa_extreme_water_levels | STND, MLLW, MHHW, MSL, MLW, MHW |
htf_daily | STND, MLLW, MHHW, GT, MSL, MLW, MHW |
Accepted date formats
begin_date and end_date accept any of:
"20150101"—%Y%m%d"20150101 12:34"—%Y%m%d %H:%M"01/15/2015"—%m/%d/%Y"01/15/2015 23:59"—%m/%d/%Y %H:%M
Deferred DPAPI products
The following DPAPI products/parameters are not yet supported by
Station.get_derived_product() and are deferred to a future phase:
- High Tide Flooding prediction (
htf) products - HTF Met Year Flood Count
- HTF Next Met Year Annual Outlook
- HTF Decadal Projections and Likely Decadal Scenarios
extreme_water_levelssub-endpoints:annuals,monthlies,exceedanceLevels,exceedanceLevelsByMonthpeak_water_levels- All-stations / bounding-box queries:
slr_projections'lat/lon/bboxparams,station_or_grid
API etiquette
NOAA's CO-OPS APIs are public and free. There are no enforced rate limits but
please be reasonable — avoid tight loops against a single station and cache
results when you can. This library uses connection pooling and automatic
retries on transient failures (429 / 5xx) via a module-level
requests.Session.
Contributing
Bug reports, feature requests, and PRs welcome. See CONTRIBUTING.md for dev-environment setup and the release workflow.
Contributors


Similar repos


Languages
Python
100.0%
A Python wrapper for the NOAA CO-OPS Tides & Currents Data and Metadata APIs.
Python
101
314 commits
updated Sep 21, 2026
README
noaa_coops
A Python wrapper for the NOAA CO-OPS Tides & Currents Data, Metadata, and Derived Product APIs.
Installation
Supported on Python 3.11, 3.12, and 3.13.
uv add noaa-coops
Or with pip:
pip install noaa-coops
Getting started
Stations
Data is accessed via Station objects identified by a NOAA station id:
>>> from noaa_coops import Station
>>> seattle = Station(id="9447130")  # Seattle, WA
Find station IDs via the NOAA Tides & Currents mapping interface or search by bounding box:
>>> from noaa_coops import get_stations_from_bbox, Station
>>> stations = get_stations_from_bbox(
...     lat_coords=[40.389, 40.9397],
...     lon_coords=[-74.4751, -73.7432],
... )
>>> stations
['8516945', '8518750', '8531680']
>>> Station(id="8516945").name
'Kings Point'
Metadata
Station metadata lives on the .metadata attribute, and individual fields are
also promoted to top-level attributes on the Station object:
>>> seattle = Station(id="9447130")
>>> seattle.name
'Seattle'
>>> seattle.state
'WA'
>>> seattle.lat_lon
{'lat': 47.60264, 'lon': -122.3393}
Current prediction stations with multiple bins (e.g. depth bins along a
current meter mooring) expose every bin's prediction offsets, keyed by
currbin number, via .current_pred_offsets_by_bin. The scalar attributes
(curr_bin, current_pred_offsets) only describe the first bin:
>>> act = Station(id="ACT0921")  # has three current bins
>>> act.current_pred_offsets_by_bin
{1: {'id': 'ACT0921',
  'refStationId': 'BOS1111',
  'refStationBin': 14,
  'meanFloodDir': 239.0,
  'meanEbbDir': 63.0,
  'mfcTimeAdjMin': 60,
  'sbeTimeAdjMin': 37,
  'mecTimeAdjMin': -13,
  'sbfTimeAdjMin': 44,
  'mfcAmpAdj': 0.4,
  'mecAmpAdj': 0.4,
  'self': '...'},
 2: {'id': 'ACT0921', 'refStationId': 'BOS1111', ...},
 3: {'id': 'ACT0921', 'refStationId': 'BOS1111', ...}}
Data inventory
Per-product first/last observation dates:
>>> seattle.data_inventory["Wind"]
{'start_date': '1991-11-09 00:00', 'end_date': '...'}
Note: The data inventory comes from NOAA's legacy SOAP endpoint and is best-effort. If the service is unreachable,
data_inventoryis set to{}and a warning is logged —Station()construction still succeeds.
Data retrieval
Data is returned as a pandas DataFrame indexed by timestamp. Column names
mirror NOAA's response format.
>>> seattle = Station(id="9447130")
>>> df = seattle.get_data(
...     begin_date="20150101",
...     end_date="20150131",
...     product="water_level",
...     datum="MLLW",
...     units="metric",
...     time_zone="gmt",
... )
>>> df.head()
                         v      s        f  q
t
2015-01-01 00:00:00  1.799  0.023  0,0,0,0  v
2015-01-01 00:06:00  1.718  0.018  0,0,0,0  v
2015-01-01 00:12:00  1.639  0.013  0,0,0,0  v
2015-01-01 00:18:00  1.557  0.012  0,0,0,0  v
2015-01-01 00:24:00  1.473  0.014  0,0,0,0  v
Multi-month and multi-year ranges are automatically split into per-product
blocks sized to NOAA's documented maximum range for that product (e.g. 4 days
for one_minute_water_level, up to 10 years for daily_mean) and
concatenated. If NOAA fails to return data for a block, you get a partial
DataFrame along with a RuntimeWarning and a df.attrs["missing_blocks"]
list describing which ranges failed — downstream code can detect gaps
instead of silently averaging across them.
Daily max/min
daily_max_min returns NOAA's daily extrema rather than the standard
v/s/f/q shape used by most products. Each day contributes a max
row and a min row, distinguished by the record_type column. interval
defaults to "h" when omitted, to avoid mixing 6-minute and hourly data in
the same DataFrame:
>>> station = Station(id="9491094")
>>> df = station.get_data(
...     begin_date="20170101",
...     end_date="20170102",
...     product="daily_max_min",
...     datum="STND",
...     interval=6,
...     units="english",
...     time_zone="gmt",
... )
>>> df
                    record_type  value  pcComplete  flag
2017-01-01 09:42:00         max  9.951         100     0
2017-01-02 22:24:00         max  8.488         100     0
2017-01-01 23:54:00         min  8.425         100     0
2017-01-02 17:24:00         min  7.198         100     0
Pass max_min_type="max" (or "min") to fetch only one extreme instead of
both.
Supported arguments
Values accepted by Station.get_data(...) — see
NOAA's API docs for
the authoritative reference.
| Argument | Accepted values |
|---|---|
product | water_level, hourly_height, high_low, daily_mean, daily_max_min, monthly_mean, one_minute_water_level, predictions, air_gap, air_temperature, water_temperature, wind, air_pressure, conductivity, visibility, humidity, salinity, currents, currents_predictions, ofs_water_level |
datum | CRD, IGLD, LWD, MHHW, MHW, MTL, MSL, MLW, MLLW, NAVD, STND (case-insensitive). Required for water-level products. |
units | metric, english |
time_zone | gmt, lst, lst_ldt |
bin_num | Integer. Required for currents and currents_predictions. Find values on each station's info page. |
interval | Product-specific. predictions: h, 1, 5, 10, 15, 30, 60, hilo (interval="1" caps the max request window at 30 days instead of the product's usual 365). currents: 6, h. currents_predictions: h, 1, 6, 10, 30, 60, max_slack. daily_max_min: 6, h; defaults to h if omitted. Forbidden on water_level, hourly_height, one_minute_water_level. |
max_min_type | Parameter accepted only by daily_max_min, takes values max or min, returning those extremes |
Derived products
Beyond raw observations, Station.get_derived_product() fetches computed
NOAA products — sea level trends, sea level rise projections, high-tide-
flooding counts, extreme water levels, and regional frequency analysis —
via the Derived Product API:
>>> seattle = Station(id="9447130")
>>> df = seattle.get_derived_product(product="sea_level_trends", units="english")
>>> df[["stationName", "trend", "trendError", "trendUnits"]]
   stationName      trend   trendError  trendUnits
0  Seattle          0.82    0.03        inches/decade
Some products accept extra parameters to select a sub-resource.
sea_level_trendstakesdetail("monthly_means","events","seasonal_cycle");extreme_water_levelstakeslevel_type("high","low"):
>>> monthly = seattle.get_derived_product(
...     product="sea_level_trends", detail="monthly_means"
... )
>>> monthly
   year  month    meanDate  mslDeseasonalized     msl  trendLine  upperConfidence  lowerConfidence
0  1899      1  01/15/1899             -0.208  -0.115     -0.199           -0.189           -0.209
1  1899      2  02/15/1899             -0.296  -0.228     -0.199           -0.189           -0.209
2  1899      3  03/15/1899             -0.244  -0.218     -0.199           -0.189           -0.209
3  1899      4  04/15/1899             -0.213  -0.249     -0.199           -0.189           -0.209
4  1899      5  05/15/1899             -0.223  -0.279     -0.198           -0.188           -0.208

>>> lows = seattle.get_derived_product(
...     product="extreme_water_levels", level_type="low"
... )
>>> lows.head()
     type        date status  stationId stationName          stationTitle state       epoch  epochMidyear   latitude   longitude  annotation
0  GEV_LO  01/05/1916    YES    9447130     Seattle  9447130 Seattle, WA     WA  1983-2001          1992  47.602639 -122.339306         NaN
1  GEV_LO  07/07/1929    YES    9447130     Seattle  9447130 Seattle, WA     WA  1983-2001          1992  47.602639 -122.339306         NaN
2  GEV_LO  12/18/1929    YES    9447130     Seattle  9447130 Seattle, WA     WA  1983-2001          1992  47.602639 -122.339306         NaN
3  GEV_LO  11/30/1936    YES    9447130     Seattle  9447130 Seattle, WA     WA  1983-2001          1992  47.602639 -122.339306         NaN
4  GEV_LO  01/08/1947    YES    9447130     Seattle  9447130 Seattle, WA     WA  1983-2001          1992  47.602639 -122.339306         NaN
Supported arguments (derived products)
Values accepted by Station.get_derived_product(...) — see
NOAA's DPAPI docs for
the authoritative reference.
| Argument | Accepted values |
|---|---|
product | htf_daily — high-tide-flooding, daily. Requires start_date/end_date. htf_monthly — high-tide-flooding, monthly. Optional start_date/end_date. htf_seasonal — high-tide-flooding, seasonal. htf_annual — high-tide-flooding, annual. sea_level_trends — sea level trends. Optional detail. slr_projections — sea level rise projections. slr_projection_offsets — sea level rise projection offsets. Not every report_year has published data. rfa_extreme_water_levels — extreme water level regional frequency analysis. top_ten_water_levels — top ten historical water level events. extreme_water_levels — extreme water level event history. Optional level_type. Product names are conventional snake_case; NOAA's underlying API names (some camelCase or unseparated) are handled internally. |
datum | Only accepted by top_ten_water_levels, rfa_extreme_water_levels, and htf_daily. Valid values differ per product; see table below. |
units | metric or english. Documented server-side default varies by product — top_ten_water_levels, extreme_water_levels, rfa_extreme_water_levels, and htf_daily default to english; slr_projections defaults to metric. sea_level_trends isn't documented as accepting units at all, but empirically honors it when passed — pass explicitly rather than relying on undocumented behavior. |
detail | sea_level_trends only: monthly_means, events, seasonal_cycle. Omit for top-level trend statistics. |
level_type | extreme_water_levels only: high, low. Omit for full station metadata. |
start_date / end_date | Required for htf_daily; optional for htf_monthly. Same accepted formats as get_data(). Not accepted by htf_seasonal or htf_annual — use year instead. |
year | Optional year filter, used by HTF products. Must be between 1800 and the current year. |
affil | sea_level_trends, slr_projections, slr_projection_offsets: "US" or "Global". |
projection_year, report_year | slr_projections/slr_projection_offsets only. Not every report_year has published data. |
scenario | slr_projections only: all, low, intermediate-low, intermediate, intermediate-high, high, extreme. Default is all. |
Valid datum values by product:
product | Accepted datums |
|---|---|
top_ten_water_levels | STND, MHHW, MHW, MSL, MTL, MLW, MLLW, NAVD, IGLD, LWD |
rfa_extreme_water_levels | STND, MLLW, MHHW, MSL, MLW, MHW |
htf_daily | STND, MLLW, MHHW, GT, MSL, MLW, MHW |
Accepted date formats
begin_date and end_date accept any of:
"20150101"—%Y%m%d"20150101 12:34"—%Y%m%d %H:%M"01/15/2015"—%m/%d/%Y"01/15/2015 23:59"—%m/%d/%Y %H:%M
Deferred DPAPI products
The following DPAPI products/parameters are not yet supported by
Station.get_derived_product() and are deferred to a future phase:
- High Tide Flooding prediction (
htf) products - HTF Met Year Flood Count
- HTF Next Met Year Annual Outlook
- HTF Decadal Projections and Likely Decadal Scenarios
extreme_water_levelssub-endpoints:annuals,monthlies,exceedanceLevels,exceedanceLevelsByMonthpeak_water_levels- All-stations / bounding-box queries:
slr_projections'lat/lon/bboxparams,station_or_grid
API etiquette
NOAA's CO-OPS APIs are public and free. There are no enforced rate limits but
please be reasonable — avoid tight loops against a single station and cache
results when you can. This library uses connection pooling and automatic
retries on transient failures (429 / 5xx) via a module-level
requests.Session.
Contributing
Bug reports, feature requests, and PRs welcome. See CONTRIBUTING.md for dev-environment setup and the release workflow.
Similar repos
Contributors
Languages
Python
100.0%