
An open-source AI accelerator, developed by AI: RTL, ISA, simulator, compiler and profiler in one repo. Runs Qwen3, LFM2.5 and Qwen3.5 on a Kintex-7 PCIe card.
Verilog
34
1,356 commits
updated Oct 2, 2026
See what people are saying
README
openTPU
An open-source AI accelerator, developed by AI.
openTPU brings the lessons of auto-arch-tournament to AI accelerators. It asks two questions: how far can AI agents go at hardware design, and can they build the chip that runs their own inference?
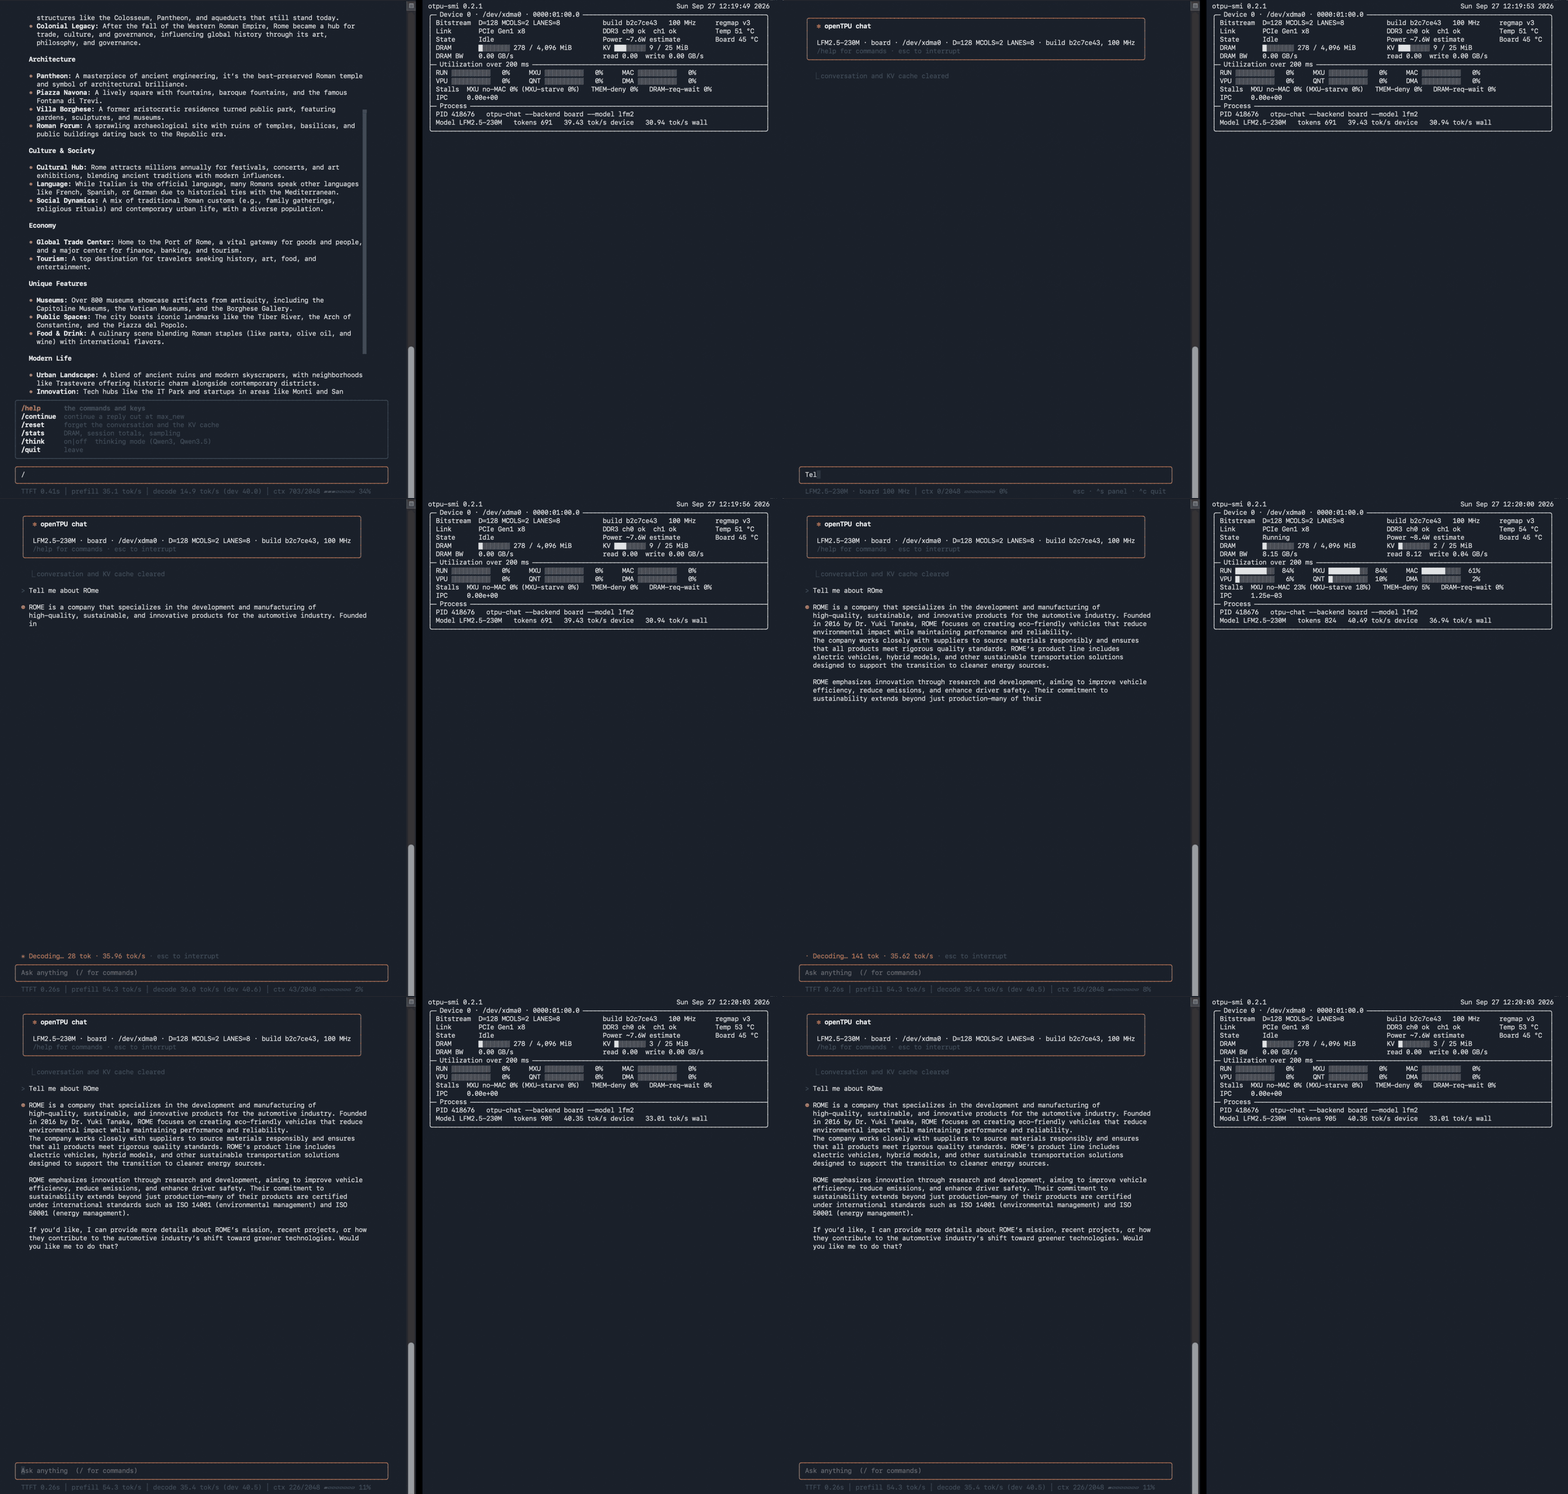
otpu-chat running LFM2.5-230M on the FPGA card (left), with otpu-smi showing the card's
utilization and DRAM bandwidth (right).
A place to learn
openTPU is also a learning project. The whole accelerator lives in one small monorepo that you can read end to end: the hardware design (SystemVerilog), the instruction set, a bit-exact simulator, a kernel language and its compiler, and the host software that drives a real PCIe card. If you want to understand how an AI accelerator works, from a matmul in Python down to the wires, this is a good place to start.
Results
The design runs ten modern models with their real weights on an Inspur YPCB-00338 card (Xilinx Kintex-7 xc7k480t, two DDR3 channels), and the card produces the same tokens as the simulator, bit for bit.
| Model | Weights | Decode, device | Decode, wall | Prefill, device | DRAM while decoding |
|---|---|---|---|---|---|
| LFM2.5-230M | int8 | 59.0 tok/s | 52.3 tok/s | 295.6 tok/s | 14.5 GB/s (85% of peak) |
| LFM2.5-230M | 4-bit, int8 head | 85.8 tok/s | 82.1 tok/s | 335.4 tok/s | 14.1 GB/s (82%) |
| Qwen3-0.6B | int8 | 21.6 tok/s | 21.3 tok/s | 92.1 tok/s | 14.4 GB/s (84%) |
| Qwen3-0.6B | 4-bit, int8 head | 31.3 tok/s | 30.7 tok/s | 103.4 tok/s | 13.9 GB/s (82%) |
| Qwen3.5-0.8B | int8 | 17.6 tok/s | 16.3 tok/s | 61.4 tok/s | 14.5 GB/s (85%) |
| Qwen3.5-0.8B | 4-bit, int8 head | 24.5 tok/s | 23.3 tok/s | 66.7 tok/s | 14.1 GB/s (83%) |
| Gemma 4 E2B | 4-bit, int8 head | 10.57 tok/s | 10.53 tok/s | 32.1 tok/s | 15.6 GB/s (92%) |
| Gemma 4 E2B | 4-bit, 4-bit head | 12.14 tok/s | 12.09 tok/s | 29.9 tok/s | 15.5 GB/s (91%) |
| LFM2-2.6B | int8 | 6.05 tok/s | 6.03 tok/s | 21.4 tok/s | 16.1 GB/s (94%) |
| LFM2-2.6B | 4-bit, int8 head | 10.96 tok/s | 10.93 tok/s | 20.6 tok/s | 15.8 GB/s (93%) |
| SmolLM3-3B | int8 | 5.00 tok/s | 4.99 tok/s | 21.1 tok/s | 16.0 GB/s (94%) |
| SmolLM3-3B | 4-bit, int8 head | 8.74 tok/s | 8.72 tok/s | 22.8 tok/s | 15.7 GB/s (92%) |
| Phi-4-mini (3.8B) | int8 | 3.99 tok/s | 3.98 tok/s | 13.8 tok/s | 16.0 GB/s (94%) |
| Phi-4-mini (3.8B) | 4-bit, int8 head | 6.56 tok/s | 6.55 tok/s | 15.0 tok/s | 15.8 GB/s (92%) |
| Qwen3.5-2B | int8 | 8.02 tok/s | 8.00 tok/s | 38.2 tok/s | 16.0 GB/s (94%) |
| Qwen3.5-2B | 4-bit, int8 head | 12.09 tok/s | 12.03 tok/s | 41.7 tok/s | 15.8 GB/s (92%) |
| Qwen3.5-4B | 4-bit, int8 head | 5.88 tok/s | 5.87 tok/s | 12.9 tok/s | 15.7 GB/s (92%) |
| Gemma 4 E4B | int8, 4-bit head and down 0-23 | 3.78 tok/s | 3.75 tok/s | 14.8 tok/s | 16.0 GB/s (94%) |
Measured on the card: the first three models on 2026-09-29 with the production image
deploy_champ_e698dcd7. LFM2-2.6B, SmolLM3-3B and Phi-4-mini on 2026-09-30, and Qwen3.5-2B and
4B and Gemma 4 on 2026-10-01, with build B, deploy_fused133c_79c5707a, production since then.
Build B decodes LFM2-2.6B, SmolLM3 and Phi-4-mini 8-9% faster than e698dcd7 (Gemma 4 E2B 10%),
at 91-94% of the DRAM peak instead of 82-87%. Qwen3.5-4B's int8 image is over 4 GiB.
- The image: main e698dcd at 133.33 MHz, one bitstream for all models. It has LiteDRAM controllers calibrated by a small CPU inside the memory core, a four-column systolic matrix unit and the stream engine (docs/stream.md). DDR3-1066, with a 17.1 GB/s peak.
- The host: the card sits in opentpu (Intel Core i7-4790).
- Method,
tools/qual/perf.py: decode is 64 greedy tokens after a 512-token prompt, with the host's argmax in the loop (not streamed). "Device" counts only the cycles the accelerator runs; "wall" adds the host. Prefill is the 512-token prompt, on the device. - DRAM traffic comes from the card's own counters while it runs.
- Gemma 4 E2B keeps its per-layer embedding tables on the card (3.5-3.6 GiB images; docs/gemma4.md); in int8 it does not fit. It matches Hugging Face's greedy tokens on three prompts with either head. E4B's table (2.95 GB) stays on the host, which copies one 11 KB row into the card per token; its image is 3.96 GiB, int8 with the head and the first 24 layers' down projections in 4-bit (docs/gemma4_e4b.md). In the card's own decode loop (the card picking every token) Gemma 4 decodes faster: E2B 11.01 / 12.73 tok/s (int8 / 4-bit head), E4B 3.83 tok/s, on the device.
- Every configuration matches the simulator token for token, per-position and with the resident decode program. More detail in docs/board.md.
With the logits streamed back while the card runs (tools/decode_profile.py, 96 tokens), 4-bit
decode is faster, in device / wall tok/s:
- LFM2: 89.5 / 84.5;
- Qwen3: 33.7 / 33.3;
- Qwen3.5: 24.6 / 24.2;
- LFM2-2.6B: 11.07 / 11.02 (build B);
- SmolLM3-3B: 8.92 / 8.89 (build B);
- Phi-4-mini: 6.69 / 6.67 (build B).
The previous production image, se-cand3, was built with the Xilinx MIG, a two-column matrix unit and a 120.755 MHz clock. Measured the same way, the new image:
- decode: within 2.3% of se-cand3's in every configuration. Decode is bound by DRAM, and LiteDRAM reads at 82-85% of the DDR3 peak, as the MIG did.
- prefill: 1.3x (Qwen3.5) to 2.0x (LFM2 4-bit) faster.
- calibration: when the image starts, the core's CPU calibrates both DDR3 channels in 12 s, with no host involvement.
The earlier images and their numbers are in docs/board.md, section 5.
Mixture-of-experts models bigger than the card's 4 GiB run with their experts streamed from host storage (docs/offload.md, section 10). The card routes each token and computes every expert, and it keeps the experts in per-layer slots in its DRAM. The host only copies missing experts from a pool file into those slots, at the link's rate (section 10.1). Measured on 2026-10-01 with build B (79c5707a), the card's own decode loop picking every token, 4-bit experts, int8 head:
- LFM2.5-8B-A1B (8.5B parameters, 1.7B active): 10.6 tok/s over 160 tokens. 98.5% of expert uses hit the slots, and 5.2 MB streamed per token.
- Qwen3.5-35B-A3B (34.7B parameters, 3.0B active): 3.95 tok/s, with Hugging Face's 16 greedy tokens. 62% of expert uses hit, and 153 MB streamed per token at 1.41 GB/s over PCIe (section 10.3).
- Both match the simulator bit for bit.
4-bit weights (docs/quant.md) use FP4 values with two-level block scales, 4.25 bits per weight, and keep the LM head in int8 for accuracy. They cut the bytes per token by about a third and raise decode speed by 40% (Qwen3.5) to 45% (Qwen3, LFM2), at a measurable cost in perplexity that docs/quant.md reports per model.
The host is nearly out of the way. For LFM2 and Qwen3 the card runs one decode program compiled once, which reads the position from a register and looks up its own embedding and RoPE rows, and the logits stream back while the card is still running: the host adds 0.17 to 0.30 ms per token on omarchy (0.45 to 1.3 ms on opentpu). Qwen3.5 runs the same way for decode; its prefill still compiles each chunk's program on the host, ahead of the card.
How it works
  Kernels in ol              mlp, attention, full model layers
        |  @ol.jit
  Language + compiler        layouts, affine loop addressing, fusion
        |
  ISA                        8 x 32-bit words per instruction
        |
  ISA simulator  <======>  RTL          same bits, checked by the tests
  (Python)                 (SystemVerilog)
                            |  Vivado bitstream
                           FPGA card    Kintex-7 xc7k480t
                            |  PCIe
                           Host         otpu-chat, otpu-smi, otpu-lens
The machine is deliberately simple. A sequencer issues one instruction per cycle to a few units: DMA moves data, the matrix unit multiplies int8 weights streamed from DRAM, the vector unit does fp32 math, and a quantizer turns results back into int8. There is no cache and no hidden scheduling: every data movement is an instruction, so a trace shows exactly where the cycles go. docs/isa.md describes the whole instruction set.
A kernel looks like this:
from opentpu import language as ol

@ol.jit
def mlp(h, gamma, w_gate, w_up, w_down, out, eps):   # simplified; see kernels/mlp.py
    x = ol.load(h)
    xs = ol.quantize(rmsnorm(x, ol.load(gamma), eps))
    g = ol.dot(xs, w_gate)
    u = ol.dot(xs, w_up)
    a = ol.all_gather(silu(g) * u)
    y = ol.all_gather(ol.dot(a, w_down))
    if ol.program_id() == 0:
        ol.store(out, x + y)
Because every data movement is an instruction, a trace of a run explains its speed. Lens, the profiler, records a run from the RTL, the simulator or the card and opens it in the browser, with a roofline, a timeline and per-instruction tables (docs/lens.md).
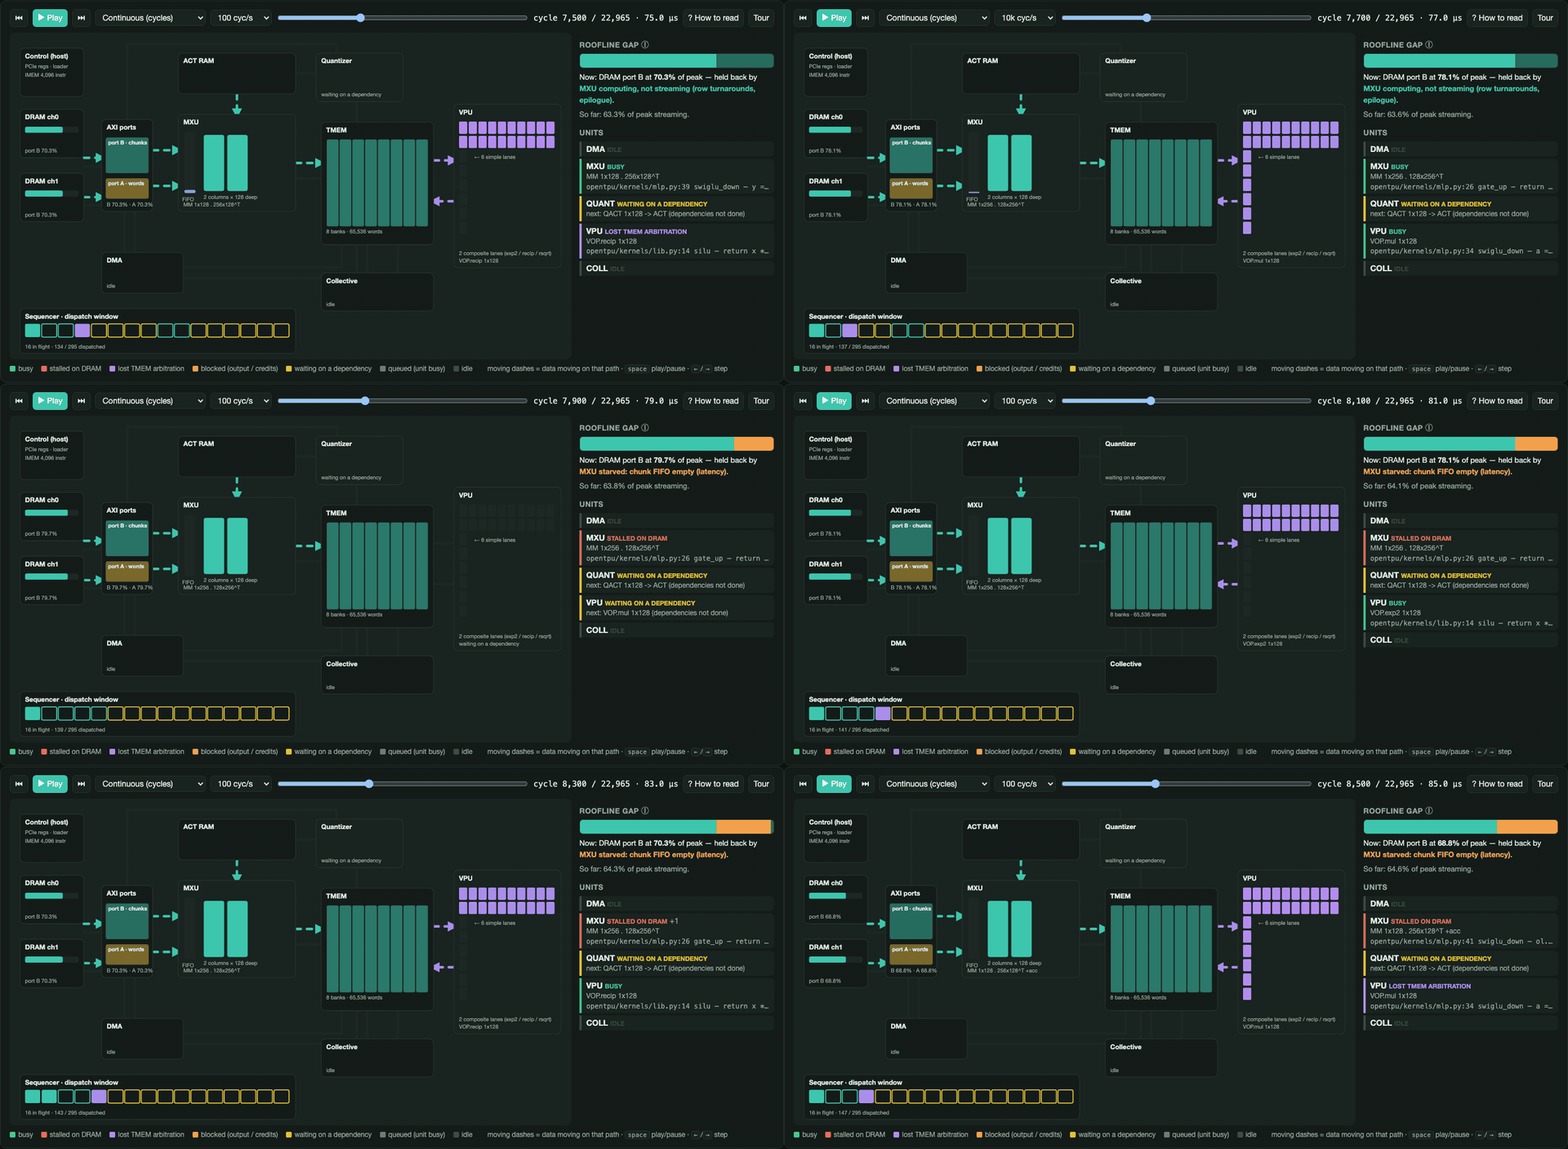
Lens replaying part of a Qwen3 decode step. Colours show what each unit is doing in each cycle: busy, waiting on DRAM, or waiting on another instruction.
Try it
Everything except the card runs on a laptop.
pip install -e .
pip install pytest torch transformers
python3 -m pytest -q          # RTL tests also need Verilator 5

hf download LiquidAI/LFM2.5-230M --local-dir models/LFM2.5-230M
otpu-chat --model lfm2 --backend isa    # chat on the simulator
With a card, build the bitstream (make bit in boards/ypcb-00338), load
it over JTAG, then run sudo otpu-setup and otpu-chat --backend board.
docs/board.md walks through the bring-up.
| Command | What it does |
|---|---|
otpu-chat | chat with Qwen3-0.6B, LFM2.5-230M (--model lfm2), Qwen3.5-0.8B (--model qwen35), LFM2-2.6B (lfm2-2.6b), SmolLM3-3B (smollm3), Phi-4-mini (phi4-mini) or Qwen3.5-2B / 4B (qwen35-2b, qwen35-4b) |
otpu-smi | temperature, power, DRAM bandwidth and per-unit utilization |
otpu-lens | record a run and open it in the profiler |
otpu-selftest, otpu-diag | check that the card works |
Where to start reading
- docs/isa.md: the instruction set. Everything else is built on it.
opentpu/kernelsand docs/compiler.md: how a kernel becomes instructions.opentpu/isasim.py: the simulator, which is the spec.rtl/: the hardware, starting fromrtl/top/otpu_top.sv.- docs/lfm2.md, docs/qwen35.md, docs/llama.md, docs/benchmarks.md: whole models and where their cycles go.
- docs/board.md: the physical card, from clocks to PCIe.
What's next
- The last few percent of DRAM. Decode is bound by DRAM efficiency: it reads 82 to 85% of the DDR3-1066 peak. Work on the LiteDRAM path's efficiency is under way.
- Timing margin and area. The design closes 133.33 MHz, the clock at which the 128-byte port matches the two DDR3 channels, but only just (WNS +0.032 ns). A tournament of Vivado runs keeps working on its margin and area. Decode is bound by DRAM, so a faster clock mostly helps prefill.
- Faster prefill. The four-column systolic matrix unit is in the production image; prefill is still limited by the matrix unit's multiply rate.
Contributing
Issues and pull requests are welcome, and most of the work needs only Python and Verilator, not
an FPGA. Changes to the ISA, the simulator or the RTL must keep python3 -m pytest -q passing,
and performance claims should say how they were measured.
License
Apache License 2.0. See LICENSE.


An open-source AI accelerator, developed by AI: RTL, ISA, simulator, compiler and profiler in one repo. Runs Qwen3, LFM2.5 and Qwen3.5 on a Kintex-7 PCIe card.
Verilog
34
1,356 commits
updated Oct 2, 2026
See what people are saying
README
openTPU
An open-source AI accelerator, developed by AI.
openTPU brings the lessons of auto-arch-tournament to AI accelerators. It asks two questions: how far can AI agents go at hardware design, and can they build the chip that runs their own inference?
otpu-chat running LFM2.5-230M on the FPGA card (left), with otpu-smi showing the card's
utilization and DRAM bandwidth (right).
A place to learn
openTPU is also a learning project. The whole accelerator lives in one small monorepo that you can read end to end: the hardware design (SystemVerilog), the instruction set, a bit-exact simulator, a kernel language and its compiler, and the host software that drives a real PCIe card. If you want to understand how an AI accelerator works, from a matmul in Python down to the wires, this is a good place to start.
Results
The design runs ten modern models with their real weights on an Inspur YPCB-00338 card (Xilinx Kintex-7 xc7k480t, two DDR3 channels), and the card produces the same tokens as the simulator, bit for bit.
| Model | Weights | Decode, device | Decode, wall | Prefill, device | DRAM while decoding |
|---|---|---|---|---|---|
| LFM2.5-230M | int8 | 59.0 tok/s | 52.3 tok/s | 295.6 tok/s | 14.5 GB/s (85% of peak) |
| LFM2.5-230M | 4-bit, int8 head | 85.8 tok/s | 82.1 tok/s | 335.4 tok/s | 14.1 GB/s (82%) |
| Qwen3-0.6B | int8 | 21.6 tok/s | 21.3 tok/s | 92.1 tok/s | 14.4 GB/s (84%) |
| Qwen3-0.6B | 4-bit, int8 head | 31.3 tok/s | 30.7 tok/s | 103.4 tok/s | 13.9 GB/s (82%) |
| Qwen3.5-0.8B | int8 | 17.6 tok/s | 16.3 tok/s | 61.4 tok/s | 14.5 GB/s (85%) |
| Qwen3.5-0.8B | 4-bit, int8 head | 24.5 tok/s | 23.3 tok/s | 66.7 tok/s | 14.1 GB/s (83%) |
| Gemma 4 E2B | 4-bit, int8 head | 10.57 tok/s | 10.53 tok/s | 32.1 tok/s | 15.6 GB/s (92%) |
| Gemma 4 E2B | 4-bit, 4-bit head | 12.14 tok/s | 12.09 tok/s | 29.9 tok/s | 15.5 GB/s (91%) |
| LFM2-2.6B | int8 | 6.05 tok/s | 6.03 tok/s | 21.4 tok/s | 16.1 GB/s (94%) |
| LFM2-2.6B | 4-bit, int8 head | 10.96 tok/s | 10.93 tok/s | 20.6 tok/s | 15.8 GB/s (93%) |
| SmolLM3-3B | int8 | 5.00 tok/s | 4.99 tok/s | 21.1 tok/s | 16.0 GB/s (94%) |
| SmolLM3-3B | 4-bit, int8 head | 8.74 tok/s | 8.72 tok/s | 22.8 tok/s | 15.7 GB/s (92%) |
| Phi-4-mini (3.8B) | int8 | 3.99 tok/s | 3.98 tok/s | 13.8 tok/s | 16.0 GB/s (94%) |
| Phi-4-mini (3.8B) | 4-bit, int8 head | 6.56 tok/s | 6.55 tok/s | 15.0 tok/s | 15.8 GB/s (92%) |
| Qwen3.5-2B | int8 | 8.02 tok/s | 8.00 tok/s | 38.2 tok/s | 16.0 GB/s (94%) |
| Qwen3.5-2B | 4-bit, int8 head | 12.09 tok/s | 12.03 tok/s | 41.7 tok/s | 15.8 GB/s (92%) |
| Qwen3.5-4B | 4-bit, int8 head | 5.88 tok/s | 5.87 tok/s | 12.9 tok/s | 15.7 GB/s (92%) |
| Gemma 4 E4B | int8, 4-bit head and down 0-23 | 3.78 tok/s | 3.75 tok/s | 14.8 tok/s | 16.0 GB/s (94%) |
Measured on the card: the first three models on 2026-09-29 with the production image
deploy_champ_e698dcd7. LFM2-2.6B, SmolLM3-3B and Phi-4-mini on 2026-09-30, and Qwen3.5-2B and
4B and Gemma 4 on 2026-10-01, with build B, deploy_fused133c_79c5707a, production since then.
Build B decodes LFM2-2.6B, SmolLM3 and Phi-4-mini 8-9% faster than e698dcd7 (Gemma 4 E2B 10%),
at 91-94% of the DRAM peak instead of 82-87%. Qwen3.5-4B's int8 image is over 4 GiB.
- The image: main e698dcd at 133.33 MHz, one bitstream for all models. It has LiteDRAM controllers calibrated by a small CPU inside the memory core, a four-column systolic matrix unit and the stream engine (docs/stream.md). DDR3-1066, with a 17.1 GB/s peak.
- The host: the card sits in opentpu (Intel Core i7-4790).
- Method,
tools/qual/perf.py: decode is 64 greedy tokens after a 512-token prompt, with the host's argmax in the loop (not streamed). "Device" counts only the cycles the accelerator runs; "wall" adds the host. Prefill is the 512-token prompt, on the device. - DRAM traffic comes from the card's own counters while it runs.
- Gemma 4 E2B keeps its per-layer embedding tables on the card (3.5-3.6 GiB images; docs/gemma4.md); in int8 it does not fit. It matches Hugging Face's greedy tokens on three prompts with either head. E4B's table (2.95 GB) stays on the host, which copies one 11 KB row into the card per token; its image is 3.96 GiB, int8 with the head and the first 24 layers' down projections in 4-bit (docs/gemma4_e4b.md). In the card's own decode loop (the card picking every token) Gemma 4 decodes faster: E2B 11.01 / 12.73 tok/s (int8 / 4-bit head), E4B 3.83 tok/s, on the device.
- Every configuration matches the simulator token for token, per-position and with the resident decode program. More detail in docs/board.md.
With the logits streamed back while the card runs (tools/decode_profile.py, 96 tokens), 4-bit
decode is faster, in device / wall tok/s:
- LFM2: 89.5 / 84.5;
- Qwen3: 33.7 / 33.3;
- Qwen3.5: 24.6 / 24.2;
- LFM2-2.6B: 11.07 / 11.02 (build B);
- SmolLM3-3B: 8.92 / 8.89 (build B);
- Phi-4-mini: 6.69 / 6.67 (build B).
The previous production image, se-cand3, was built with the Xilinx MIG, a two-column matrix unit and a 120.755 MHz clock. Measured the same way, the new image:
- decode: within 2.3% of se-cand3's in every configuration. Decode is bound by DRAM, and LiteDRAM reads at 82-85% of the DDR3 peak, as the MIG did.
- prefill: 1.3x (Qwen3.5) to 2.0x (LFM2 4-bit) faster.
- calibration: when the image starts, the core's CPU calibrates both DDR3 channels in 12 s, with no host involvement.
The earlier images and their numbers are in docs/board.md, section 5.
Mixture-of-experts models bigger than the card's 4 GiB run with their experts streamed from host storage (docs/offload.md, section 10). The card routes each token and computes every expert, and it keeps the experts in per-layer slots in its DRAM. The host only copies missing experts from a pool file into those slots, at the link's rate (section 10.1). Measured on 2026-10-01 with build B (79c5707a), the card's own decode loop picking every token, 4-bit experts, int8 head:
- LFM2.5-8B-A1B (8.5B parameters, 1.7B active): 10.6 tok/s over 160 tokens. 98.5% of expert uses hit the slots, and 5.2 MB streamed per token.
- Qwen3.5-35B-A3B (34.7B parameters, 3.0B active): 3.95 tok/s, with Hugging Face's 16 greedy tokens. 62% of expert uses hit, and 153 MB streamed per token at 1.41 GB/s over PCIe (section 10.3).
- Both match the simulator bit for bit.
4-bit weights (docs/quant.md) use FP4 values with two-level block scales, 4.25 bits per weight, and keep the LM head in int8 for accuracy. They cut the bytes per token by about a third and raise decode speed by 40% (Qwen3.5) to 45% (Qwen3, LFM2), at a measurable cost in perplexity that docs/quant.md reports per model.
The host is nearly out of the way. For LFM2 and Qwen3 the card runs one decode program compiled once, which reads the position from a register and looks up its own embedding and RoPE rows, and the logits stream back while the card is still running: the host adds 0.17 to 0.30 ms per token on omarchy (0.45 to 1.3 ms on opentpu). Qwen3.5 runs the same way for decode; its prefill still compiles each chunk's program on the host, ahead of the card.
How it works
  Kernels in ol              mlp, attention, full model layers
        |  @ol.jit
  Language + compiler        layouts, affine loop addressing, fusion
        |
  ISA                        8 x 32-bit words per instruction
        |
  ISA simulator  <======>  RTL          same bits, checked by the tests
  (Python)                 (SystemVerilog)
                            |  Vivado bitstream
                           FPGA card    Kintex-7 xc7k480t
                            |  PCIe
                           Host         otpu-chat, otpu-smi, otpu-lens
The machine is deliberately simple. A sequencer issues one instruction per cycle to a few units: DMA moves data, the matrix unit multiplies int8 weights streamed from DRAM, the vector unit does fp32 math, and a quantizer turns results back into int8. There is no cache and no hidden scheduling: every data movement is an instruction, so a trace shows exactly where the cycles go. docs/isa.md describes the whole instruction set.
A kernel looks like this:
from opentpu import language as ol

@ol.jit
def mlp(h, gamma, w_gate, w_up, w_down, out, eps):   # simplified; see kernels/mlp.py
    x = ol.load(h)
    xs = ol.quantize(rmsnorm(x, ol.load(gamma), eps))
    g = ol.dot(xs, w_gate)
    u = ol.dot(xs, w_up)
    a = ol.all_gather(silu(g) * u)
    y = ol.all_gather(ol.dot(a, w_down))
    if ol.program_id() == 0:
        ol.store(out, x + y)
Because every data movement is an instruction, a trace of a run explains its speed. Lens, the profiler, records a run from the RTL, the simulator or the card and opens it in the browser, with a roofline, a timeline and per-instruction tables (docs/lens.md).
Lens replaying part of a Qwen3 decode step. Colours show what each unit is doing in each cycle: busy, waiting on DRAM, or waiting on another instruction.
Try it
Everything except the card runs on a laptop.
pip install -e .
pip install pytest torch transformers
python3 -m pytest -q          # RTL tests also need Verilator 5

hf download LiquidAI/LFM2.5-230M --local-dir models/LFM2.5-230M
otpu-chat --model lfm2 --backend isa    # chat on the simulator
With a card, build the bitstream (make bit in boards/ypcb-00338), load
it over JTAG, then run sudo otpu-setup and otpu-chat --backend board.
docs/board.md walks through the bring-up.
| Command | What it does |
|---|---|
otpu-chat | chat with Qwen3-0.6B, LFM2.5-230M (--model lfm2), Qwen3.5-0.8B (--model qwen35), LFM2-2.6B (lfm2-2.6b), SmolLM3-3B (smollm3), Phi-4-mini (phi4-mini) or Qwen3.5-2B / 4B (qwen35-2b, qwen35-4b) |
otpu-smi | temperature, power, DRAM bandwidth and per-unit utilization |
otpu-lens | record a run and open it in the profiler |
otpu-selftest, otpu-diag | check that the card works |
Where to start reading
- docs/isa.md: the instruction set. Everything else is built on it.
opentpu/kernelsand docs/compiler.md: how a kernel becomes instructions.opentpu/isasim.py: the simulator, which is the spec.rtl/: the hardware, starting fromrtl/top/otpu_top.sv.- docs/lfm2.md, docs/qwen35.md, docs/llama.md, docs/benchmarks.md: whole models and where their cycles go.
- docs/board.md: the physical card, from clocks to PCIe.
What's next
- The last few percent of DRAM. Decode is bound by DRAM efficiency: it reads 82 to 85% of the DDR3-1066 peak. Work on the LiteDRAM path's efficiency is under way.
- Timing margin and area. The design closes 133.33 MHz, the clock at which the 128-byte port matches the two DDR3 channels, but only just (WNS +0.032 ns). A tournament of Vivado runs keeps working on its margin and area. Decode is bound by DRAM, so a faster clock mostly helps prefill.
- Faster prefill. The four-column systolic matrix unit is in the production image; prefill is still limited by the matrix unit's multiply rate.
Contributing
Issues and pull requests are welcome, and most of the work needs only Python and Verilator, not
an FPGA. Changes to the ISA, the simulator or the RTL must keep python3 -m pytest -q passing,
and performance claims should say how they were measured.
License
Apache License 2.0. See LICENSE.