TelecomTS: A Multi-Modal Telecom Dataset
See the code
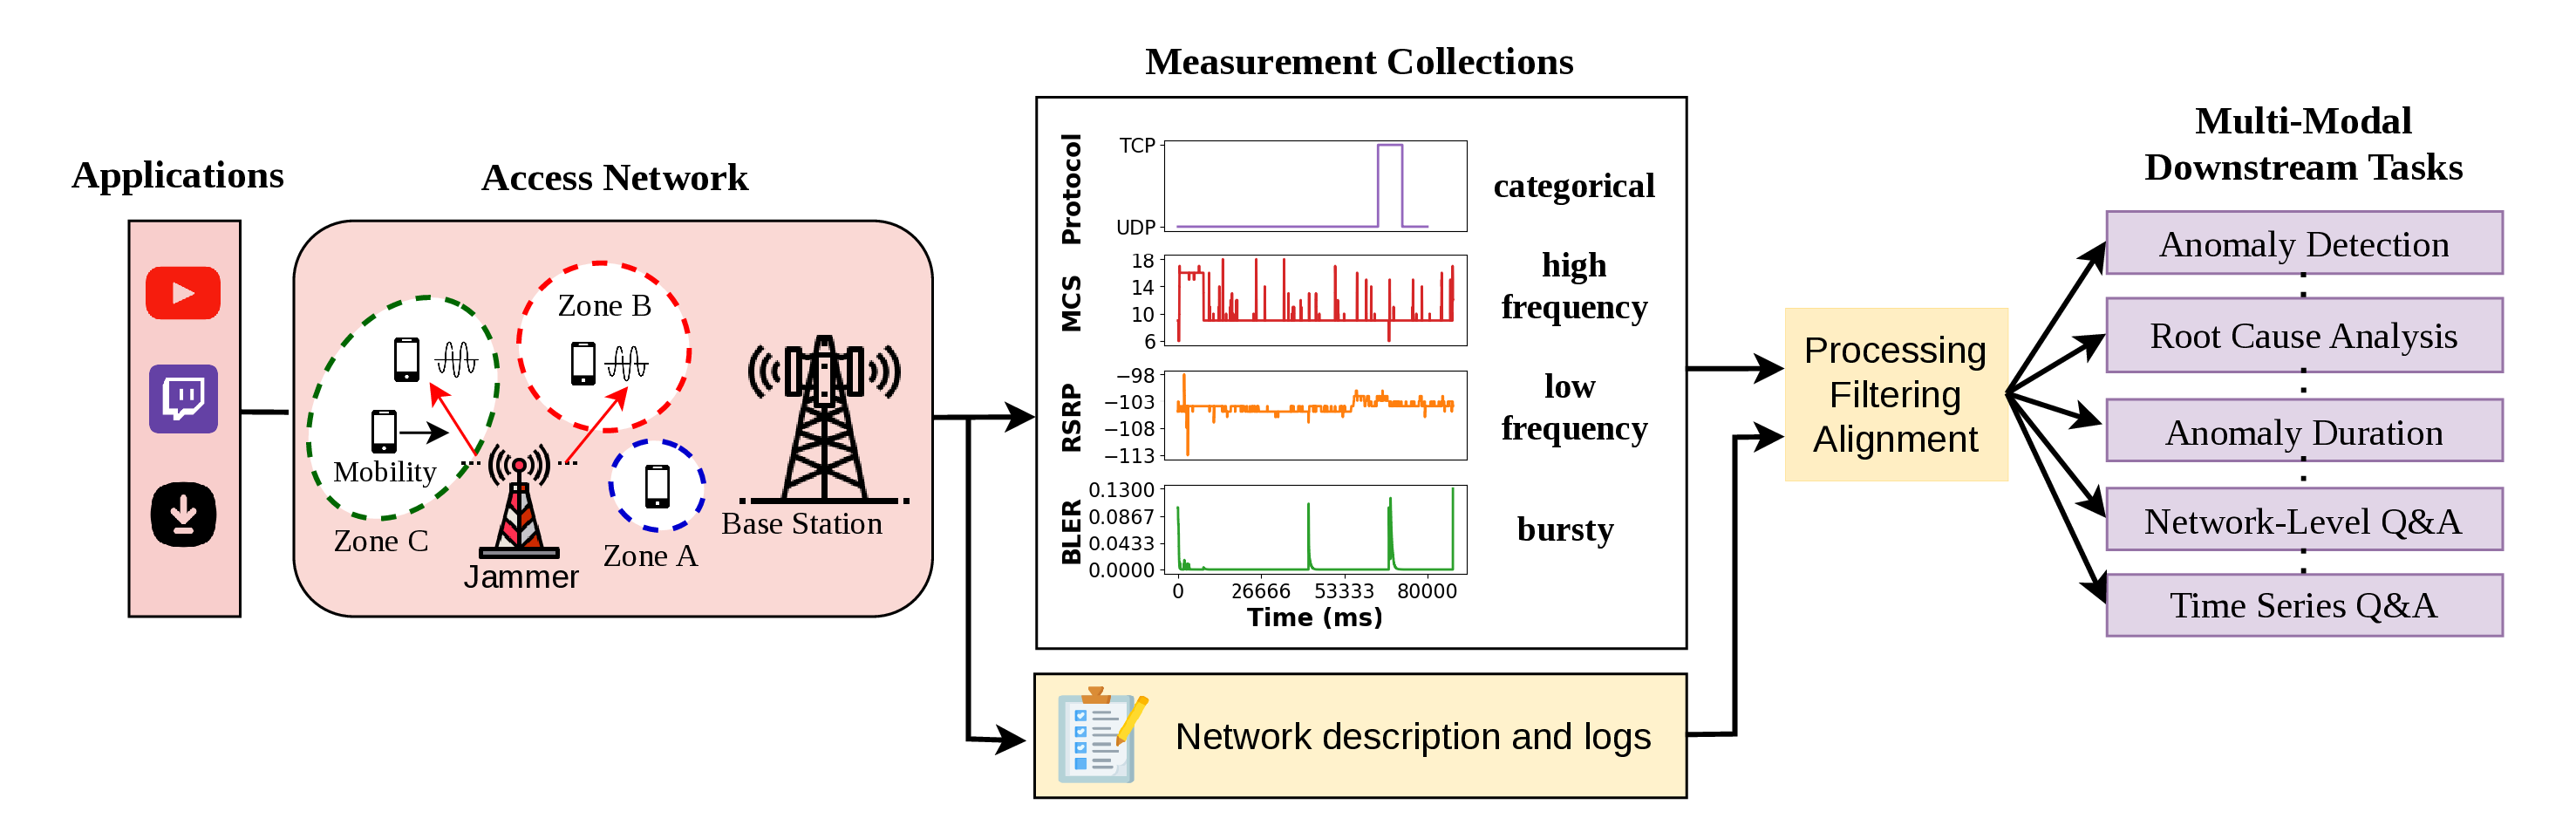





TelecomTS is a large-scale, high-resolution, multi-modal dataset derived from a 5G telecommunications testbed. It is the first public observability dataset to preserve de-anonymized observability metrics with absolute scale information, encompassing by design a broad suite of multi-modal downstream tasks:
Observability data, particularly in telecommunications, differs fundamentally from conventional time series (e.g., weather, finance) by being:
Each sample in TelecomTS contains:
start_time / end_time — temporal boundaries of the chunk
sampling_rate_hz — number of timesteps per second
description — natural-language summary of the network environment and time series behaviors
KPIs — key performance indicator names and values
anomalies — existence, type, duration, affected KPIs, and troubleshooting tickets
statistics — mean, variance, trend, and periodicity for each KPI
labels — contextual metadata (zone, application, mobility, congestion, anomaly presence)
QnA — natural-language Q&A over the sample, grouped into timeseries, network, and anomalies subcategories. Each entry of has the following structure:
{ "q": "What activity was the user engaged in?",
  "a": "Twitch",
  "reasoning": "Sustained downlink throughput in the 2–4 Mbps range with periodic UDP bursts and stable RSRP is consistent with live video streaming..." }
The reasoning field, present in the last two subcategories, contains an explicit reasoning trace that reveals the intermediate decision-making steps used to derive the final answer.
| Statistic | Description | Count |
|---|---|---|
| Time Series Samples | Total samples | 32,000 |
| Sample length | 128 | |
| Channels | Total channels | 18 |
| Channel types | 10 float, 6 integer, 2 categorical | |
| Anomalies | Anomaly types | 11 |
| Q&A Categories | Time Series Q&A categories | 64 |
| Network-Level Q&A categories | 4 | |
| Anomalies Q&A categories | 3 | |
| Total QA Size | Total QA instances | 2,210,185 |
TelecomTS is hosted on the Hugging Face Hub at AliMaatouk/TelecomTS. You can load it directly with the 🤗 datasets library:
from datasets import load_dataset

dataset = load_dataset(
    "AliMaatouk/TelecomTS",
    data_files={"full": "**/chunked.jsonl"},
)["full"]

print(dataset)
The benchmarking pipeline in this repo fetches the data automatically — no manual download is required.
Requires Python 3.11
# 1) Clone
git clone https://github.com/Ali-maatouk/TelecomTS.git
cd TelecomTS

# 2) Create & activate a virtual environment
python3.11 -m venv .venv
# macOS/Linux:
source .venv/bin/activate
# Windows (PowerShell):
# .venv\Scripts\Activate.ps1

# 3) Install dependencies
python -m pip install --upgrade pip
pip install -r requirements.txt

# 4) Run (uses configs/config.yaml)
# The dataset is fetched automatically from the Hugging Face Hub
# (AliMaatouk/TelecomTS) on first run and cached locally.
# This trains the selected encoder on the chosen task and then evaluates it.
python3 src/run.py
Choose the model and the task in configs/config.yaml. Running python3 src/run.py trains the selected model and evaluates it on the chosen task.
Tasks (task_type)
anomaly detectionroot-cause analysisanomaly durationforecastingEncoders (encoder_type)
TimesNetAutoformerNonStationary_TransformerFEDformerInformerYou can find the paper with all details at https://arxiv.org/abs/2510.06063. Please cite it as follows:
@misc{feng2025telecomtsmultimodalobservabilitydataset,
      title={TelecomTS: A Multi-Modal Observability Dataset for Time Series and Language Analysis},
      author={Austin Feng and Andreas Varvarigos and Ioannis Panitsas and Daniela Fernandez and Jinbiao Wei and Yuwei Guo and Jialin Chen and Ali Maatouk and Leandros Tassiulas and Rex Ying},
      year={2025},
      eprint={2510.06063},
      archivePrefix={arXiv},
      primaryClass={cs.AI},
      url={https://arxiv.org/abs/2510.06063},
}
TelecomTS: A Multi-Modal Telecom Dataset
See the code
TelecomTS is a large-scale, high-resolution, multi-modal dataset derived from a 5G telecommunications testbed. It is the first public observability dataset to preserve de-anonymized observability metrics with absolute scale information, encompassing by design a broad suite of multi-modal downstream tasks:
Observability data, particularly in telecommunications, differs fundamentally from conventional time series (e.g., weather, finance) by being:
Each sample in TelecomTS contains:
start_time / end_time — temporal boundaries of the chunk
sampling_rate_hz — number of timesteps per second
description — natural-language summary of the network environment and time series behaviors
KPIs — key performance indicator names and values
anomalies — existence, type, duration, affected KPIs, and troubleshooting tickets
statistics — mean, variance, trend, and periodicity for each KPI
labels — contextual metadata (zone, application, mobility, congestion, anomaly presence)
QnA — natural-language Q&A over the sample, grouped into timeseries, network, and anomalies subcategories. Each entry of has the following structure:
{ "q": "What activity was the user engaged in?",
  "a": "Twitch",
  "reasoning": "Sustained downlink throughput in the 2–4 Mbps range with periodic UDP bursts and stable RSRP is consistent with live video streaming..." }
The reasoning field, present in the last two subcategories, contains an explicit reasoning trace that reveals the intermediate decision-making steps used to derive the final answer.
| Statistic | Description | Count |
|---|---|---|
| Time Series Samples | Total samples | 32,000 |
| Sample length | 128 | |
| Channels | Total channels | 18 |
| Channel types | 10 float, 6 integer, 2 categorical | |
| Anomalies | Anomaly types | 11 |
| Q&A Categories | Time Series Q&A categories | 64 |
| Network-Level Q&A categories | 4 | |
| Anomalies Q&A categories | 3 | |
| Total QA Size | Total QA instances | 2,210,185 |
TelecomTS is hosted on the Hugging Face Hub at AliMaatouk/TelecomTS. You can load it directly with the 🤗 datasets library:
from datasets import load_dataset

dataset = load_dataset(
    "AliMaatouk/TelecomTS",
    data_files={"full": "**/chunked.jsonl"},
)["full"]

print(dataset)
The benchmarking pipeline in this repo fetches the data automatically — no manual download is required.
Requires Python 3.11
# 1) Clone
git clone https://github.com/Ali-maatouk/TelecomTS.git
cd TelecomTS

# 2) Create & activate a virtual environment
python3.11 -m venv .venv
# macOS/Linux:
source .venv/bin/activate
# Windows (PowerShell):
# .venv\Scripts\Activate.ps1

# 3) Install dependencies
python -m pip install --upgrade pip
pip install -r requirements.txt

# 4) Run (uses configs/config.yaml)
# The dataset is fetched automatically from the Hugging Face Hub
# (AliMaatouk/TelecomTS) on first run and cached locally.
# This trains the selected encoder on the chosen task and then evaluates it.
python3 src/run.py
Choose the model and the task in configs/config.yaml. Running python3 src/run.py trains the selected model and evaluates it on the chosen task.
Tasks (task_type)
anomaly detectionroot-cause analysisanomaly durationforecastingEncoders (encoder_type)
TimesNetAutoformerNonStationary_TransformerFEDformerInformerYou can find the paper with all details at https://arxiv.org/abs/2510.06063. Please cite it as follows:
@misc{feng2025telecomtsmultimodalobservabilitydataset,
      title={TelecomTS: A Multi-Modal Observability Dataset for Time Series and Language Analysis},
      author={Austin Feng and Andreas Varvarigos and Ioannis Panitsas and Daniela Fernandez and Jinbiao Wei and Yuwei Guo and Jialin Chen and Ali Maatouk and Leandros Tassiulas and Rex Ying},
      year={2025},
      eprint={2510.06063},
      archivePrefix={arXiv},
      primaryClass={cs.AI},
      url={https://arxiv.org/abs/2510.06063},
}