
Self-hosted monitoring: Prometheus + Grafana + Alertmanager + Ansible. One-command deploy, 7 dashboards, Telegram alerts, fail2ban, multi-server. Ready in 15 min.
See the codeSee what people are saying
README
Monitoring Stack


Self-hosted monitoring for Linux servers — Prometheus · Grafana · Alertmanager · Ansible · fail2ban.
One-command deploy, 7 pre-built dashboards, Telegram alerts, multi-server support. Ready in 15 minutes.
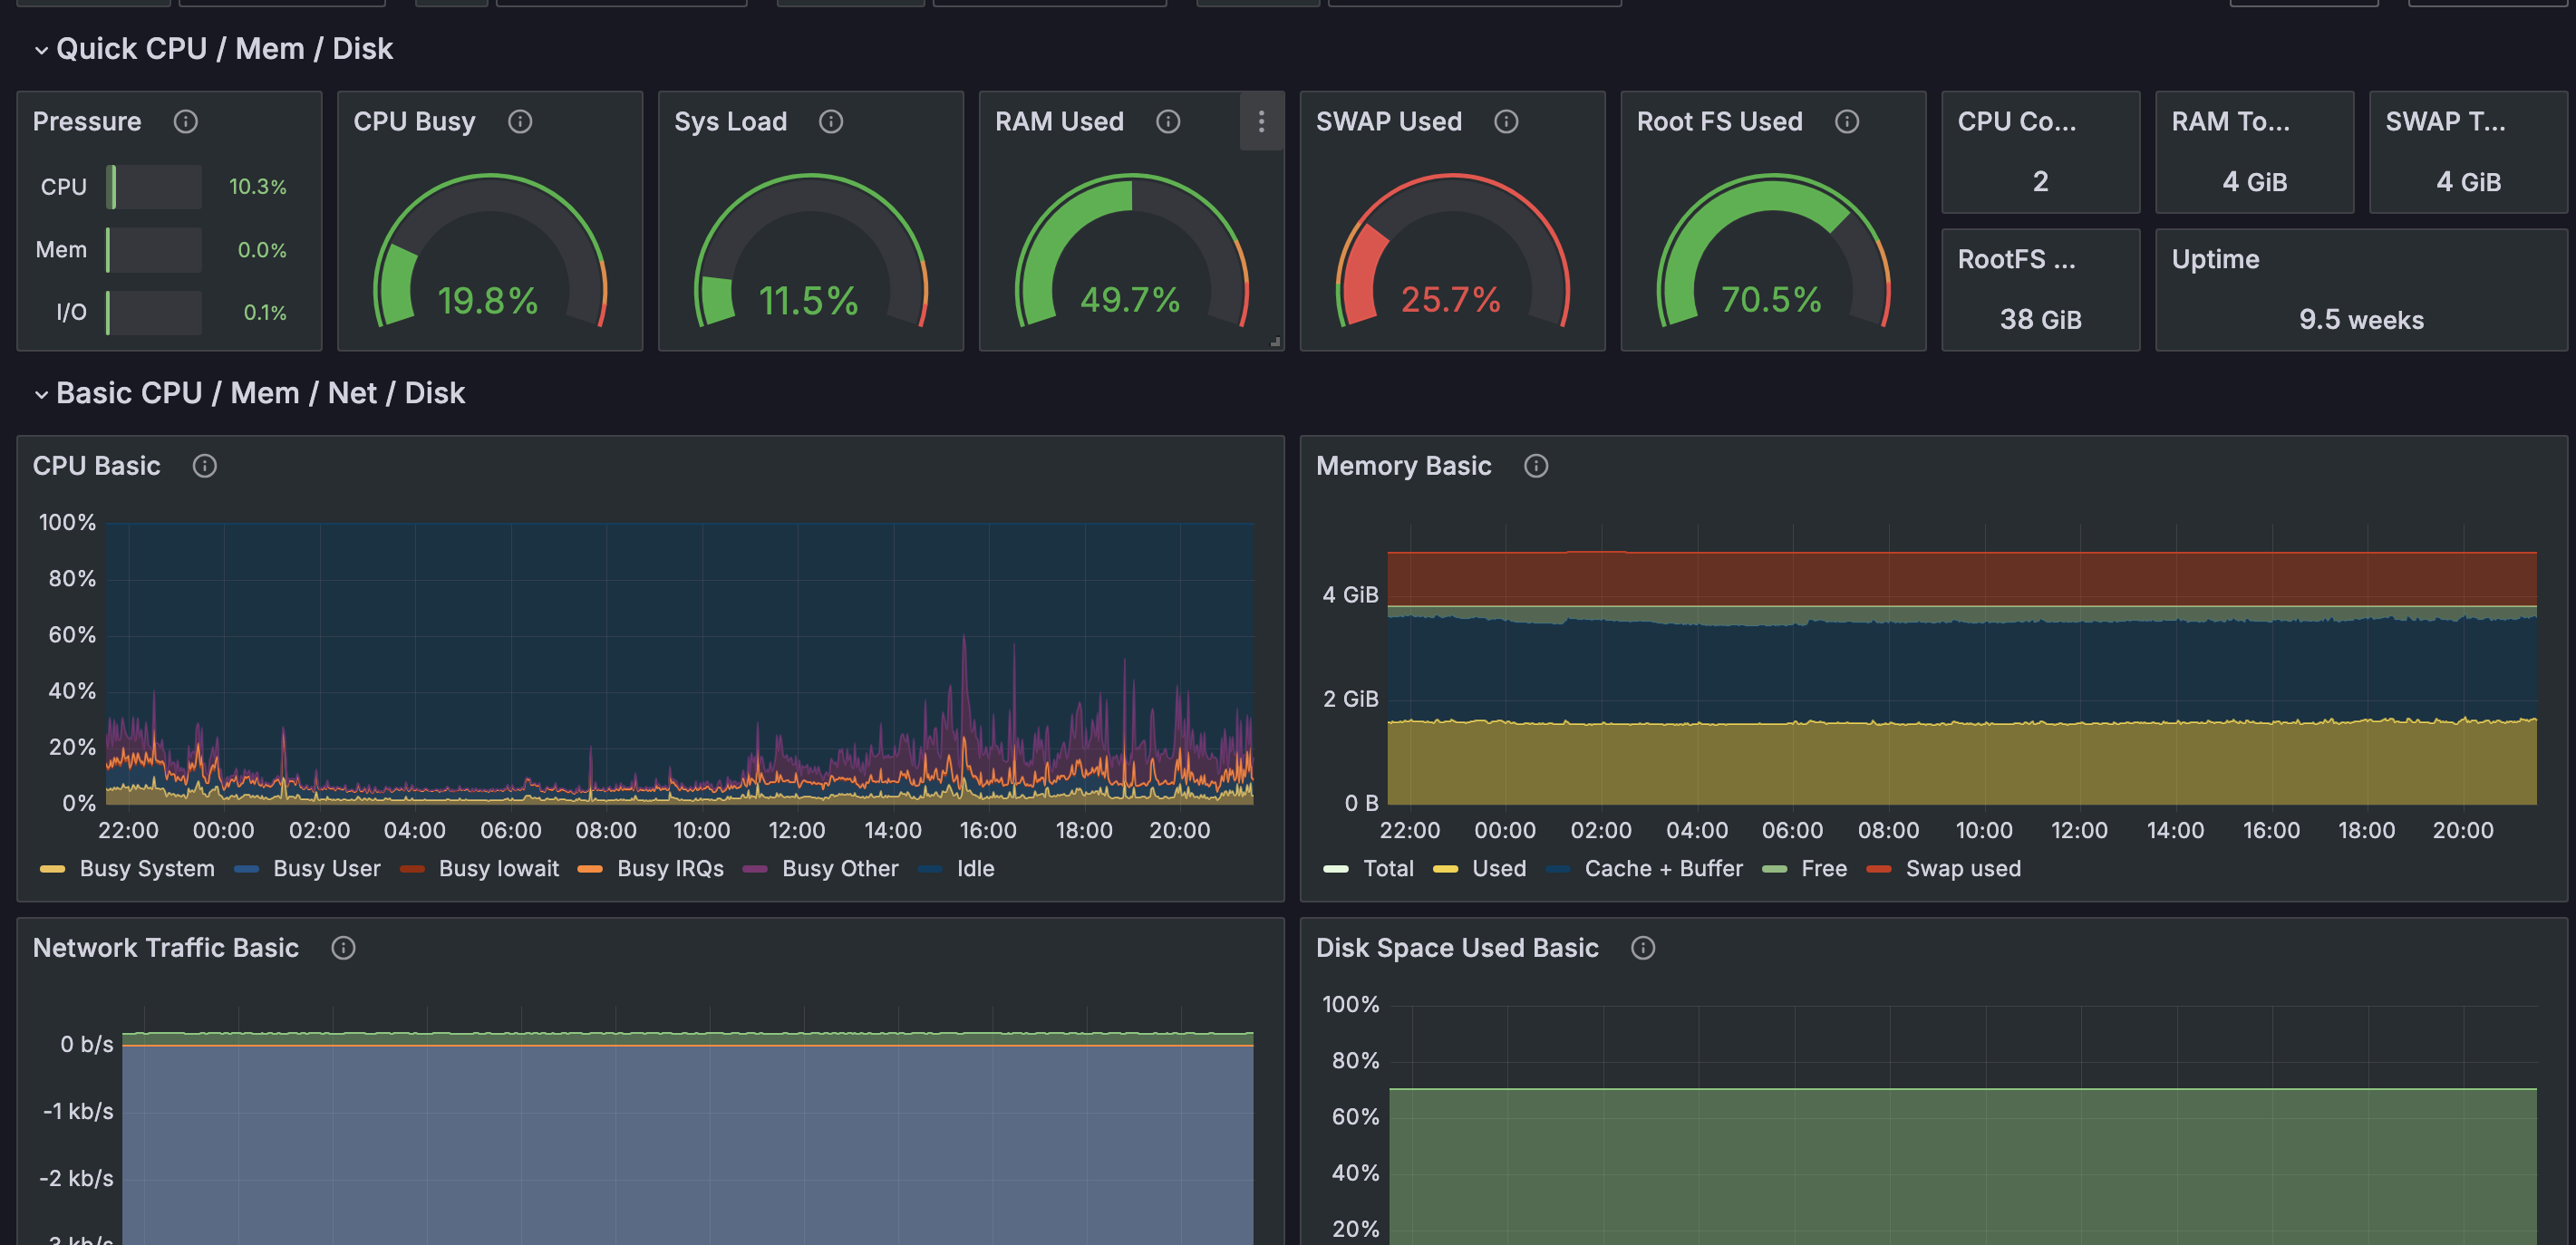
What's included
| Component | Details |
|---|---|
| Core stack | Prometheus · Grafana · Alertmanager · Node Exporter · Blackbox Exporter |
| Security | fail2ban integration — ban events visible in Grafana |
| Ansible automation | One-command full deployment + Node Exporter on remote hosts |
| Dashboards | 7 pre-built JSON dashboards (see below) |
| Alerts | 20 production-ready alert rules |
| Multi-server | Monitor N servers from one Grafana instance |
| Backups | Automated backup script with optional cron |
| Documentation | 20 guides: deployment, security, operations, runbook, troubleshooting |
Dashboards
Pre-built Grafana dashboards for immediate visibility:
| Dashboard | What it covers | Source |
|---|---|---|
| Node Exporter Full | CPU, memory, disk, network per host | grafana.com/dashboards/1860 |
| Prometheus Overview | Prometheus self-monitoring | community |
| Blackbox Exporter | HTTP/TCP endpoint uptime and latency | grafana.com/dashboards/7587 |
| Nginx | Request rate, error rate, upstreams | grafana.com/dashboards/12708 |
| PostgreSQL | Connections, locks, query performance | grafana.com/dashboards/9628 |
| Redis | Memory, ops/sec, key eviction | grafana.com/dashboards/11835 |
| RabbitMQ | Queue depth, message rate, node health | grafana.com/dashboards/10991 |
Quick Start (Docker Compose — 5 minutes)
git clone https://github.com/Airat71/monitoring-stack.git
cd monitoring-stack/prometheus-grafana
cp .env.example .env          # set GRAFANA_PASSWORD
docker compose up -d
# Grafana → http://localhost:3000  (admin / your password)
Full Deploy with Ansible (single command)
Deploys the complete stack to your server and optionally installs Node Exporter on any number of additional hosts:
cp ansible/group_vars/all.yml.example ansible/group_vars/all.yml
cp ansible/inventory.example.yml ansible/inventory.yml
# edit both files — set your server IP, SSH user, Telegram token
cd ansible && ansible-playbook -i inventory.yml playbook.yml
Step-by-step: INSTALLATION_GUIDE.md
Architecture
  [Monitored hosts]
    Node Exporter  ──┐
    fail2ban        ──┤
                     │
              [Prometheus] ──→ [Alertmanager] ──→ Telegram / Email
                     │
              [Blackbox]   (HTTP/TCP probes)
                     │
               [Grafana]   (Dashboards + Alerts UI)
Alerts
20 alert rules covering:
- Host down / unreachable
- CPU · memory · disk thresholds
- Service unavailable (HTTP, TCP probes)
- fail2ban ban events
- Prometheus self-monitoring
See alerts/alertmanager.example.yml for routing configuration.
Documentation
| Guide | Topic |
|---|---|
| INSTALLATION_GUIDE.md | Getting started, prerequisites |
| docs/DEPLOYMENT.md | Deployment options |
| docs/MULTI_SERVER.md | Monitor multiple servers |
| docs/ALERTMANAGER.md | Alert routing and receivers |
| docs/GRAFANA_DASHBOARDS.md | Dashboard import and usage |
| docs/SECURITY.md | Security hardening |
| docs/PRODUCTION_CHECKLIST.md | Pre-production checklist |
| docs/BACKUP.md | Backup and restore |
| docs/TROUBLESHOOTING.md | Common issues and fixes |
| docs/RUNBOOK.md | Operations runbook |
| docs/UPGRADE.md | Upgrade guide |
Full index: docs/INDEX.md
Requirements
| Target | What you need |
|---|---|
| Monitoring server | Docker · Docker Compose · SSH access |
| Monitored hosts | Docker (containerized Node Exporter) or systemd (binary) |
| Ansible control node | Ansible 2.9+ · Python 3 · SSH key access to all hosts |
Repository structure
monitoring-stack/
├── prometheus-grafana/     # Docker Compose stack (Prometheus, Grafana, Alertmanager, Blackbox)
├── ansible/                # Playbook + roles for full automated deployment
├── grafana-dashboards/     # Pre-built dashboard JSON files
├── alerts/                 # Alertmanager routing config example
├── scripts/                # Backup and dashboard fetch scripts
├── fail2ban/               # fail2ban integration guide
├── docs/                   # 20 guides
└── INSTALLATION_GUIDE.md   # Getting started
Contributing
PRs and issues are welcome — see CONTRIBUTING.md.
License
MIT — free for personal and commercial use.
Author
Built and maintained by Airat.
Similar repos


Languages
Jinja
51.7%
Shell
48.3%
Self-hosted monitoring: Prometheus + Grafana + Alertmanager + Ansible. One-command deploy, 7 dashboards, Telegram alerts, fail2ban, multi-server. Ready in 15 min.
See the codeSee what people are saying
README
Monitoring Stack
Self-hosted monitoring for Linux servers — Prometheus · Grafana · Alertmanager · Ansible · fail2ban.
One-command deploy, 7 pre-built dashboards, Telegram alerts, multi-server support. Ready in 15 minutes.
What's included
| Component | Details |
|---|---|
| Core stack | Prometheus · Grafana · Alertmanager · Node Exporter · Blackbox Exporter |
| Security | fail2ban integration — ban events visible in Grafana |
| Ansible automation | One-command full deployment + Node Exporter on remote hosts |
| Dashboards | 7 pre-built JSON dashboards (see below) |
| Alerts | 20 production-ready alert rules |
| Multi-server | Monitor N servers from one Grafana instance |
| Backups | Automated backup script with optional cron |
| Documentation | 20 guides: deployment, security, operations, runbook, troubleshooting |
Dashboards
Pre-built Grafana dashboards for immediate visibility:
| Dashboard | What it covers | Source |
|---|---|---|
| Node Exporter Full | CPU, memory, disk, network per host | grafana.com/dashboards/1860 |
| Prometheus Overview | Prometheus self-monitoring | community |
| Blackbox Exporter | HTTP/TCP endpoint uptime and latency | grafana.com/dashboards/7587 |
| Nginx | Request rate, error rate, upstreams | grafana.com/dashboards/12708 |
| PostgreSQL | Connections, locks, query performance | grafana.com/dashboards/9628 |
| Redis | Memory, ops/sec, key eviction | grafana.com/dashboards/11835 |
| RabbitMQ | Queue depth, message rate, node health | grafana.com/dashboards/10991 |
Quick Start (Docker Compose — 5 minutes)
git clone https://github.com/Airat71/monitoring-stack.git
cd monitoring-stack/prometheus-grafana
cp .env.example .env          # set GRAFANA_PASSWORD
docker compose up -d
# Grafana → http://localhost:3000  (admin / your password)
Full Deploy with Ansible (single command)
Deploys the complete stack to your server and optionally installs Node Exporter on any number of additional hosts:
cp ansible/group_vars/all.yml.example ansible/group_vars/all.yml
cp ansible/inventory.example.yml ansible/inventory.yml
# edit both files — set your server IP, SSH user, Telegram token
cd ansible && ansible-playbook -i inventory.yml playbook.yml
Step-by-step: INSTALLATION_GUIDE.md
Architecture
  [Monitored hosts]
    Node Exporter  ──┐
    fail2ban        ──┤
                     │
              [Prometheus] ──→ [Alertmanager] ──→ Telegram / Email
                     │
              [Blackbox]   (HTTP/TCP probes)
                     │
               [Grafana]   (Dashboards + Alerts UI)
Alerts
20 alert rules covering:
- Host down / unreachable
- CPU · memory · disk thresholds
- Service unavailable (HTTP, TCP probes)
- fail2ban ban events
- Prometheus self-monitoring
See alerts/alertmanager.example.yml for routing configuration.
Documentation
| Guide | Topic |
|---|---|
| INSTALLATION_GUIDE.md | Getting started, prerequisites |
| docs/DEPLOYMENT.md | Deployment options |
| docs/MULTI_SERVER.md | Monitor multiple servers |
| docs/ALERTMANAGER.md | Alert routing and receivers |
| docs/GRAFANA_DASHBOARDS.md | Dashboard import and usage |
| docs/SECURITY.md | Security hardening |
| docs/PRODUCTION_CHECKLIST.md | Pre-production checklist |
| docs/BACKUP.md | Backup and restore |
| docs/TROUBLESHOOTING.md | Common issues and fixes |
| docs/RUNBOOK.md | Operations runbook |
| docs/UPGRADE.md | Upgrade guide |
Full index: docs/INDEX.md
Requirements
| Target | What you need |
|---|---|
| Monitoring server | Docker · Docker Compose · SSH access |
| Monitored hosts | Docker (containerized Node Exporter) or systemd (binary) |
| Ansible control node | Ansible 2.9+ · Python 3 · SSH key access to all hosts |
Repository structure
monitoring-stack/
├── prometheus-grafana/     # Docker Compose stack (Prometheus, Grafana, Alertmanager, Blackbox)
├── ansible/                # Playbook + roles for full automated deployment
├── grafana-dashboards/     # Pre-built dashboard JSON files
├── alerts/                 # Alertmanager routing config example
├── scripts/                # Backup and dashboard fetch scripts
├── fail2ban/               # fail2ban integration guide
├── docs/                   # 20 guides
└── INSTALLATION_GUIDE.md   # Getting started
Contributing
PRs and issues are welcome — see CONTRIBUTING.md.
License
MIT — free for personal and commercial use.
Author
Built and maintained by Airat.
Similar repos
Languages
Jinja
51.7%
Shell
48.3%