
README
jeprofl
jeprofl is a memory allocation profiling tool that uses eBPF technology to analyze jemalloc allocations in your program. It may work with other allocators, but this has not been tested.

It can be used with already running program without recompilation.
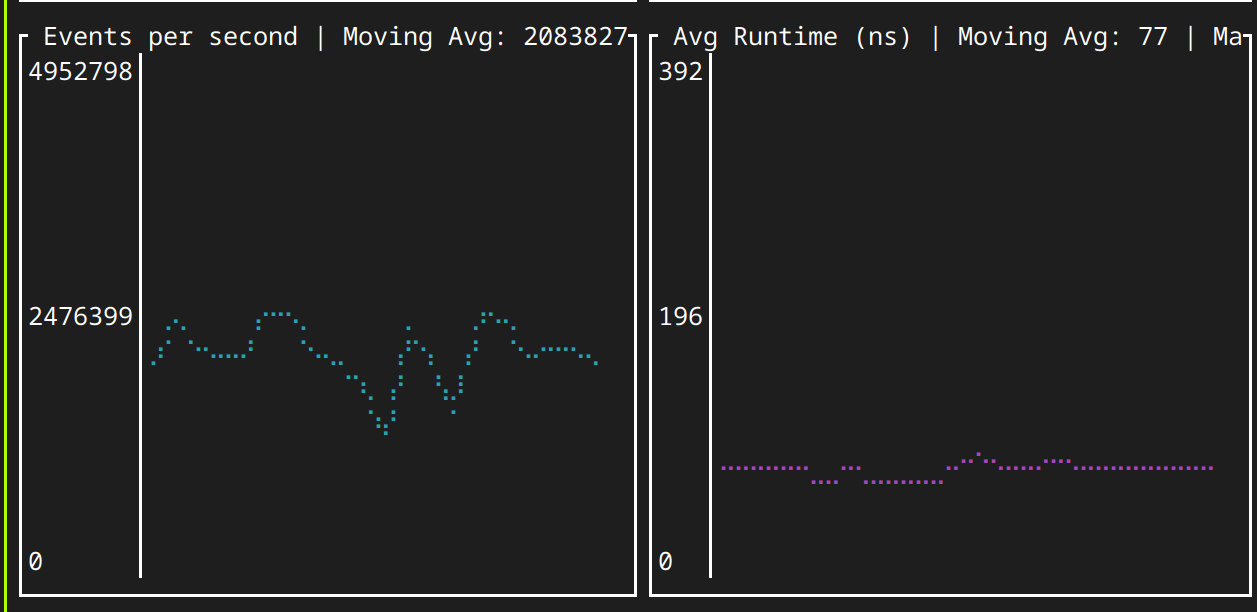
Overhead with 1000x sampling is 80 ns per call under 2.5M allocations / sec.
Features
- Attach to a specific process or program
- Support for various jemalloc allocation functions (malloc, calloc, realloc, etc.)
- Order results by allocation count or total memory traffic
- Set minimum and maximum allocation sizes to track
- Configurable event sampling
- Generate CSV output and flame graphs
- Tracks allocation histograms per stack trace (rounded to power of 2)
6ae5a0 - malloc
4e54b0 - uu_ls::enter_directory
4e54b0 - uu_ls::enter_directory
4e54b0 - uu_ls::enter_directory
4e54b0 - uu_ls::enter_directory
4db790 - uu_ls::list
23b070 - uu_ls::uumain
bb560  - coreutils::main
1c9e60 - std::sys::backtrace::__rust_begin_short_backtrace
bdf00  - main
2a010  - __libc_start_call_main
2a0c0  - __libc_start_main_alias_2
a7f00  - _start

-----------+-----------+------------+--------------------------------------------------
Size       | Count     | Percentage | Distribution
-----------+-----------+------------+--------------------------------------------------
1 B        |     16870 |      4.23% | #######
2 B        |     21716 |      5.44% | #########
4 B        |     38150 |      9.56% | ################
8 B        |    120776 |     30.27% | ##################################################
16 B       |    103586 |     25.97% | ###########################################
32 B       |     58988 |     14.79% | ########################
64 B       |      7444 |      1.87% | ###
128 B      |     14768 |      3.70% | ######
512 B      |     16638 |      4.17% | #######
Total allocations: 18.4 MiB in 398936 allocations
- Minimal overhead
Limitations
- Only works with statically linked programs(for now). Can work with dynamically linked programs, but you should provide the path to the dylib.
Prerequisites
- Install bpf-linker:
cargo install bpf-linker - Linux kernel with eBPF support
- Root privileges (for attaching to processes)
Usage
Options:
--pid <PID>: Attach to a specific process ID--function <FUNCTION>: Specify the jemalloc function to trace (default: malloc)--order-by <ORDER>: Order results by 'count' or 'traffic' (default: traffic) Traffic is the total allocated size, count is the number of malloc calls.--max-alloc-size <SIZE>: Maximum allocation size to track--min-alloc-size <SIZE>: Minimum allocation size to track--sample-every <N>: Sample every Nth event--skip-size <SIZE>: Skip allocations with total allocated < SIZE bytes--skip-count <COUNT>: Skip stack traces with total allocations count < COUNT--csv <PATH>: Generate CSV output: pid, stack_id, total allocations in bytes, count, histogram "stacktrace"--flame <PATH>: Generate flame graph
Example:
RUST_LOG=info cargo xtask run --release -- --program ~/dev/oss/coreutils/target/release/coreutils --order-by count --sample-every 100 --skip-count 100 --csv malocs.csv -f malloc --flame malocs.svg
This will profile malloc calls in ls program, order results by total allocated count, generate a CSV output, and create a flame graph.
How it works
Ebpf program is attached to malloc function in the target program. For every nth call it tracks stacktrace and size of allocation and store it to cpu-local hashmap.
Userspace program polls these maps and resolves stacktraces to symbols. On ctrl+c signal it aggregates all data and prints it.
Todo
- Aggregate histogram in kernel space. For now, we're just dumping all the data to userspace, which gives 1us overhead per call which is unacceptable. Pure uprobe uses 20ns per call.
- Find which malloc is used (now we assume that target is statically linked)
- Add ratatui based TUI
- Produce flamegraphs
- Add docs and examples
- somehow proof to ebpf verifier that number [0,1] is valid index for function call. For now, it gives amazing errors like:
Error: the BPF_PROG_LOAD syscall failed. Verifier output: 0: R1=ctx() R10=fp0
0: (bf) r6 = r1                       ; R1=ctx() R6_w=ctx()
1: (b7) r1 = 4                        ; R1_w=4
2: (63) *(u32 *)(r10 -280) = r1       ; R1_w=4 R10=fp0 fp-280=????4
3: (bf) r2 = r10                      ; R2_w=fp0 R10=fp0
4: (07) r2 += -280                    ; R2_w=fp-280
5: (18) r1 = 0xffff9f84a9a0dc00       ; R1_w=map_ptr(map=CONFIG,ks=4,vs=8)
7: (85) call bpf_map_lookup_elem#1    ; R0_w=map_value_or_null(id=1,map=CONFIG,ks=4,vs=8)
8: (15) if r0 == 0x0 goto pc+152      ; R0_w=map_value(map=CONFIG,ks=4,vs=8)
9: (79) r2 = *(u64 *)(r0 +0)          ; R0=map_value(map=CONFIG,ks=4,vs=8) R2=scalar()
10: (65) if r2 s> 0x2 goto pc+7       ; R2=scalar(smax=2)
11: (b7) r1 = 112                     ; R1_w=112
12: (15) if r2 == 0x0 goto pc+16      ; R2=scalar(smax=2,umin=1)
13: (15) if r2 == 0x1 goto pc+12      ; R2=scalar(smax=2,umin=2)
14: (15) if r2 == 0x2 goto pc+1 16: R0=map_value(map=CONFIG,ks=4,vs=8) R1=112 R2=2 R6=ctx() R10=fp0 fp-280=????mmmm
16: (b7) r1 = 96                      ; R1_w=96
17: (05) goto pc+11
29: (bf) r2 = r6                      ; R2_w=ctx() R6=ctx()
30: (0f) r2 += r1                     ; R1_w=96 R2_w=ctx(off=96)
31: (79) r8 = *(u64 *)(r2 +0)
dereference of modified ctx ptr R2 off=96 disallowed
verification time 73 usec
stack depth 280+0
processed 22 insns (limit 1000000) max_states_per_insn 0 total_states 2 peak_states 2 mark_read 2
License
Apache 2.0 or MIT
Contributing
Contributions are welcome! Please feel free to submit a Pull Request.
Contributors

10 commits
Similar repos


Languages
Rust
99.7%
README
jeprofl
jeprofl is a memory allocation profiling tool that uses eBPF technology to analyze jemalloc allocations in your program. It may work with other allocators, but this has not been tested.
It can be used with already running program without recompilation.
Overhead with 1000x sampling is 80 ns per call under 2.5M allocations / sec.
Features
- Attach to a specific process or program
- Support for various jemalloc allocation functions (malloc, calloc, realloc, etc.)
- Order results by allocation count or total memory traffic
- Set minimum and maximum allocation sizes to track
- Configurable event sampling
- Generate CSV output and flame graphs
- Tracks allocation histograms per stack trace (rounded to power of 2)
6ae5a0 - malloc
4e54b0 - uu_ls::enter_directory
4e54b0 - uu_ls::enter_directory
4e54b0 - uu_ls::enter_directory
4e54b0 - uu_ls::enter_directory
4db790 - uu_ls::list
23b070 - uu_ls::uumain
bb560  - coreutils::main
1c9e60 - std::sys::backtrace::__rust_begin_short_backtrace
bdf00  - main
2a010  - __libc_start_call_main
2a0c0  - __libc_start_main_alias_2
a7f00  - _start

-----------+-----------+------------+--------------------------------------------------
Size       | Count     | Percentage | Distribution
-----------+-----------+------------+--------------------------------------------------
1 B        |     16870 |      4.23% | #######
2 B        |     21716 |      5.44% | #########
4 B        |     38150 |      9.56% | ################
8 B        |    120776 |     30.27% | ##################################################
16 B       |    103586 |     25.97% | ###########################################
32 B       |     58988 |     14.79% | ########################
64 B       |      7444 |      1.87% | ###
128 B      |     14768 |      3.70% | ######
512 B      |     16638 |      4.17% | #######
Total allocations: 18.4 MiB in 398936 allocations
- Minimal overhead
Limitations
- Only works with statically linked programs(for now). Can work with dynamically linked programs, but you should provide the path to the dylib.
Prerequisites
- Install bpf-linker:
cargo install bpf-linker - Linux kernel with eBPF support
- Root privileges (for attaching to processes)
Usage
Options:
--pid <PID>: Attach to a specific process ID--function <FUNCTION>: Specify the jemalloc function to trace (default: malloc)--order-by <ORDER>: Order results by 'count' or 'traffic' (default: traffic) Traffic is the total allocated size, count is the number of malloc calls.--max-alloc-size <SIZE>: Maximum allocation size to track--min-alloc-size <SIZE>: Minimum allocation size to track--sample-every <N>: Sample every Nth event--skip-size <SIZE>: Skip allocations with total allocated < SIZE bytes--skip-count <COUNT>: Skip stack traces with total allocations count < COUNT--csv <PATH>: Generate CSV output: pid, stack_id, total allocations in bytes, count, histogram "stacktrace"--flame <PATH>: Generate flame graph
Example:
RUST_LOG=info cargo xtask run --release -- --program ~/dev/oss/coreutils/target/release/coreutils --order-by count --sample-every 100 --skip-count 100 --csv malocs.csv -f malloc --flame malocs.svg
This will profile malloc calls in ls program, order results by total allocated count, generate a CSV output, and create a flame graph.
How it works
Ebpf program is attached to malloc function in the target program. For every nth call it tracks stacktrace and size of allocation and store it to cpu-local hashmap.
Userspace program polls these maps and resolves stacktraces to symbols. On ctrl+c signal it aggregates all data and prints it.
Todo
- Aggregate histogram in kernel space. For now, we're just dumping all the data to userspace, which gives 1us overhead per call which is unacceptable. Pure uprobe uses 20ns per call.
- Find which malloc is used (now we assume that target is statically linked)
- Add ratatui based TUI
- Produce flamegraphs
- Add docs and examples
- somehow proof to ebpf verifier that number [0,1] is valid index for function call. For now, it gives amazing errors like:
Error: the BPF_PROG_LOAD syscall failed. Verifier output: 0: R1=ctx() R10=fp0
0: (bf) r6 = r1                       ; R1=ctx() R6_w=ctx()
1: (b7) r1 = 4                        ; R1_w=4
2: (63) *(u32 *)(r10 -280) = r1       ; R1_w=4 R10=fp0 fp-280=????4
3: (bf) r2 = r10                      ; R2_w=fp0 R10=fp0
4: (07) r2 += -280                    ; R2_w=fp-280
5: (18) r1 = 0xffff9f84a9a0dc00       ; R1_w=map_ptr(map=CONFIG,ks=4,vs=8)
7: (85) call bpf_map_lookup_elem#1    ; R0_w=map_value_or_null(id=1,map=CONFIG,ks=4,vs=8)
8: (15) if r0 == 0x0 goto pc+152      ; R0_w=map_value(map=CONFIG,ks=4,vs=8)
9: (79) r2 = *(u64 *)(r0 +0)          ; R0=map_value(map=CONFIG,ks=4,vs=8) R2=scalar()
10: (65) if r2 s> 0x2 goto pc+7       ; R2=scalar(smax=2)
11: (b7) r1 = 112                     ; R1_w=112
12: (15) if r2 == 0x0 goto pc+16      ; R2=scalar(smax=2,umin=1)
13: (15) if r2 == 0x1 goto pc+12      ; R2=scalar(smax=2,umin=2)
14: (15) if r2 == 0x2 goto pc+1 16: R0=map_value(map=CONFIG,ks=4,vs=8) R1=112 R2=2 R6=ctx() R10=fp0 fp-280=????mmmm
16: (b7) r1 = 96                      ; R1_w=96
17: (05) goto pc+11
29: (bf) r2 = r6                      ; R2_w=ctx() R6=ctx()
30: (0f) r2 += r1                     ; R1_w=96 R2_w=ctx(off=96)
31: (79) r8 = *(u64 *)(r2 +0)
dereference of modified ctx ptr R2 off=96 disallowed
verification time 73 usec
stack depth 280+0
processed 22 insns (limit 1000000) max_states_per_insn 0 total_states 2 peak_states 2 mark_read 2
License
Apache 2.0 or MIT
Contributing
Contributions are welcome! Please feel free to submit a Pull Request.
Similar repos
Contributors
10 commits
Languages
Rust
99.7%