
A seed-driven simulator for generating synthetic Type 1 Diabetes blood glucose data.
Python
2
153 commits
updated Oct 4, 2026
See what people are saying
README
T1DM Patient Behavior Simulator
A seed-driven simulator for generating synthetic Type 1 Diabetes blood glucose data. Unlike traditional glucose-insulin simulators (e.g., UVA/Padova), it models patient behavior as the primary driver of blood sugar outcomes: factor curves -- carbohydrate intake, insulin action, insulin sensitivity, and exercise -- are generated, and blood sugar emerges from their interactions.
Designed by a T1DM patient, informed by lived experience.
[!CAUTION] Research and educational use only. This project is a synthetic-data generator and a behavioral model of Type 1 Diabetes — not a medical device, and not clinically validated. Its output is artificial data, not real patient measurements, and must not be used to make medical, diagnostic, or treatment decisions, to calculate or adjust insulin doses, or to guide diabetes management in any way. For medical advice, consult a qualified healthcare professional. The software is provided "as is", without warranty of any kind, and the authors accept no liability for any use.
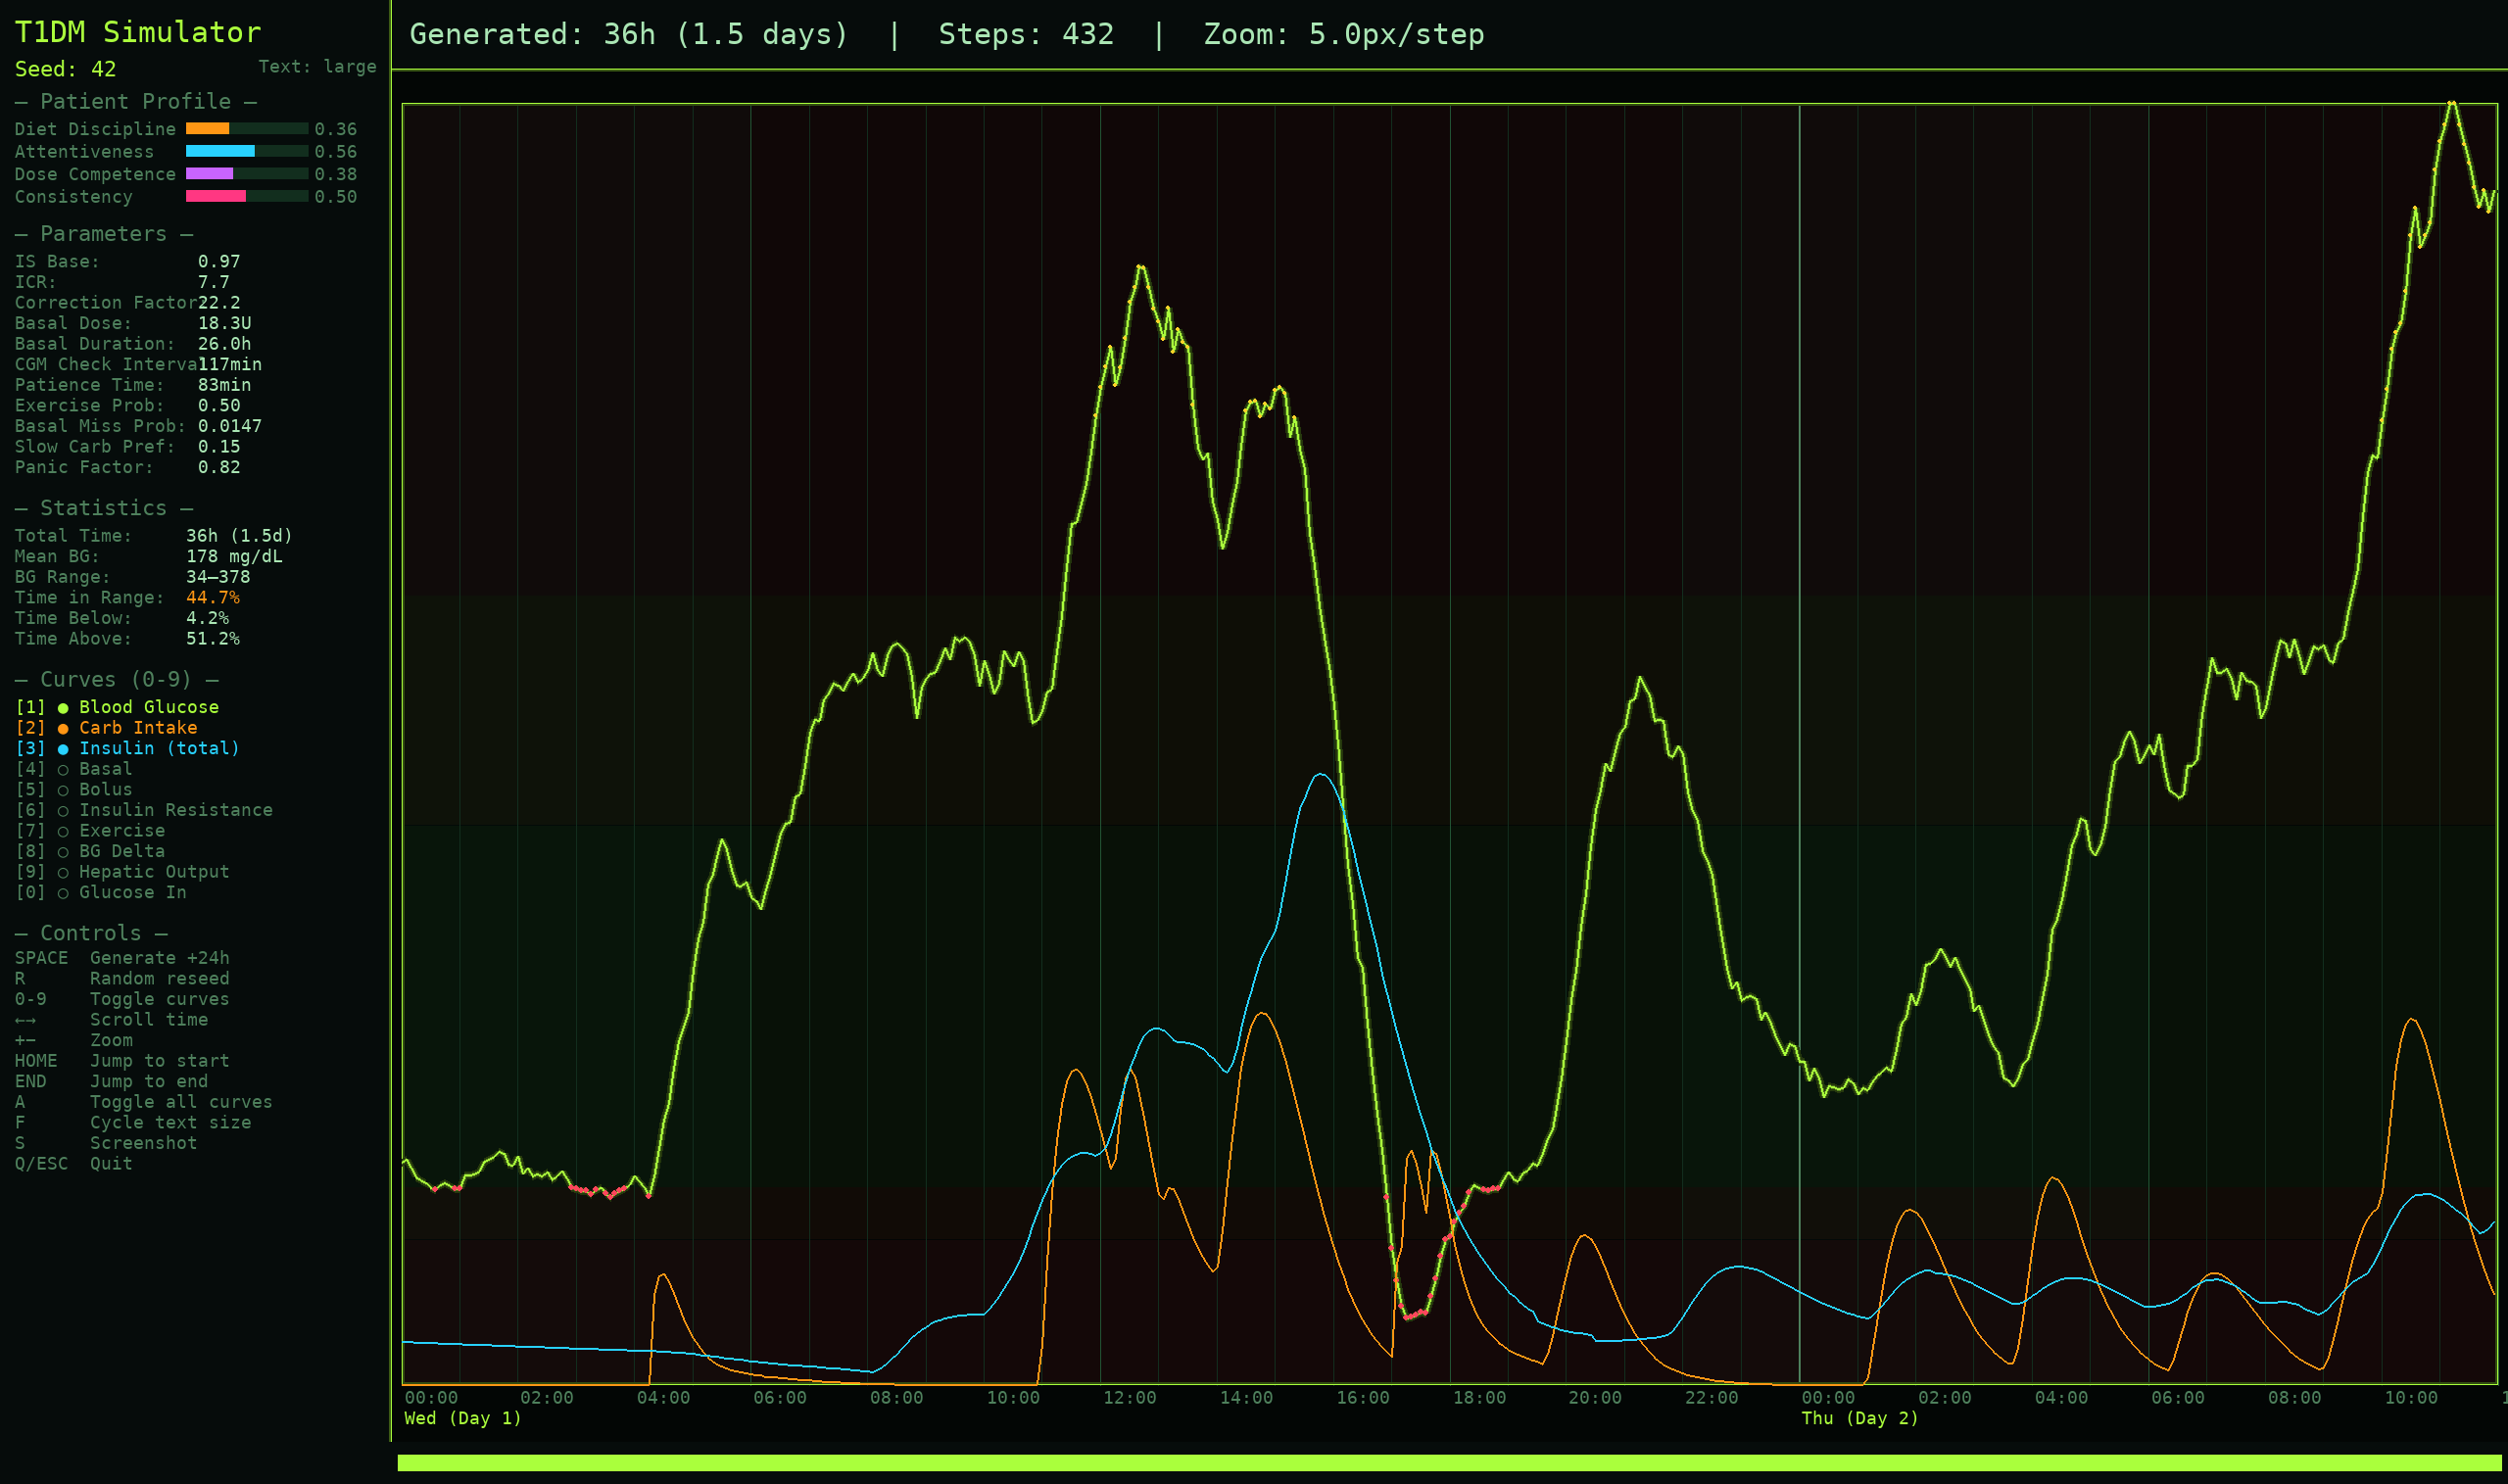
Table of contents
- Motivation
- Design Principles
- Architecture
- Blood Sugar Computation
- Patient Model
- Insulin Sensitivity Model
- Behavioral Events
- Installation and Usage
- Visualizer Controls
- Comparison Against Real-World Datasets
- Comparison Against the UVA/Padova Simulator
- Testing
- References
- Related Projects
- License
Motivation
Most T1DM simulators model physiology: glucose kinetics, insulin pharmacokinetics, compartmental models. They produce accurate BG traces but need dozens of physiological parameters that are hard to measure and vary between patients.
This one models the person, not the pancreas. Most real-world blood sugar variance comes from behavioral decisions -- what the patient eats, when they bolus, how they correct, whether they exercise -- not from subtle physiological differences. Generating diverse behavioral patterns and computing BG as a consequence yields training data whose target is what patients do, with blood sugar as the outcome: a near-unlimited stream of synthetic factor curves for pretraining personalized blood sugar prediction models, with real patient data reserved for fine-tuning.
Design Principles
-
Every factor is a curve, not a number. 40g of bread and 40g of orange juice both contribute 40g of carbs, but the juice's absorption peaks faster and falls faster. The same applies to rapid-acting vs long-acting insulin.
-
Behavior is driven by a latent skill profile. Four correlated skill dimensions decide what a patient eats, when, how accurately they dose, and how quickly they correct.
-
The liver is an insulin-suppressed feeding session. Hepatic glucose output (HGO) is a steady stream of "food" entering the bloodstream, throttled down by a Hill function of EMA-smoothed plasma insulin. A finite hepatic glycogen reservoir gates the glycogenolysis fraction, and large meals schedule a delayed HGO rebound 3.5-5.5h later — the mechanism behind nocturnal hyperglycemia after a big dinner. Basal insulin exists to counteract baseline HGO.
-
Exercise is negative food. Aerobic exercise pulls glucose out of the bloodstream into muscle cells, modeled as a negative carb-equivalent curve plus a lasting insulin-sensitivity boost.
-
Everything is seed-driven. A single integer fixes the patient's personality, physiology, daily schedule, meal choices, insulin doses, exercise patterns, illness events, and random noise. Same seed, same simulation, always.
Architecture

A seed fixes the virtual patient. A day planner turns that patient's latent skills into events, each event becomes a factor curve, and the metabolic core combines the curves into a 5-minute blood sugar delta. Solid arrows carry glucose or insulin and are badged by their effect on BG (⊕ raises, ⊖ lowers, ÷ divides the insulin term); the dashed arrow is multiplicative modulation; the dotted arrows are the two feedback loops -- the patient doses against the sensor rather than the true BG, and sustained hyperglycemia raises insulin resistance.
Blood Sugar Computation
At each 5-minute time step, the BG delta is computed as:
glucose_in  = carbs + hepatic_output - exercise
glucose_out = insulin_units * ICR / insulin_sensitivity
delta_BG    = alpha * (glucose_in - glucose_out) + S_g * (E(t) - BG)
alpha is BG_SCALE_FACTOR, the master constant converting abstract units to mg/dL. Insulin sensitivity divides the clearance term: resistant patients (IS > 1) clear less glucose per unit insulin, sensitive patients (IS < 1) clear more. HGO suppression by insulin is handled separately by the Hill function, so IS modulates only peripheral insulin action.
S_g * (E(t) - BG) is glucose effectiveness — the Bergman-minimal-model insulin-independent pull toward a stochastic equilibrium E(t), without which within-band BG would drift as an undamped integrator of net flux. It is set to zero: below 180 mg/dL only insulin brings blood sugar down.
Absorption noise perturbs the carbs and insulin that reach the blood; the recorded carb and insulin channels are the declared curves.
Three physiological guardrails are then applied to the delta:
- Renal clearance: above 180 mg/dL, the kidneys excrete glucose proportionally to the excess, at the rate the UVA/Padova simulator uses.
- Counter-regulatory response: below 70 mg/dL, glucagon and cortisol add glucose in proportion to the deficit.
- Severe-hypo glucagon term: below
SEVERE_HYPO_THRESHOLD, a further release proportional to severity.
Both low-side terms are weak, so a unit of insulin lowers BG by about the same amount from 105 as from 190 mg/dL. True BG has no floor; a soft ceiling and a hard clamp at 400 mg/dL bound it above. The CGM reading is clipped to 10-400 mg/dL. The full algebra for every curve, envelope, and guardrail is in docs/math.md.
Patient Model
Each virtual patient is defined by four skill dimensions sampled from a multivariate normal with configurable correlation (default 0.7):
| Skill | Governs |
|---|---|
| Dietary discipline (s1) | Carb amount per meal, number of meals/snacks, meal glycaemic index, meal-timing regularity. Low s1 patients eat higher-GI meals, more erratically. |
| Attentiveness (s2) | CGM check frequency, the hypo threshold, trend-based preemptive rescue carbs. |
| Dosing competence (s3) | The hypo threshold, how much absorbing rescue carbohydrate is counted before eating again, rage-eating, basal-dose noise. |
| Lifestyle consistency (s4) | Regularity of wake/sleep times, exercise frequency, meal-schedule stability, alcohol frequency, injection-site rotation. |
Skills are mapped through a sigmoid and clipped to a configurable range (default 0.15-0.98). Meals, CGM checks, rescue behavior and exercise habits derive from them; scheduled bolus dosing does not, and correction frequency follows CGM check frequency.
| Trait | Sampled | Governs |
|---|---|---|
body_weight_kg | Normal, clipped | HGO scale and the basal-dose anchor |
insulin_resistance_factor | Lognormal, clipped | is_base, icr, and the equilibrium anchor |
glucose_effectiveness | Lognormal around GE_RATE | Insulin-independent pull, zero by default |
ge_anchor | Normal about GE_EQ_ANCHOR_MEAN, lifted by resistance | Target of that pull |
ge_sigma_mult | Lognormal, clipped | Wander of that target |
meal_appetite | Lognormal, clipped | Per-meal carb amount |
bolus_type | Uniform over BOLUS_VARIANTS | Aspart, lispro, faster aspart or ultra-rapid lispro bolus PK |
basal_type | Uniform over BASAL_VARIANTS | Glargine U100 (73h), glargine U300 (101h) or degludec (133h) basal PK |
cgm_lag_minutes | Normal, clipped | Interstitial lag of this patient's sensor behind plasma glucose (0-20 min) |
These traits are sampled independently of skill and give the population its between-patient spread. Each patient's correction_factor is derived, not sampled: the true-BG drop 4 hours after one unit, from the patient's insulin action, HGO suppression and glucose effectiveness.
Insulin Sensitivity Model
Insulin sensitivity follows a diurnal pattern modeled as a sum of Gaussian bumps: a morning resistance peak around 7 AM (the dawn phenomenon, source of the classic morning BG rise) and a nighttime sensitivity dip around 2 AM that can cause nocturnal lows. The morning peak's timing shifts day-to-day (configurable sigma); a daily drift and per-step noise add further variability. During illness the IS factor ramps gradually toward a target and back down during recovery.
Modifiers applied on top of the diurnal pattern:
- Post-exercise sensitivity boost: IS is reduced by
EXERCISE_IS_REDUCTION(10%) forEXERCISE_IS_DURATION_HOURS(6h) after aerobic exercise — the effect behind nocturnal hypos in active patients. - Glucotoxicity: a slow 3h EMA of true BG drives transient insulin resistance when chronically elevated, closing a positive feedback loop on hyperglycemia (high BG → more IR → harder to bring down).
- Postprandial insulin resistance: while carbs are absorbing, the insulin-resistance factor is multiplied by
(1 + penalty), wherepenaltysaturates with active carb load. In T1DM the incretin / GLP-1 sensitivity boost non-diabetics get with a meal is blunted or absent, so the absorbing-carb state is if anything mildly insulin-resistant. - Injection site quality (lipohypertrophy): every dose (basal and bolus) is multiplied by a per-dose
site_qualityfactor fromN(1.0, σ)with σ scaling as1/s4— poor lifestyle consistency means poor site rotation and higher dose-to-dose variance.
Behavioral Events
-
Meals: number, timing, and carb amount are all skill-dependent, and each meal is one gamma absorption curve shaped by a glycaemic index drawn around the patient's
meal_gi_mean. The curve sums to the meal's logged grams. Meal times stay close to the daily schedule, so the small hours are meal-free. -
Basal insulin: one long-acting injection per day, anchored to
HGO_base × 24h × (body_weight_kg / BODY_WEIGHT_MEAN_KG) × is_base / ICRand absorbed through a Bateman one-compartment PK curvef(t) = exp(-ke·t) − exp(-ka·t)whose rates and action window are the patient's assigned analogue: glargine U100 (73h), glargine U300 (101h) or degludec (133h). The basal dose is not titrated to BG. -
Bolus insulin: scheduled count, clock time and dose are drawn independently of meals, carbs and BG — a deliberate departure from how patients dose, so the insulin channel carries its own effect rather than a meal's shadow. Each day has a night window of boluses in the meal-free small hours and a separate daytime stream; each day's units cover that day's planned meals and the liver output the basal leaves uncovered. Duration of action scales as
√doseabout a 5U reference. Almost every dose is preceded by a glance at the CGM: below the patient's own hypo threshold the bolus is skipped, and within 30 mg/dL above it the dose is cut. A CGM check while awake that reads above a high threshold can draw a correction bolus, sized to bring the reading to a target net of bolus insulin still on board, with a minimum gap between corrections (HYPER_CORRECTION_*). -
Hypo rescue: the CGM is checked at skill-dependent intervals while awake; asleep, only a reading below the 55 mg/dL severe threshold wakes the patient. What counts as low is one number per patient — a
hypo_thresholdspanning 70-90 mg/dL across the skill range — and that single value fires the rescue, gates every bolus, and sets the bar for exercise. A rescue is sized to lift the projected BG to 20 mg/dL above that threshold; the projection nets off rescue carbohydrate still absorbing, in a competence-scaled fraction, and a rage-eat roll drops that arithmetic. Attentive patients also eat small preemptive amounts when BG falls fast below 110 mg/dL. -
Exercise: skill-dependent probability, reduced on weekends, modelled as a negative carb-equivalent gamma curve plus the post-exercise IS boost above. A planned session starts only if BG sits at least 20 mg/dL above the patient's hypo threshold — exercise is negative food, so setting out already low drives BG straight down — and a session that never starts leaves no sensitivity tail behind it.
-
Alcohol: more likely on weekends, holidays, and rare event days, it suppresses HGO by 30–70% for 4–8 hours starting 1–2 hours after drinking — on top of insulin's own suppression — causing the delayed nocturnal lows common in real T1DM patients.
-
Stress events: occasional transient insulin-resistance multipliers (1.2–1.5×, 2–6h) model cortisol spikes from work, emotion, or poor sleep, at a frequency that falls with lifestyle consistency.
-
Weekday/weekend/holiday patterns: on weekends and holidays wake time shifts later, meal timing is more variable, carb amounts are slightly larger, and alcohol probability increases, with 10–20 configurable public holidays distributed across the year and never falling on a weekend.
-
Rare events: with low probability per day, the patient has a "chaotic day" where all skills are degraded and the schedule disrupted.
-
Illness: with low daily probability, the patient gets sick; insulin resistance ramps up over several days and returns to normal during recovery.
-
Anomalous events: with ~1% daily probability, one meal absorbs with a glycaemic index between 0 and 20, modelling delayed gastric emptying or an unusual food.
Installation and Usage
Requirements: Python 3.10+, numpy, pygame, pytest (for tests).
pip install numpy pygame pytest
Interactive visualizer:
python visualizer.py
python visualizer.py --seed 7 --bg 150 --hours 48
Programmatic usage:
from simulator import T1DMSimulator

sim = T1DMSimulator(seed=42, initial_bg=120)

# Step-by-step generation
step = sim.generate()   # returns dict with all values for this 5-min step
step = sim.generate()   # next step

# Bulk generation
data = sim.generate_hours(72)  # returns dict of numpy arrays

# Patient info
print(sim.get_patient_summary())

# Reseed
sim.reseed(seed=99)

# Inject a curve externally (e.g., for testing or custom scenarios)
import numpy as np
from simulator import gamma_curve
curve = gamma_curve(60.0, k=2.0, theta=15.0, duration_minutes=120.0)
sim.inject_curve(curve, sim.state.current_idx, 'carb', 'Custom meal')
Visualizer Controls
SPACE       Generate next 24 hours
R           Random reseed
1-9, 0      Toggle curve visibility
A           Toggle all curves
F           Cycle text size (small / medium / large)
Left/Right  Scroll timeline
+/-         Zoom in/out
HOME/END    Jump to start/end
Mouse       Hover for values
S           Screenshot (PNG)
Q/ESC       Quit
Curves: (1) Blood Glucose, (2) Carb Intake, (3) Insulin (total), (4) Basal, (5) Bolus, (6) Insulin Resistance (multiplier; >1 = resistant), (7) Exercise, (8) BG Delta, (9) Hepatic Output, (0) Glucose In.
Comparison Against Real-World Datasets
diff/README.md scores the simulator against three real CGM corpora — OhioT1DM, ShanghaiT1DM, and AZT1D — across distributional, variability, temporal, and episode metrics.
Comparison Against the UVA/Padova Simulator
uva_padova/README.md— the exact meals, boluses, and basal a seed generates are replayed verbatim into a paired UVA/Padova virtual patient, isolating how the two physiologies answer the same behaviour.uva_padova/EXCURSIONS.md— sharing only the meal schedule and letting each engine dose for its own physiology, post-meal excursions are compared in amplitude, time-to-peak, area, and amplitude-normalised shape.uva_padova/REALISM.md— each simulator is treated as a synthetic-data source and measured for how far its output sits from the real cohorts, with the distance between those cohorts as the yardstick.
Testing
python -m pytest tests/ -v
References
The comparison report in diff/README.md benchmarks the simulator against three publicly available T1D CGM datasets. Credit and citation requests for those datasets belong to their original authors.
-
OhioT1DM — Marling, C., and Bunescu, R. The OhioT1DM Dataset for Blood Glucose Level Prediction: Update 2020. Proceedings of the 5th International Workshop on Knowledge Discovery in Healthcare Data (KDH @ ECAI 2020), CEUR Workshop Proceedings, vol. 2675, pp. 71–74. Distributed under a data-use agreement via Ohio University; please request access through the maintainers' instructions before redistributing.
-
ShanghaiT1DM — Zhao, Q., Zhu, J., Shen, X., Lin, C., Zhang, Y., Liang, Y., Cao, B., Li, J., Liu, X., Rao, W., and Wang, C. Chinese Diabetes Datasets for Data-Driven Machine Learning. Scientific Data 10, 35 (2023). doi:10.1038/s41597-023-01940-7. The T1DM portion contains 12 patients / 16 records of paired CGM, insulin, and dietary data.
-
AZT1D — Khamesian, S., Arefeen, A., Thompson, B. M., Grando, M. A., and Ghasemzadeh, H. AZT1D: A Real-World Dataset for Type 1 Diabetes. Dataset of 25 individuals with T1D on Automated Insulin Delivery (Tandem t:slim X2 Control-IQ) collected at Mayo Clinic Arizona over 6–8 weeks per patient, including CGM, basal/bolus insulin (with correction-specific amounts and bolus types), carbohydrate intake, and device-mode annotations (regular / sleep / exercise). See the accompanying manuscript (Mayo Clinic / Arizona State University, 2025) for full study design and IRB protocol (#23-003065).
The in-silico comparison in uva_padova/README.md benchmarks the simulator against the UVA/Padova model, run through the open-source simglucose engine.
-
UVA/Padova Type 1 Diabetes Simulator — Dalla Man, C., Rizza, R. A., and Cobelli, C. Meal Simulation Model of the Glucose–Insulin System. IEEE Transactions on Biomedical Engineering 54(10), 1740–1749 (2007). doi:10.1109/TBME.2007.893506. Simulator update: Dalla Man, C., Micheletto, F., Lv, D., Breton, M., Kovatchev, B., and Cobelli, C. The UVA/PADOVA Type 1 Diabetes Simulator: New Features. Journal of Diabetes Science and Technology 8(1), 26–34 (2014). doi:10.1177/1932296813514502. The FDA-accepted 2008 version of this model is the in-silico reference used here.
-
simglucose — Xie, J. simglucose: A Type-1 Diabetes Simulator as a Reinforcement Learning Environment in OpenAI Gym (2018). An open-source Python implementation of the FDA-accepted UVA/Padova (2008) model. GitHub: https://github.com/jxx123/simglucose — the engine driven by the comparison scripts in
uva_padova/.
Related Projects
- T1DMAI — the transformer that consumes this simulator's output: training, evaluation, and the ExecuTorch exporter that produces the on-device artifact.
- T1DMDROID — the Android app that runs that exported model on-device against a live CGM feed.
License
Copyright 2026 0xdeadf1sh
Permission is hereby granted, free of charge, to any person obtaining a copy of this software and associated documentation files (the “Software”), to deal in the Software without restriction, including without limitation the rights to use, copy, modify, merge, publish, distribute, sublicense, and/or sell copies of the Software, and to permit persons to whom the Software is furnished to do so, subject to the following conditions:
The above copyright notice and this permission notice shall be included in all copies or substantial portions of the Software.
THE SOFTWARE IS PROVIDED “AS IS”, WITHOUT WARRANTY OF ANY KIND, EXPRESS OR IMPLIED, INCLUDING BUT NOT LIMITED TO THE WARRANTIES OF MERCHANTABILITY, FITNESS FOR A PARTICULAR PURPOSE AND NONINFRINGEMENT. IN NO EVENT SHALL THE AUTHORS OR COPYRIGHT HOLDERS BE LIABLE FOR ANY CLAIM, DAMAGES OR OTHER LIABILITY, WHETHER IN AN ACTION OF CONTRACT, TORT OR OTHERWISE, ARISING FROM, OUT OF OR IN CONNECTION WITH THE SOFTWARE OR THE USE OR OTHER DEALINGS IN THE SOFTWARE.
Similar repos




A seed-driven simulator for generating synthetic Type 1 Diabetes blood glucose data.
Python
2
153 commits
updated Oct 4, 2026
See what people are saying
README
T1DM Patient Behavior Simulator
A seed-driven simulator for generating synthetic Type 1 Diabetes blood glucose data. Unlike traditional glucose-insulin simulators (e.g., UVA/Padova), it models patient behavior as the primary driver of blood sugar outcomes: factor curves -- carbohydrate intake, insulin action, insulin sensitivity, and exercise -- are generated, and blood sugar emerges from their interactions.
Designed by a T1DM patient, informed by lived experience.
[!CAUTION] Research and educational use only. This project is a synthetic-data generator and a behavioral model of Type 1 Diabetes — not a medical device, and not clinically validated. Its output is artificial data, not real patient measurements, and must not be used to make medical, diagnostic, or treatment decisions, to calculate or adjust insulin doses, or to guide diabetes management in any way. For medical advice, consult a qualified healthcare professional. The software is provided "as is", without warranty of any kind, and the authors accept no liability for any use.
Table of contents
- Motivation
- Design Principles
- Architecture
- Blood Sugar Computation
- Patient Model
- Insulin Sensitivity Model
- Behavioral Events
- Installation and Usage
- Visualizer Controls
- Comparison Against Real-World Datasets
- Comparison Against the UVA/Padova Simulator
- Testing
- References
- Related Projects
- License
Motivation
Most T1DM simulators model physiology: glucose kinetics, insulin pharmacokinetics, compartmental models. They produce accurate BG traces but need dozens of physiological parameters that are hard to measure and vary between patients.
This one models the person, not the pancreas. Most real-world blood sugar variance comes from behavioral decisions -- what the patient eats, when they bolus, how they correct, whether they exercise -- not from subtle physiological differences. Generating diverse behavioral patterns and computing BG as a consequence yields training data whose target is what patients do, with blood sugar as the outcome: a near-unlimited stream of synthetic factor curves for pretraining personalized blood sugar prediction models, with real patient data reserved for fine-tuning.
Design Principles
-
Every factor is a curve, not a number. 40g of bread and 40g of orange juice both contribute 40g of carbs, but the juice's absorption peaks faster and falls faster. The same applies to rapid-acting vs long-acting insulin.
-
Behavior is driven by a latent skill profile. Four correlated skill dimensions decide what a patient eats, when, how accurately they dose, and how quickly they correct.
-
The liver is an insulin-suppressed feeding session. Hepatic glucose output (HGO) is a steady stream of "food" entering the bloodstream, throttled down by a Hill function of EMA-smoothed plasma insulin. A finite hepatic glycogen reservoir gates the glycogenolysis fraction, and large meals schedule a delayed HGO rebound 3.5-5.5h later — the mechanism behind nocturnal hyperglycemia after a big dinner. Basal insulin exists to counteract baseline HGO.
-
Exercise is negative food. Aerobic exercise pulls glucose out of the bloodstream into muscle cells, modeled as a negative carb-equivalent curve plus a lasting insulin-sensitivity boost.
-
Everything is seed-driven. A single integer fixes the patient's personality, physiology, daily schedule, meal choices, insulin doses, exercise patterns, illness events, and random noise. Same seed, same simulation, always.
Architecture
A seed fixes the virtual patient. A day planner turns that patient's latent skills into events, each event becomes a factor curve, and the metabolic core combines the curves into a 5-minute blood sugar delta. Solid arrows carry glucose or insulin and are badged by their effect on BG (⊕ raises, ⊖ lowers, ÷ divides the insulin term); the dashed arrow is multiplicative modulation; the dotted arrows are the two feedback loops -- the patient doses against the sensor rather than the true BG, and sustained hyperglycemia raises insulin resistance.
Blood Sugar Computation
At each 5-minute time step, the BG delta is computed as:
glucose_in  = carbs + hepatic_output - exercise
glucose_out = insulin_units * ICR / insulin_sensitivity
delta_BG    = alpha * (glucose_in - glucose_out) + S_g * (E(t) - BG)
alpha is BG_SCALE_FACTOR, the master constant converting abstract units to mg/dL. Insulin sensitivity divides the clearance term: resistant patients (IS > 1) clear less glucose per unit insulin, sensitive patients (IS < 1) clear more. HGO suppression by insulin is handled separately by the Hill function, so IS modulates only peripheral insulin action.
S_g * (E(t) - BG) is glucose effectiveness — the Bergman-minimal-model insulin-independent pull toward a stochastic equilibrium E(t), without which within-band BG would drift as an undamped integrator of net flux. It is set to zero: below 180 mg/dL only insulin brings blood sugar down.
Absorption noise perturbs the carbs and insulin that reach the blood; the recorded carb and insulin channels are the declared curves.
Three physiological guardrails are then applied to the delta:
- Renal clearance: above 180 mg/dL, the kidneys excrete glucose proportionally to the excess, at the rate the UVA/Padova simulator uses.
- Counter-regulatory response: below 70 mg/dL, glucagon and cortisol add glucose in proportion to the deficit.
- Severe-hypo glucagon term: below
SEVERE_HYPO_THRESHOLD, a further release proportional to severity.
Both low-side terms are weak, so a unit of insulin lowers BG by about the same amount from 105 as from 190 mg/dL. True BG has no floor; a soft ceiling and a hard clamp at 400 mg/dL bound it above. The CGM reading is clipped to 10-400 mg/dL. The full algebra for every curve, envelope, and guardrail is in docs/math.md.
Patient Model
Each virtual patient is defined by four skill dimensions sampled from a multivariate normal with configurable correlation (default 0.7):
| Skill | Governs |
|---|---|
| Dietary discipline (s1) | Carb amount per meal, number of meals/snacks, meal glycaemic index, meal-timing regularity. Low s1 patients eat higher-GI meals, more erratically. |
| Attentiveness (s2) | CGM check frequency, the hypo threshold, trend-based preemptive rescue carbs. |
| Dosing competence (s3) | The hypo threshold, how much absorbing rescue carbohydrate is counted before eating again, rage-eating, basal-dose noise. |
| Lifestyle consistency (s4) | Regularity of wake/sleep times, exercise frequency, meal-schedule stability, alcohol frequency, injection-site rotation. |
Skills are mapped through a sigmoid and clipped to a configurable range (default 0.15-0.98). Meals, CGM checks, rescue behavior and exercise habits derive from them; scheduled bolus dosing does not, and correction frequency follows CGM check frequency.
| Trait | Sampled | Governs |
|---|---|---|
body_weight_kg | Normal, clipped | HGO scale and the basal-dose anchor |
insulin_resistance_factor | Lognormal, clipped | is_base, icr, and the equilibrium anchor |
glucose_effectiveness | Lognormal around GE_RATE | Insulin-independent pull, zero by default |
ge_anchor | Normal about GE_EQ_ANCHOR_MEAN, lifted by resistance | Target of that pull |
ge_sigma_mult | Lognormal, clipped | Wander of that target |
meal_appetite | Lognormal, clipped | Per-meal carb amount |
bolus_type | Uniform over BOLUS_VARIANTS | Aspart, lispro, faster aspart or ultra-rapid lispro bolus PK |
basal_type | Uniform over BASAL_VARIANTS | Glargine U100 (73h), glargine U300 (101h) or degludec (133h) basal PK |
cgm_lag_minutes | Normal, clipped | Interstitial lag of this patient's sensor behind plasma glucose (0-20 min) |
These traits are sampled independently of skill and give the population its between-patient spread. Each patient's correction_factor is derived, not sampled: the true-BG drop 4 hours after one unit, from the patient's insulin action, HGO suppression and glucose effectiveness.
Insulin Sensitivity Model
Insulin sensitivity follows a diurnal pattern modeled as a sum of Gaussian bumps: a morning resistance peak around 7 AM (the dawn phenomenon, source of the classic morning BG rise) and a nighttime sensitivity dip around 2 AM that can cause nocturnal lows. The morning peak's timing shifts day-to-day (configurable sigma); a daily drift and per-step noise add further variability. During illness the IS factor ramps gradually toward a target and back down during recovery.
Modifiers applied on top of the diurnal pattern:
- Post-exercise sensitivity boost: IS is reduced by
EXERCISE_IS_REDUCTION(10%) forEXERCISE_IS_DURATION_HOURS(6h) after aerobic exercise — the effect behind nocturnal hypos in active patients. - Glucotoxicity: a slow 3h EMA of true BG drives transient insulin resistance when chronically elevated, closing a positive feedback loop on hyperglycemia (high BG → more IR → harder to bring down).
- Postprandial insulin resistance: while carbs are absorbing, the insulin-resistance factor is multiplied by
(1 + penalty), wherepenaltysaturates with active carb load. In T1DM the incretin / GLP-1 sensitivity boost non-diabetics get with a meal is blunted or absent, so the absorbing-carb state is if anything mildly insulin-resistant. - Injection site quality (lipohypertrophy): every dose (basal and bolus) is multiplied by a per-dose
site_qualityfactor fromN(1.0, σ)with σ scaling as1/s4— poor lifestyle consistency means poor site rotation and higher dose-to-dose variance.
Behavioral Events
-
Meals: number, timing, and carb amount are all skill-dependent, and each meal is one gamma absorption curve shaped by a glycaemic index drawn around the patient's
meal_gi_mean. The curve sums to the meal's logged grams. Meal times stay close to the daily schedule, so the small hours are meal-free. -
Basal insulin: one long-acting injection per day, anchored to
HGO_base × 24h × (body_weight_kg / BODY_WEIGHT_MEAN_KG) × is_base / ICRand absorbed through a Bateman one-compartment PK curvef(t) = exp(-ke·t) − exp(-ka·t)whose rates and action window are the patient's assigned analogue: glargine U100 (73h), glargine U300 (101h) or degludec (133h). The basal dose is not titrated to BG. -
Bolus insulin: scheduled count, clock time and dose are drawn independently of meals, carbs and BG — a deliberate departure from how patients dose, so the insulin channel carries its own effect rather than a meal's shadow. Each day has a night window of boluses in the meal-free small hours and a separate daytime stream; each day's units cover that day's planned meals and the liver output the basal leaves uncovered. Duration of action scales as
√doseabout a 5U reference. Almost every dose is preceded by a glance at the CGM: below the patient's own hypo threshold the bolus is skipped, and within 30 mg/dL above it the dose is cut. A CGM check while awake that reads above a high threshold can draw a correction bolus, sized to bring the reading to a target net of bolus insulin still on board, with a minimum gap between corrections (HYPER_CORRECTION_*). -
Hypo rescue: the CGM is checked at skill-dependent intervals while awake; asleep, only a reading below the 55 mg/dL severe threshold wakes the patient. What counts as low is one number per patient — a
hypo_thresholdspanning 70-90 mg/dL across the skill range — and that single value fires the rescue, gates every bolus, and sets the bar for exercise. A rescue is sized to lift the projected BG to 20 mg/dL above that threshold; the projection nets off rescue carbohydrate still absorbing, in a competence-scaled fraction, and a rage-eat roll drops that arithmetic. Attentive patients also eat small preemptive amounts when BG falls fast below 110 mg/dL. -
Exercise: skill-dependent probability, reduced on weekends, modelled as a negative carb-equivalent gamma curve plus the post-exercise IS boost above. A planned session starts only if BG sits at least 20 mg/dL above the patient's hypo threshold — exercise is negative food, so setting out already low drives BG straight down — and a session that never starts leaves no sensitivity tail behind it.
-
Alcohol: more likely on weekends, holidays, and rare event days, it suppresses HGO by 30–70% for 4–8 hours starting 1–2 hours after drinking — on top of insulin's own suppression — causing the delayed nocturnal lows common in real T1DM patients.
-
Stress events: occasional transient insulin-resistance multipliers (1.2–1.5×, 2–6h) model cortisol spikes from work, emotion, or poor sleep, at a frequency that falls with lifestyle consistency.
-
Weekday/weekend/holiday patterns: on weekends and holidays wake time shifts later, meal timing is more variable, carb amounts are slightly larger, and alcohol probability increases, with 10–20 configurable public holidays distributed across the year and never falling on a weekend.
-
Rare events: with low probability per day, the patient has a "chaotic day" where all skills are degraded and the schedule disrupted.
-
Illness: with low daily probability, the patient gets sick; insulin resistance ramps up over several days and returns to normal during recovery.
-
Anomalous events: with ~1% daily probability, one meal absorbs with a glycaemic index between 0 and 20, modelling delayed gastric emptying or an unusual food.
Installation and Usage
Requirements: Python 3.10+, numpy, pygame, pytest (for tests).
pip install numpy pygame pytest
Interactive visualizer:
python visualizer.py
python visualizer.py --seed 7 --bg 150 --hours 48
Programmatic usage:
from simulator import T1DMSimulator

sim = T1DMSimulator(seed=42, initial_bg=120)

# Step-by-step generation
step = sim.generate()   # returns dict with all values for this 5-min step
step = sim.generate()   # next step

# Bulk generation
data = sim.generate_hours(72)  # returns dict of numpy arrays

# Patient info
print(sim.get_patient_summary())

# Reseed
sim.reseed(seed=99)

# Inject a curve externally (e.g., for testing or custom scenarios)
import numpy as np
from simulator import gamma_curve
curve = gamma_curve(60.0, k=2.0, theta=15.0, duration_minutes=120.0)
sim.inject_curve(curve, sim.state.current_idx, 'carb', 'Custom meal')
Visualizer Controls
SPACE       Generate next 24 hours
R           Random reseed
1-9, 0      Toggle curve visibility
A           Toggle all curves
F           Cycle text size (small / medium / large)
Left/Right  Scroll timeline
+/-         Zoom in/out
HOME/END    Jump to start/end
Mouse       Hover for values
S           Screenshot (PNG)
Q/ESC       Quit
Curves: (1) Blood Glucose, (2) Carb Intake, (3) Insulin (total), (4) Basal, (5) Bolus, (6) Insulin Resistance (multiplier; >1 = resistant), (7) Exercise, (8) BG Delta, (9) Hepatic Output, (0) Glucose In.
Comparison Against Real-World Datasets
diff/README.md scores the simulator against three real CGM corpora — OhioT1DM, ShanghaiT1DM, and AZT1D — across distributional, variability, temporal, and episode metrics.
Comparison Against the UVA/Padova Simulator
uva_padova/README.md— the exact meals, boluses, and basal a seed generates are replayed verbatim into a paired UVA/Padova virtual patient, isolating how the two physiologies answer the same behaviour.uva_padova/EXCURSIONS.md— sharing only the meal schedule and letting each engine dose for its own physiology, post-meal excursions are compared in amplitude, time-to-peak, area, and amplitude-normalised shape.uva_padova/REALISM.md— each simulator is treated as a synthetic-data source and measured for how far its output sits from the real cohorts, with the distance between those cohorts as the yardstick.
Testing
python -m pytest tests/ -v
References
The comparison report in diff/README.md benchmarks the simulator against three publicly available T1D CGM datasets. Credit and citation requests for those datasets belong to their original authors.
-
OhioT1DM — Marling, C., and Bunescu, R. The OhioT1DM Dataset for Blood Glucose Level Prediction: Update 2020. Proceedings of the 5th International Workshop on Knowledge Discovery in Healthcare Data (KDH @ ECAI 2020), CEUR Workshop Proceedings, vol. 2675, pp. 71–74. Distributed under a data-use agreement via Ohio University; please request access through the maintainers' instructions before redistributing.
-
ShanghaiT1DM — Zhao, Q., Zhu, J., Shen, X., Lin, C., Zhang, Y., Liang, Y., Cao, B., Li, J., Liu, X., Rao, W., and Wang, C. Chinese Diabetes Datasets for Data-Driven Machine Learning. Scientific Data 10, 35 (2023). doi:10.1038/s41597-023-01940-7. The T1DM portion contains 12 patients / 16 records of paired CGM, insulin, and dietary data.
-
AZT1D — Khamesian, S., Arefeen, A., Thompson, B. M., Grando, M. A., and Ghasemzadeh, H. AZT1D: A Real-World Dataset for Type 1 Diabetes. Dataset of 25 individuals with T1D on Automated Insulin Delivery (Tandem t:slim X2 Control-IQ) collected at Mayo Clinic Arizona over 6–8 weeks per patient, including CGM, basal/bolus insulin (with correction-specific amounts and bolus types), carbohydrate intake, and device-mode annotations (regular / sleep / exercise). See the accompanying manuscript (Mayo Clinic / Arizona State University, 2025) for full study design and IRB protocol (#23-003065).
The in-silico comparison in uva_padova/README.md benchmarks the simulator against the UVA/Padova model, run through the open-source simglucose engine.
-
UVA/Padova Type 1 Diabetes Simulator — Dalla Man, C., Rizza, R. A., and Cobelli, C. Meal Simulation Model of the Glucose–Insulin System. IEEE Transactions on Biomedical Engineering 54(10), 1740–1749 (2007). doi:10.1109/TBME.2007.893506. Simulator update: Dalla Man, C., Micheletto, F., Lv, D., Breton, M., Kovatchev, B., and Cobelli, C. The UVA/PADOVA Type 1 Diabetes Simulator: New Features. Journal of Diabetes Science and Technology 8(1), 26–34 (2014). doi:10.1177/1932296813514502. The FDA-accepted 2008 version of this model is the in-silico reference used here.
-
simglucose — Xie, J. simglucose: A Type-1 Diabetes Simulator as a Reinforcement Learning Environment in OpenAI Gym (2018). An open-source Python implementation of the FDA-accepted UVA/Padova (2008) model. GitHub: https://github.com/jxx123/simglucose — the engine driven by the comparison scripts in
uva_padova/.
Related Projects
- T1DMAI — the transformer that consumes this simulator's output: training, evaluation, and the ExecuTorch exporter that produces the on-device artifact.
- T1DMDROID — the Android app that runs that exported model on-device against a live CGM feed.
License
Copyright 2026 0xdeadf1sh
Permission is hereby granted, free of charge, to any person obtaining a copy of this software and associated documentation files (the “Software”), to deal in the Software without restriction, including without limitation the rights to use, copy, modify, merge, publish, distribute, sublicense, and/or sell copies of the Software, and to permit persons to whom the Software is furnished to do so, subject to the following conditions:
The above copyright notice and this permission notice shall be included in all copies or substantial portions of the Software.
THE SOFTWARE IS PROVIDED “AS IS”, WITHOUT WARRANTY OF ANY KIND, EXPRESS OR IMPLIED, INCLUDING BUT NOT LIMITED TO THE WARRANTIES OF MERCHANTABILITY, FITNESS FOR A PARTICULAR PURPOSE AND NONINFRINGEMENT. IN NO EVENT SHALL THE AUTHORS OR COPYRIGHT HOLDERS BE LIABLE FOR ANY CLAIM, DAMAGES OR OTHER LIABILITY, WHETHER IN AN ACTION OF CONTRACT, TORT OR OTHERWISE, ARISING FROM, OUT OF OR IN CONNECTION WITH THE SOFTWARE OR THE USE OR OTHER DEALINGS IN THE SOFTWARE.